


Understanding Market Trends
FXOpen

In the dynamic realm of trading, traders deploy an array of instruments to intelligently navigate the fluid landscape of the market. Among these tools, technical analysis stands out, aiding traders in dissecting historical price shifts, chart formations, and prevailing market trends. This analytical approach empowers traders to formulate informed projections regarding potential price movements. Our article will answer the question: “What is trend analysis?”
What Is Trend Analysis in Trading?
A trend is commonly understood as the general direction in which a market's price is moving. Trend analysis stands as a pivotal instrument in the toolkit of traders and investors. Its role involves a meticulous examination of historical data aimed at uncovering patterns that hold the potential to illuminate the future trajectory of markets.
Traders employ trend analysis by strategically aligning their positions with the identified trends. In an uptrend, where prices are consistently rising, traders open buy positions with the anticipation that the upward momentum will continue, enabling them to capitalise on the price appreciation. During a downtrend, characterised by falling prices, traders opt to open sell positions, aiming to profit from the anticipated further decline in prices. In a sideways market, traders use a swing trading approach, buying near a support trendline and selling near a resistance trendline.
By trading within the context of a trend, traders essentially leverage the established market direction to their advantage. This approach is rooted in the idea that markets often exhibit a degree of persistence in their movements, and trends tend to persist until there's a significant change in the underlying factors driving them. As such, traders strategically use trend analysis to align their trading decisions with the prevailing market dynamics, enhancing their chances of making profitable trades.
Types of Trends by Direction
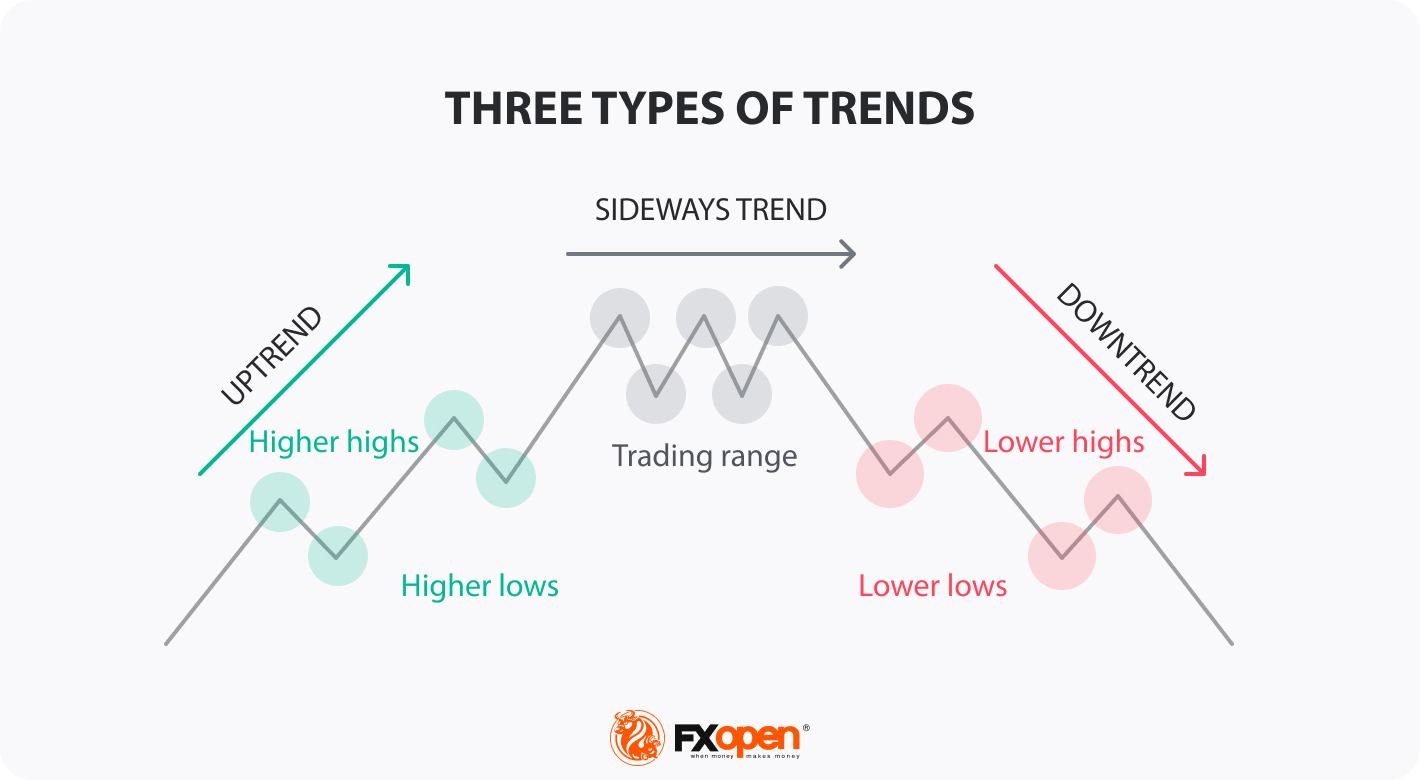
Classification-wise, trends typically find themselves fitting into three primary categories:
- Uptrend: This particular trend comes into play when the asset's price consistently establishes higher highs and higher lows across a designated timeframe. This occurrence indicates an ascendancy of buyers, signifying a growth in the asset's value.
- Downtrend: As the antithesis of an uptrend, the downtrend manifests when the price sets lower highs and lows. Such a trend signals the dominance of sellers, pointing towards a depreciation in the asset's value.
- Sideways Trend: The sideways trend, also referred to as the range-bound trend, emerges when the price meanders within a relatively confined range without any distinct inclination towards upward or downward movement. This situation implies a state of equilibrium between buyers and sellers.
Types of Trends by Period
Another category is a trend period. There are short, intermediate-, and long-term trends. Traders often perform analysis of market trends on different timeframes to identify opportunities for various trading strategies. Common timeframes include:
- Short-term (Intraday): Minutes to hours.
- Medium-term (Swing): Days to weeks.
- Long-term: Months to years.
How to Identify Trends
There are a series of tools you may use to identify trends in the financial markets. Let's go through a couple of them:
- trend indicators (e.g., moving averages and ADX), which show the direction and strength of a trend; momentum indicators (e.g., RSI and stochastic oscillator), which assess the speed and strength of price changes;
- trendlines are drawn to visualise trend direction and support/resistance levels;
- chart patterns (e.g., head and shoulders, triangles), which reveal potential reversals or continuations of a trend.
However, these tools offer insights rather than certainties, and a holistic approach, including fundamental analysis and market sentiment, is crucial for accurate trend assessment. Traders may choose to use all or any one of these tools.
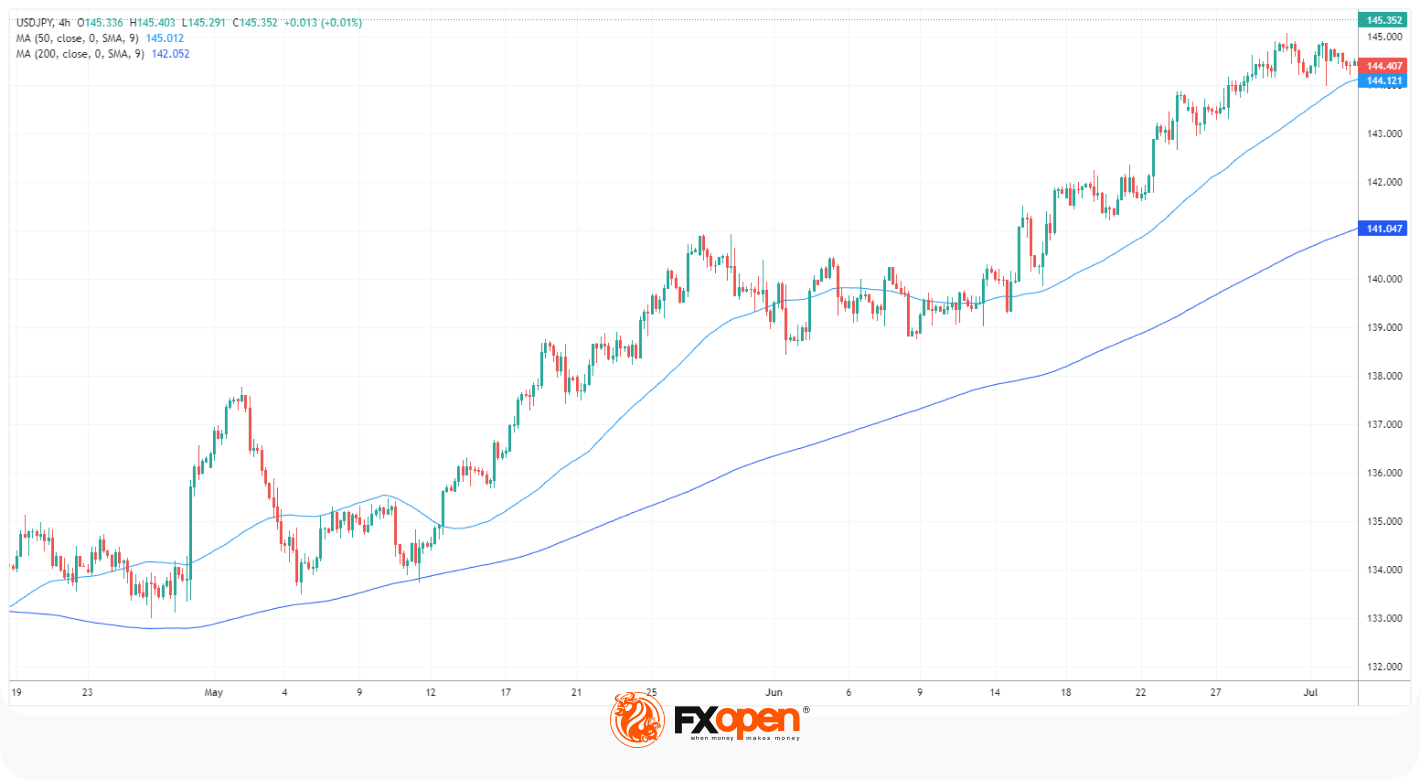
Example of a Trend Analysis
A trader performs trend analysis on the H4 chart of the USD/JPY pair. The 50-period moving average is also consistently above the 200-period moving average, suggesting an uptrend on the TickTrader chart by FXOpen.
Advantages of Trend Analysis
Here are some pros of trend analysis:
- Clarity: It provides a clear visual representation of market direction, aiding decision-making.
- Entry and Exit Points: It may help traders determine optimal entry and exit points for trades.
- Risk Management: Understanding trend analysis may help manage risk by avoiding counter-trend trades.
Disadvantages of Trend Analysis
Here are some of the downsides of trend analysis:
- Lagging Indicator: It is based on historical data, which may not accurately predict sudden market changes.
- False Signals: They can reverse unexpectedly, leading to false signals and potential losses.
- Over-Reliance: Relying solely on trend analysis may overlook other market factors.
The Bottom Line
It's essential to supplement trend analysis with other forms of technical and fundamental research to gain a comprehensive view of the market. Remember that all trading involves risk, and prudent risk management strategies should always be employed. As you begin understanding trends in the stock market and other financial instruments, you may open an FXOpen account and employ your strategy on various instruments.
This article represents the opinion of the Companies operating under the FXOpen brand only. It is not to be construed as an offer, solicitation, or recommendation with respect to products and services provided by the Companies operating under the FXOpen brand, nor is it to be considered financial advice.
Stay ahead of the market!
Subscribe now to our mailing list and receive the latest market news and insights delivered directly to your inbox.


Latest articles

Brent Crude Oil: From Ceasefire to Crossfire — What's Next?
Just weeks ago, traders were pricing in peace. Now they're pricing in war again—and that reversal says everything about how fragile the current Middle East calm really is.
Brent crude has surged to $86 a barrel, its highest level

AUD/USD and USD/CAD React to Softer US Inflation
Commodity-linked currencies strengthened after US inflation data came in weaker than expected. The Consumer Price Index (CPI) slowed to 3.5% year-on-year in June, below the 3.8% forecast, while core inflation eased to 2.6% versus expectations of 2.

NVIDIA: Kyber NVL144 Dispute Weighs on the Stock
NVIDIA shares found themselves at the centre of debate over the future of the Kyber NVL144 system. On 6 July, CNBC, citing research firm SemiAnalysis, reported that the project could be delayed by more than a year—from 2027 to