


Understanding the Long-Legged Doji Candlestick Pattern
FXOpen
Traders in financial markets are often intrigued by the long-legged doji, a candlestick pattern that stands out due to its distinctive shape and position on charts. In this article, we will explore the long-legged doji candle, emphasising its importance for trading and offering insights into how traders may implement it into their trading strategies.
What Is a Long-Legged Doji Pattern?
The long-legged doji candlestick pattern occurs when the opening and closing prices of an asset are very close or even equal to each other, resulting in a very small real body. However, the candle includes long upper and lower shadows. These indicate that there was significant price movement during the trading session, but ultimately, the market closed near its opening price.
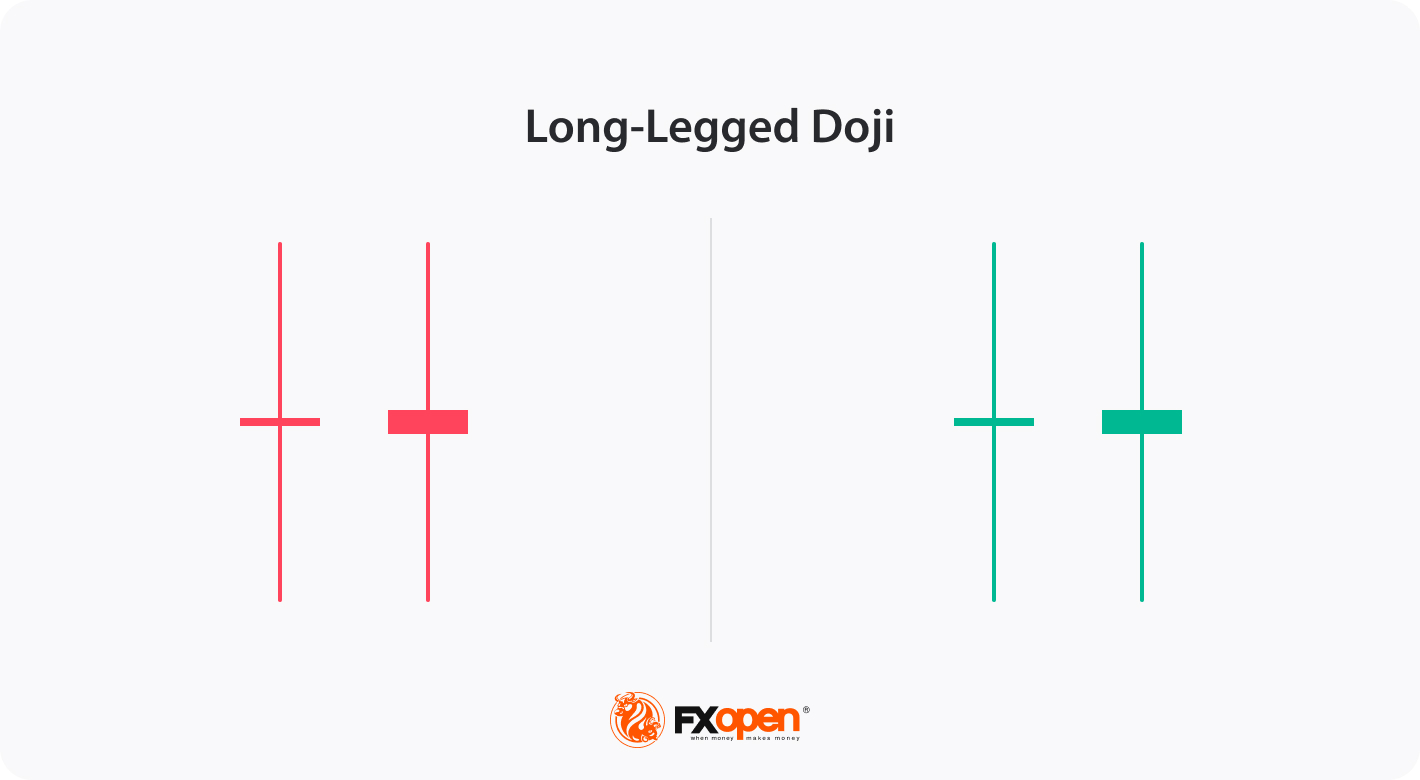
A red long-legged doji refers to a bar with a bearish real body, while a green long-legged doji highlights a bullish market sentiment; however, the colour isn’t very important.
Regardless of the timeframe, it can be analysed when trading different financial instruments, including stocks, cryptocurrencies*, ETFs, indices, and forex. Traders can trade all these instruments with the FXOpen platform.
How to Identify a Long-Legged Doji
The technical analysis of a long-legged doji may require you to look for the following characteristics:
- A small real body where the opening and closing prices are close to each other. The candle may have any colour.
- Extended upper and lower shadows, with the same or almost the same length.
- The absence of a body compared to the length of the shadows.
These are key points of the doji trading:
- A long-legged doji at the bottom of a downtrend may signal a potential reversal or the exhaustion of selling pressure.
- When a long-legged doji is at the top of an uptrend, it may indicate a potential reversal in the upward market movement. Two long-legged dojis at resistance or support levels may provide additional confirmation of a trend reversal.
- If a candle appears within a solid trend, it may signal a short-term consolidation.
Trading a Long-Legged Doji
Trading this pattern involves considering its implications and combining it with other technical analysis tools. Here are some steps traders may look over:
- Identify the setup: Look for a candlestick with a small real body and long upper and lower wicks.
- Analyse the market context: Consider the prevailing trend before the formation. If it appears after a prolonged uptrend, it may suggest a potential bullish reversal. Conversely, if it occurs after a prolonged downtrend, it may indicate a possible bearish reversal. If the formation appears within a solid trend, it may signal a trend continuation.
- Set entry and exit levels: You may choose to enter the trade when the market moves beyond the high or low of the candle; depending on the anticipated direction, set your stop-loss order below the low (in a bullish scenario) or above the high (in a bearish scenario) of the bar. A take-profit target placement may be based on your risk-reward ratio or by identifying significant support or resistance levels.
The free TickTrader platform empowers traders to enhance their trading strategies by improving their price action skills. With this platform, traders may analyse and interpret market dynamics based solely on market movements.
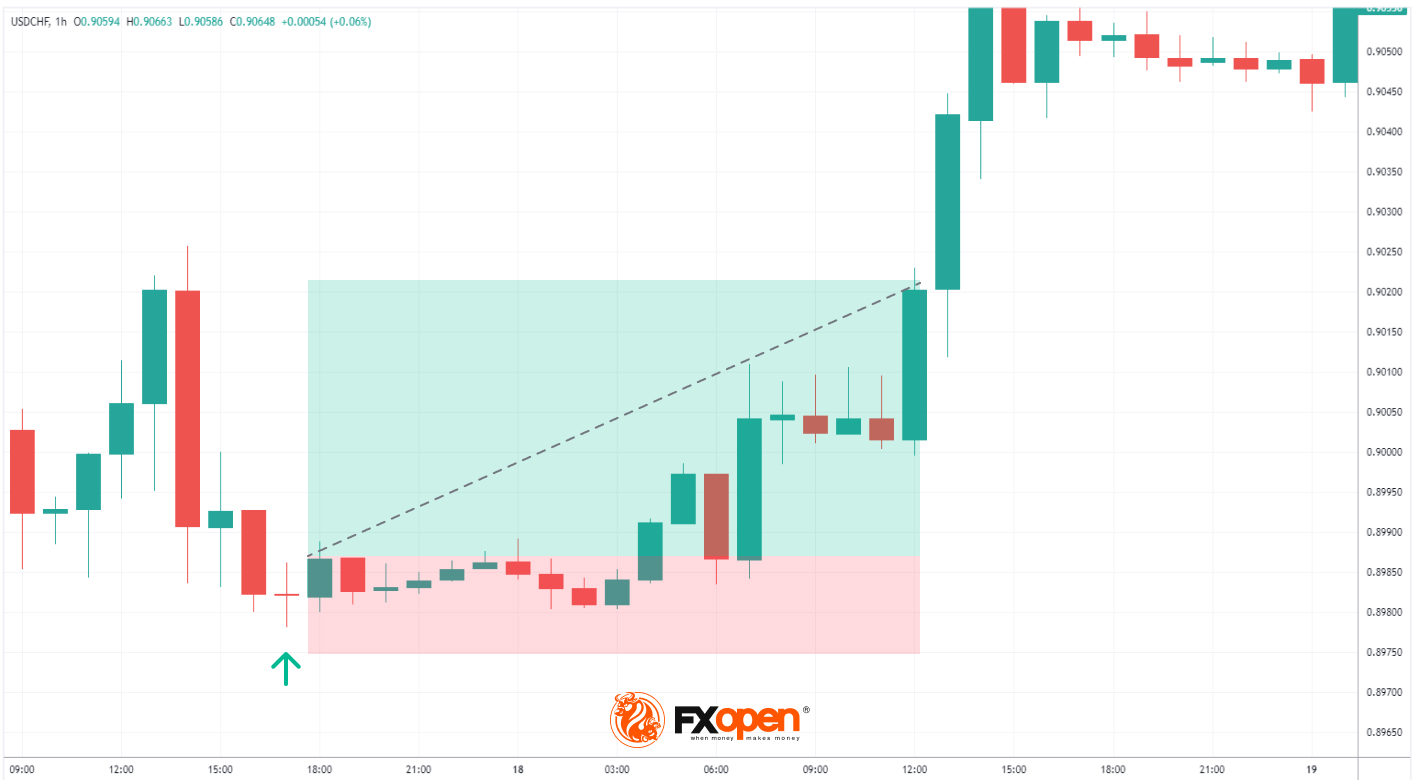
Live Example
A trader identifies a long-legged doji on the top of 20-period EMA (exponential moving average) and a support level. They place a buy order above the bar's high with a stop loss beneath this and the support level. The take-profit target is the closest resistance level. In this scenario, the long-legged doji reversal pattern pulled the market upwards.
Types of Doji Patterns
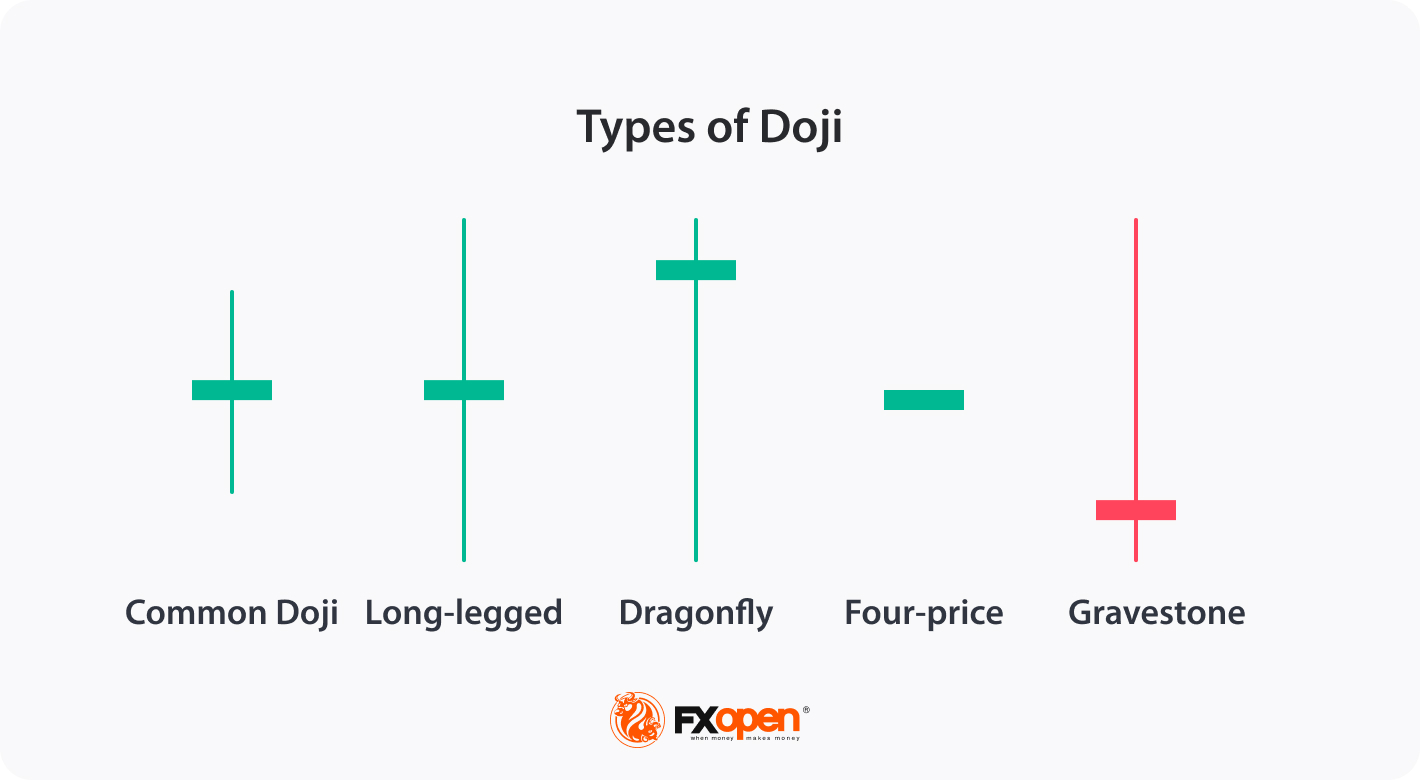
Dojis can come in different variations, each with its own interpretation. Here are a few common types other than the long-legged one:
- Common doji: This candle resembles the long-legged one but has shorter shadows. It reflects a balance between buyers and sellers.
- Four-price: This is a candle with open, high, low, and close prices at the same levels. This rarely occurs on price charts and indicates a high level of market indecision. Traders may find it in low-volume markets.
- Dragonfly: It has an extended lower shadow, a small or non-existent upper shadow, and a tiny body. This formation suggests a potential bullish reversal.
- Gravestone: This candle has an extended upper shadow, a small or non-existent lower shadow, and a tiny body. It indicates a potential bearish reversal.
Closing Thoughts
While the long-legged doji may provide valuable insights into market sentiment, it is important to consider other technical analysis tools and confirmation from subsequent price action before making trading decisions, as the doji reflects market uncertainties, and its signals aren’t very strong. Once traders have developed confidence in their analysis, they can take the next step by opening an account with FXOpen, enabling them to participate in live market trading.
FAQ
What does a long-legged doji indicate?
This formation reflects market indecision, potential reversals and trend continuations. When this pattern forms on a chart, it suggests that buyers and sellers are uncertain about the future direction of the asset's price. Therefore, traders consider the overall trend and prevailing market conditions.
Is long-legged doji bullish or bearish?
The pattern alone does not provide a definitive bullish or bearish signal. It is important to consider the overall market context, trend, support and resistance levels, and other technical analysis tools to assess the likelihood of a bullish or bearish outcome.
What are the different types of doji?
The major doji types are long-legged, gravestone, dragonfly, and the four-price. Each has unique characteristics and provides specific signals.
Is a doji candle bullish or bearish?
The interpretation of this formation as bullish or bearish depends on its context and the subsequent price action. On its own, it does not provide a clear indication of market direction. In general, a doji candle represents market indecision and a balance between buyers and sellers, with neither side having a clear advantage.
What does a long-legged doji shadow mean?
Long shadows always suggest intense volatility and uncertainty, with buyers and sellers struggling to take control of the market.
What is the meaning of a long-legged doji candle?
The meaning of a long-legged doji candle is that it reflects a state of market indecision and potential reversals.
*At FXOpen UK and FXOpen AU, Cryptocurrency CFDs are only available for trading by those clients categorised as Professional clients under FCA Rules and Professional clients under ASIC Rules, respectively. They are not available for trading by Retail clients.
This article represents the opinion of the Companies operating under the FXOpen brand only. It is not to be construed as an offer, solicitation, or recommendation with respect to products and services provided by the Companies operating under the FXOpen brand, nor is it to be considered financial advice.
Stay ahead of the market!
Subscribe now to our mailing list and receive the latest market news and insights delivered directly to your inbox.


Latest articles

Weekly Market Insights with Gary Thomson: The Week of Central Banks and Earnings
In this video, we’ll explore the key economic events and market trends, shaping the financial landscape. Get ready for insights into financial markets to help you navigate the week ahead. Let’s dive in!
In this episode of Market

Intel at a Crossroads: Earnings Beat Meets Technical Resistance
Intel has just delivered its strongest quarter in over fifteen years, and the market reaction says it all. Q2 2026 revenue surged 25% year-over-year to $16.1 billion, crushing the consensus estimate of $14.42 billion, while adjusted EPS of

Tesla: Complex Range Structure Breaks Down Following Quarterly Earnings
Tesla released its Q2 2026 results after the market closed on 22 July. Revenue increased 26% year-on-year to $28.24 billion, while vehicle deliveries reached a record 480,126 units. However, operating margin fell sharply to 1.4%, down from