


Understanding the White Marubozu Candlestick Pattern
FXOpen
In the world of trading, market participants use many tools to make smart choices in ever-changing markets. One of these tools is called technical analysis, which helps traders study past price movements, chart patterns, and market trends to make educated guesses about where prices might go next. Today, we'll look at one specific pattern called the White Marubozu and see how it fits into the bigger picture of trading.
What Is a White Marubozu Pattern?
A White Marubozu candlestick definition is the following: A White Marubozu is a candlestick pattern that reflects strong bullish sentiment in financial markets. It features a long bullish body (it’s called White as bullish candles are usually hollow) with no upper or lower shadows, indicating that the price opened at or near its low and closed at or near its high for the given time period. This lack of shadows suggests minimal price retracement and reflects robust buying pressure and trader confidence. The White Marubozu indicates that there is a potential for a continuation or reversal of a trend, depending on its alignment with the prevailing price trend and other technical factors.

Is There a Black Marubozu?
Just as there is a White Marubozu, there's also a counterpart, the Black Marubozu. It indicates significant selling pressure prevailing throughout the entire trading session. This dominance by bears is evident from the opening to the closing price. The lack of upper and lower shadows within the candlestick signifies minimal price fluctuation. This absence of fluctuation is often seen as an indicator that the bears are firmly in control and that there's limited or no bullish response to counter their impact.
Trading the White Marubozu Pattern
Traders may use the following steps to trade with the setup:
- Entry: When spotting the setup, traders may consider entering a long (buy) position as soon as the upcoming bar closes above the high of the formation. This indicates a strong possibility of upward momentum.
- Take Profit: To set a take-profit level, traders can look at recent resistance levels or use other technical indicators to gauge potential targets. However, it's essential to remain cautious of overextending profits as candlestick patterns usually provide short-term signals.
- Stop Loss: Placing a stop loss is crucial to manage risk. This can be set below the low of the Marubozu or a nearby support level. This way, if the bullish momentum reverses, losses can be minimised.
You can experiment with the formation without any cost on the TickTrader platform offered by FXOpen.
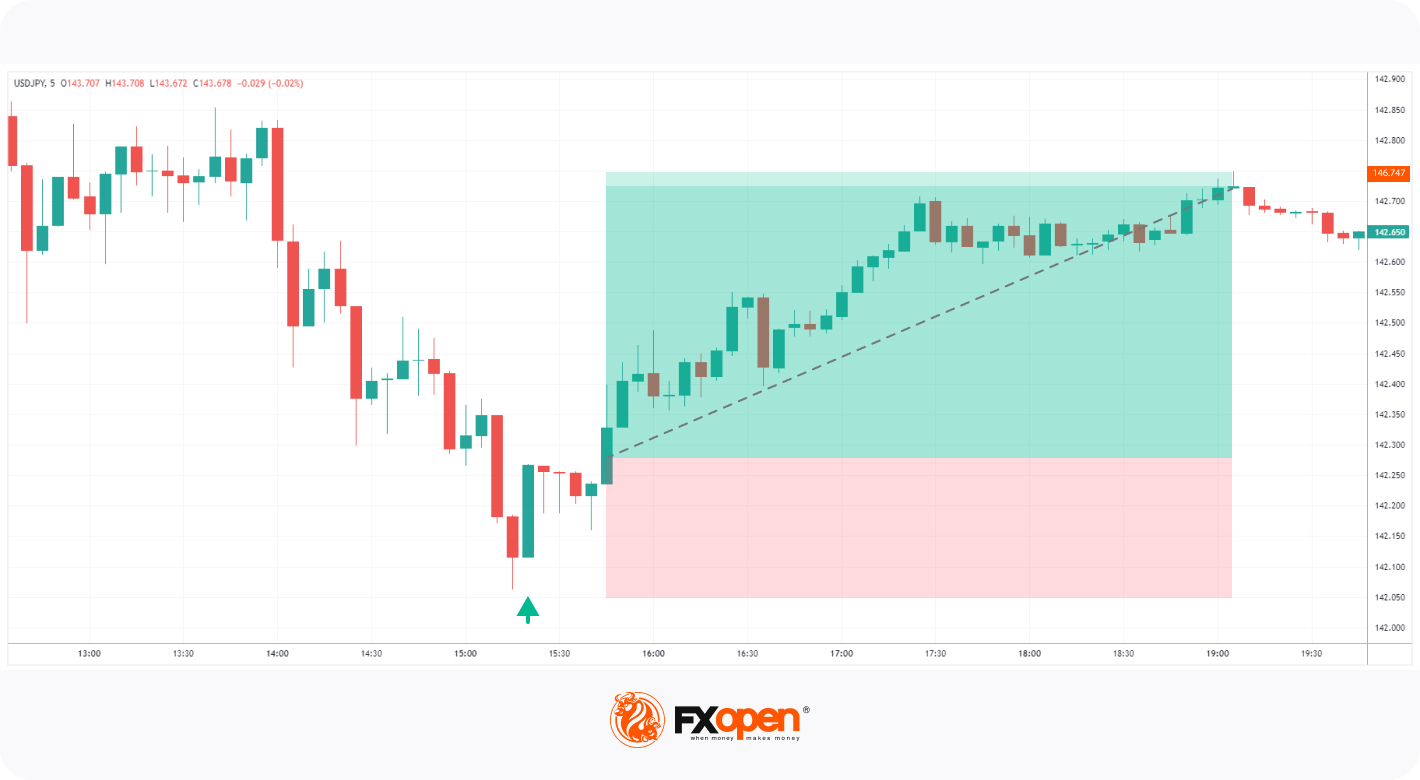
Live Market Example
A trader finds a White Marubozu setup on the M5 chart of the USD/JPY pair. They enter a long when the bullish bar crosses the high of the setup. Their take profit is at the resistance with a stop loss below the candle.
Takeaway
Like any trading signal, it's essential to use the White Marubozu in conjunction with other tools and indicators. Effective risk management through appropriate stop-loss and take-profit levels limits potential losses. Remember that trading involves risks; thorough analysis and prudent decision-making are key to consistent success. As you enhance your abilities, you have the option to trade the setup in a live market trading; for this, you can open an FXOpen account.
FAQ
What is a White Marubozu in the stock market?
In stock market analysis, a White Marubozu refers to a distinct candlestick pattern that predicts a stock rise. This pattern is recognised by its unique appearance on a candlestick chart. It has a long body that lacks shadows on either end or includes tiny wicks. This means that the opening price for the given time period is the same as the lowest price recorded, while the closing price matches the highest price attained during that period. As it has a long body, it signifies the strength of a potential rise.
Is a White Marubozu bullish or bearish?
The White Marubozu is considered to be a bullish pattern, which conveys strong buying sentiment and the potential for further upward momentum. This is confirmed by the Marubozu appearance. The absence of a lower shadow implies that buyers were in control from the beginning of the trading session. Additionally, the lack of an upper shadow suggests that buyers maintained their dominance until the session's end, resulting in upward price movement.
What are White and Black Marubozu patterns?
A White Marubozu is recognised by its long body devoid of shadows at either end. This indicates that the opening price is equal to the lowest price, and the closing price matches the highest price observed during the relevant time period. Conversely, a Black Marubozu exhibits similar characteristics but is bearish in nature. Its long body lacks upper shadows, suggesting that sellers controlled the market from the outset and kept it in their grasp until the session's close. This pattern can imply potential downward movement, particularly in a downtrend scenario.
This article represents the opinion of the Companies operating under the FXOpen brand only. It is not to be construed as an offer, solicitation, or recommendation with respect to products and services provided by the Companies operating under the FXOpen brand, nor is it to be considered financial advice.
Stay ahead of the market!
Subscribe now to our mailing list and receive the latest market news and insights delivered directly to your inbox.


Latest articles

WTI: Falling Production and Deadlock in Negotiations
Fundamental Background
As a result of the military conflict between the United States and Iran, the combined volume of halted oil production in Iraq, Saudi Arabia, Kuwait, the UAE, Qatar and Bahrain reached 10.5 million barrels per day in

Market Analysis: Gold Slips As WTI Crude Oil Rally Gains Fresh Momentum
Gold price extended losses below $4,650 before the bulls appeared. WTI Crude oil prices are rising and could climb further higher toward $105.
Important Takeaways for Gold and WTI Crude Oil Prices Analysis Today
· Gold price failed to clear
Fed vs ECB vs BOJ — Key Considerations for H2 2026
At the start of 2026, markets expected Fed cuts, BOJ hikes, and an ECB pause.
But rising inflation, higher energy prices, resilient US growth, and shifting central bank rhetoric are forcing traders to rethink the entire macro outlook for H2