


Understanding Volume Oscillator and Its Role in Technical Analysis
FXOpen
Navigating the complex terrain of trading requires a grasp of various technical analysis tools. One such tool is the Volume Oscillator, a potent indicator that offers insight into market trends and their strength. This article provides a comprehensive look at this tool, its interpretation, principles, and limitations.
What Is the Volume Oscillator?
The Volume Oscillator is a vital tool in technical analysis, utilising two moving averages of trading volume to generate signals about the strength and weaknesses of trends. Unlike price oscillators which focus primarily on the direction and momentum of price movements, this tool delves into the undercurrents of the market.
Volume, in the context of financial markets, is the number of asset units traded during a given period. As such, it is a measure of market activity.
So what does a Volume Oscillator do? This indicator goes a step further by comparing short-term and long-term buying and selling activity flow to help traders identify potential reversals, breakouts, and other market events. However, it's important to note that this tool doesn't signify bullish or bearish behaviour but rather indicates whether a move has supporting volume.
Calculating the Volume Oscillator Technical Indicator
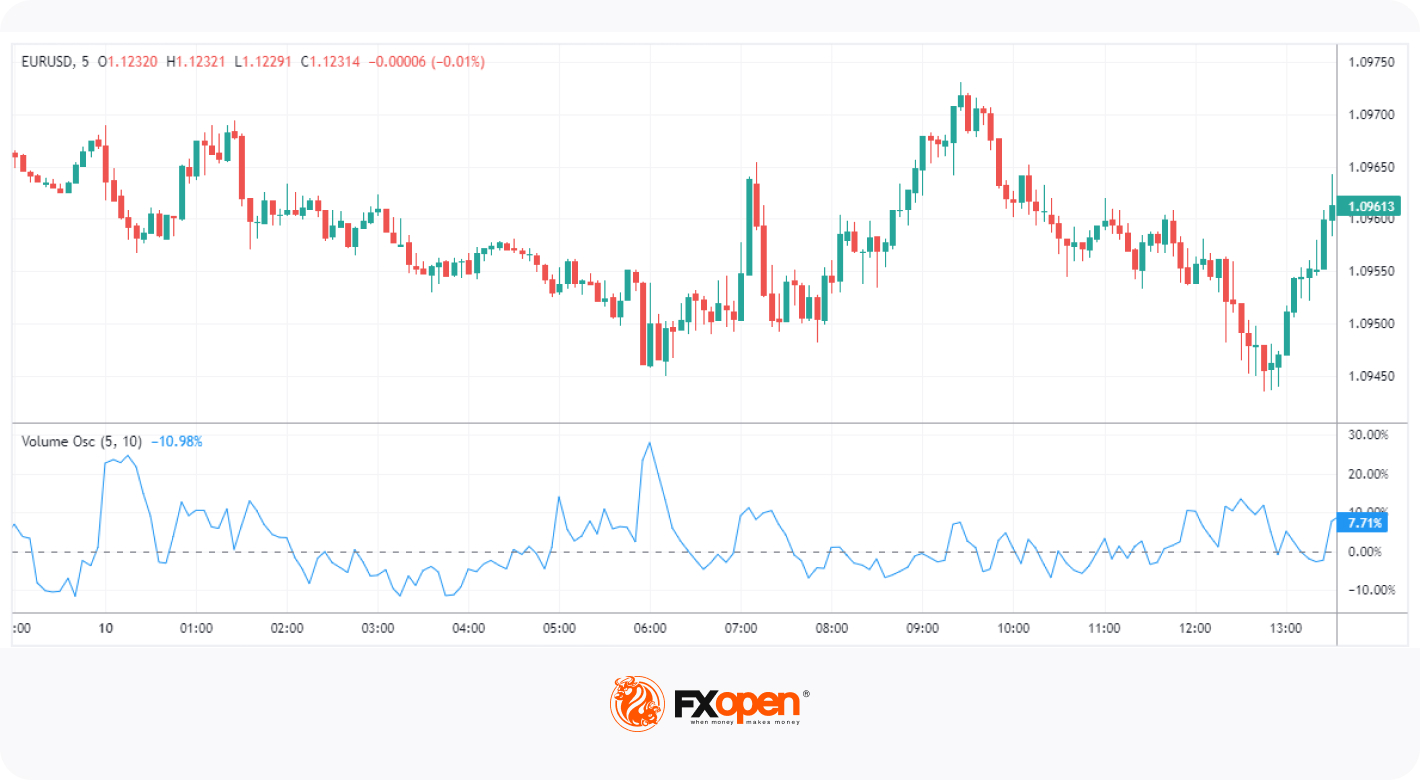
The calculation of the Volume Oscillator is straightforward. It begins with selecting two lengths of moving averages, often referred to as the short and long periods. The default Volume Oscillator settings used are 5 and 20, but these can be adjusted as per your trading needs.
The indicator is then calculated using the formula:
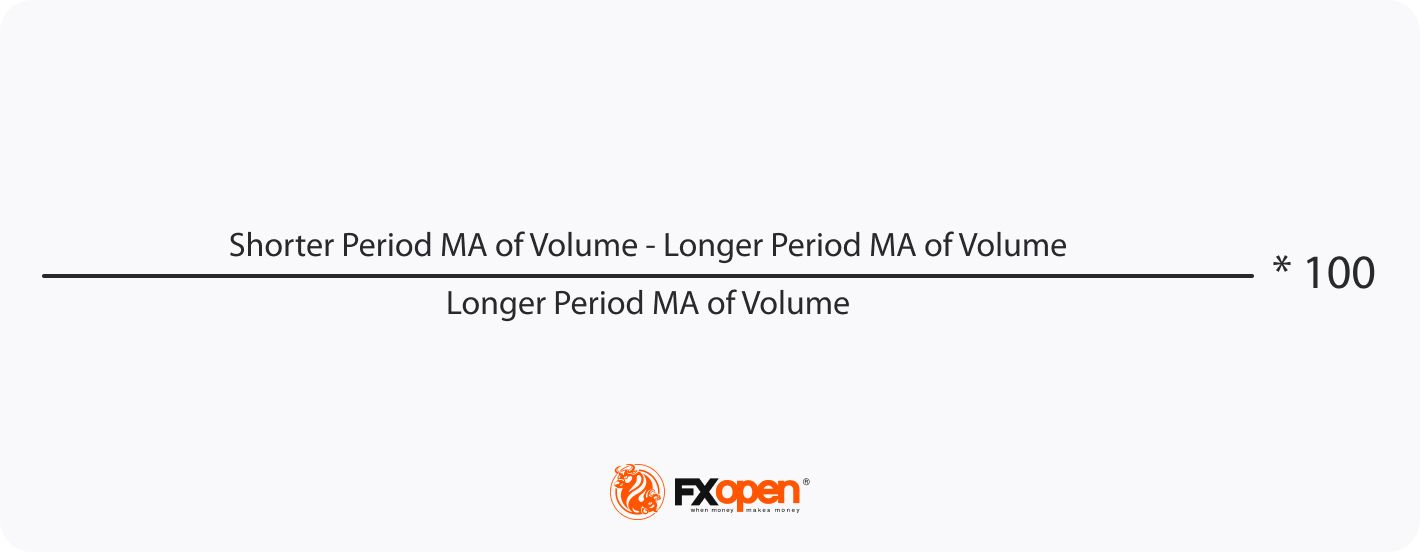
This calculation produces a percentage that oscillates above and below zero. If you’d like to practise your Volume Oscillator skills, you can use FXOpen’s free TickTrader platform to get started within minutes.
Principles of Volume Analysis
The principles of volume analysis are integral to understanding and interpreting this indicator. These principles encompass two primary signals: signs of strength and signs of weakness in the prevailing trend.
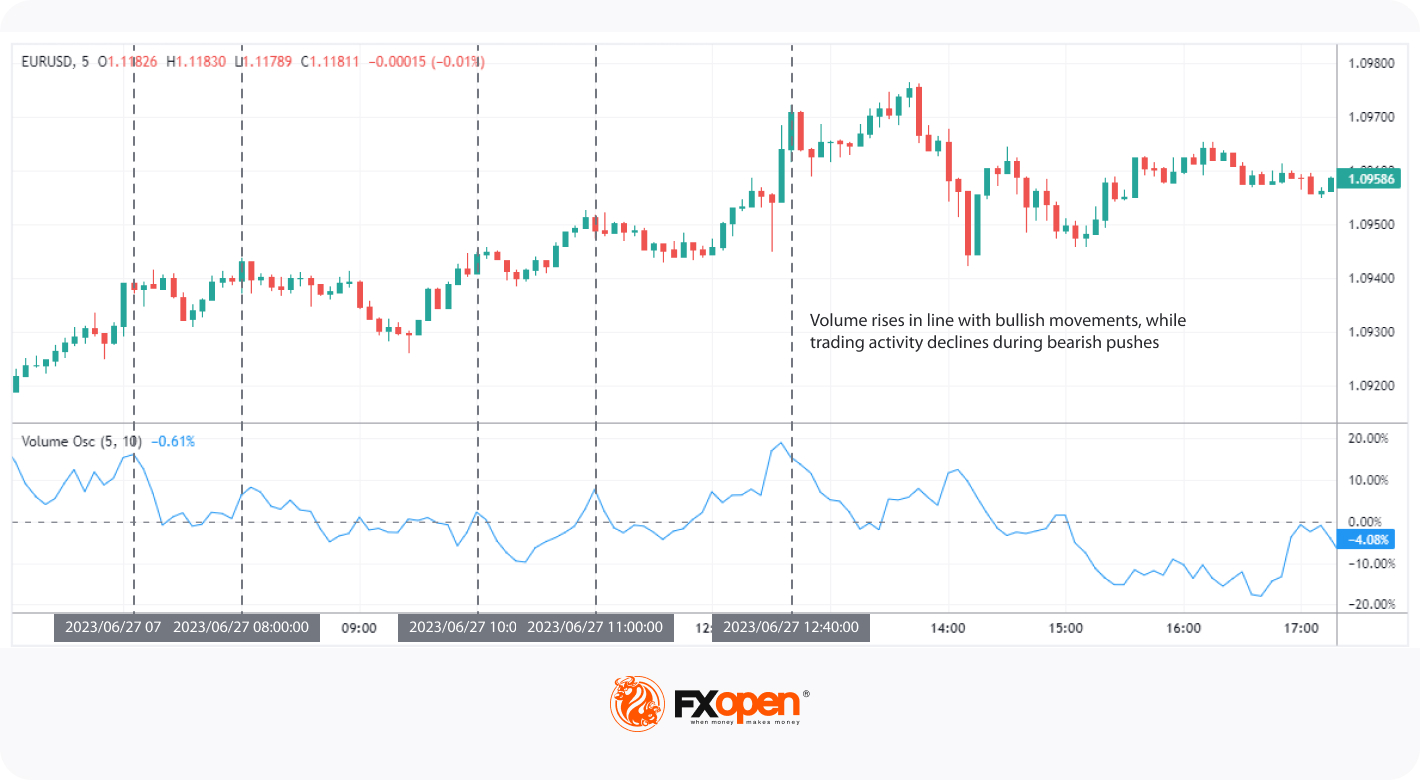
A sign of strength is identified when the price of an asset moves concurrently with a rise in buying or selling activity. This suggests that the prevailing price movement – whether upwards or downwards – has solid support from traders, leading to a stronger confirmation. Hence, when the fast volume moving average is above the slow volume moving average, the indicator is above the zero line, indicating a stronger market direction.
Conversely, a sign of weakness is indicated when the price movement is not supported by strong activity. This means that the price is increasing or decreasing while trading activity is declining. In such a case, the Volume Oscillator is below the zero line, implying a potential lack of conviction in the current price direction, thereby signalling a potential reversal or slowdown.
Volume Oscillator Interpretation
This tool’s interpretation is primarily based on its trend direction in relation to the zero line. When trending upward and above the zero line, it indicates growing conviction in the current price movement, whatever its direction. Conversely, a downward trend above the zero line suggests diminishing confidence in the ongoing price action.
Below the zero line, an upward trend in the oscillator points to a potential shift in momentum, indicating that the conviction in the current price direction might be returning, while a downward trend implies that the uncertainty in the market's direction is intensifying.
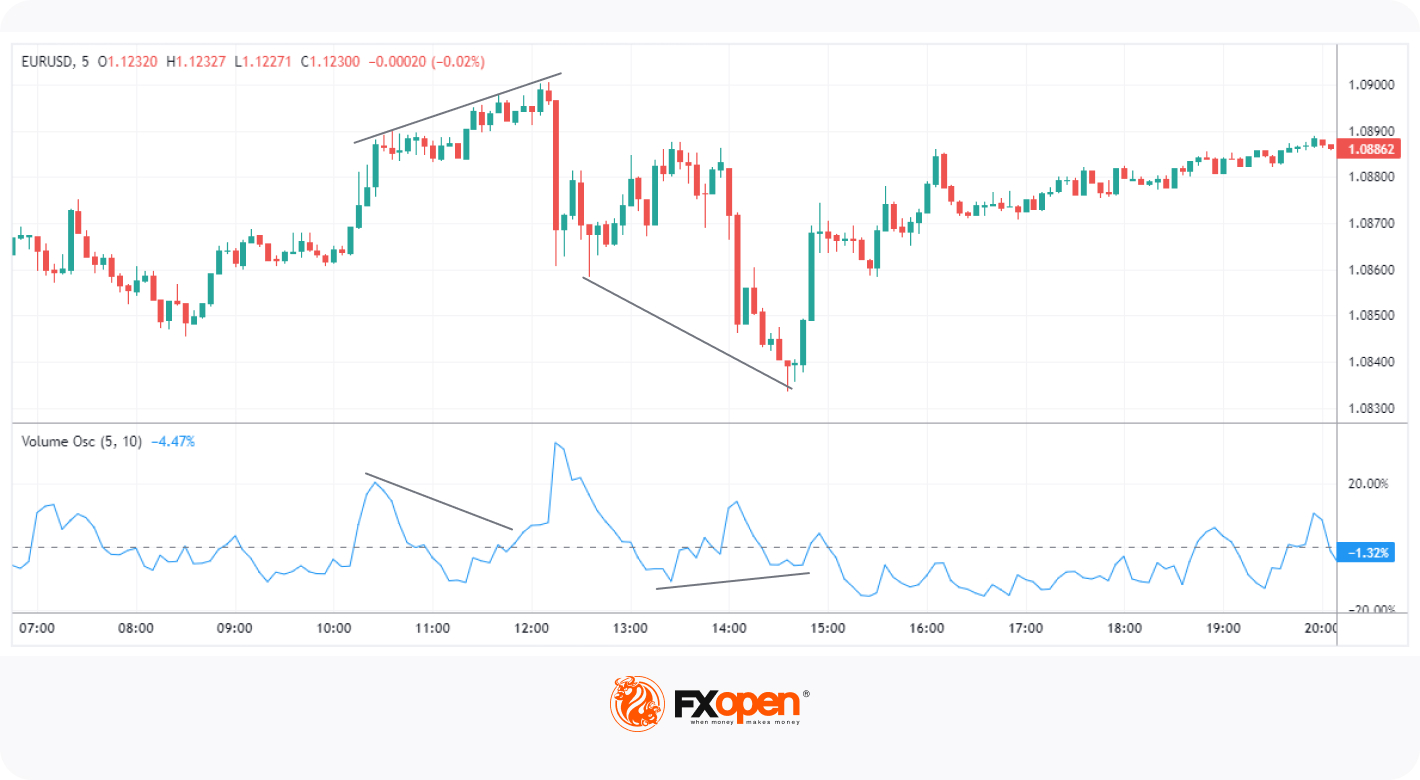
It can also provide divergence signals, which occur when its direction deviates from the price movement direction. For instance, if prices reach new highs while the indicator fails to achieve new highs, it may suggest a weakening upward price trend, potentially heralding a downturn. Conversely, if prices hit new lows and the tool does not follow suit, it could be a sign of an impending upward reversal.
Limitations
Despite its usefulness, this indicator is not infallible and has certain limitations. Primarily, it may produce false signals in periods of low trading activity or in thinly traded assets where the market participation data can be sporadic. Moreover, while it is excellent at confirming price movements, it may be less effective at predicting reversals, particularly in highly volatile markets.
The Bottom Line
By gauging the intensity behind trends, the Volume Oscillator adds a depth dimension to market analysis. While it has its limitations, its ability to identify the strength of price movements and potential reversals makes it a beneficial part of any trader's toolkit.
If you would like to put your Volume Oscillator knowledge into action, you can open an FXOpen account. Once you do, you will access lightning-fast execution speed and competitive trading costs. Happy trading!
This article represents the opinion of the Companies operating under the FXOpen brand only. It is not to be construed as an offer, solicitation, or recommendation with respect to products and services provided by the Companies operating under the FXOpen brand, nor is it to be considered financial advice.
Stay ahead of the market!
Subscribe now to our mailing list and receive the latest market news and insights delivered directly to your inbox.


Latest articles

Nasdaq 100: 48 Hours of Chaos, One Trendline Standing in the Way
Wall Street just lived through one of its wildest 48 hours of the year. On Wednesday, the Fed held rates steady at 3.50%-3.75%, but three FOMC members broke ranks to demand a hike—an unusually hawkish dissent

Amazon Analysis: Strong Earnings Coincide with a Breakout from the Correction
On 30 July, Amazon.com reported its financial results for the second quarter of 2026, significantly exceeding market expectations. Revenue rose 20% year-on-year to $200.6 billion, compared with the consensus forecast of around $196.5 billion. The main growth

GBP/USD and EUR/GBP Await Key Bank of England Decision
The pound strengthened following the outcome of the US Federal Reserve meeting, where the central bank, as expected, kept interest rates unchanged. However, the Fed did not provide the market with clear signals of an imminent shift towards rate cuts,