


USDCAD Breaks Key Trendline As Bears Gain Momentum
FXOpen
Technical Bias: Bearish
Key Takeaways:
- USDCAD breaks key trendline support
- 1.2300 remains major support area
- Bearish pin bar emerges on four-hour timeframe
The US Dollar (USD) extended downside movement against the Canadian Dollar (CAD) on Wednesday, dragging the price of USDCAD to less than even 12370 ahead of some key economic releases. The technical bias will remain bearish due to a Lower High in the recent wave on daily chart.
Technical Analysis
As of this writing, the pair is being traded near 1.2384. A support may be seen around 1.2350, the low of the last major dip ahead of 1.2300, the psychological number and then 1.2283, the 23.6% fib level as demonstrated in the following four-hour chart.
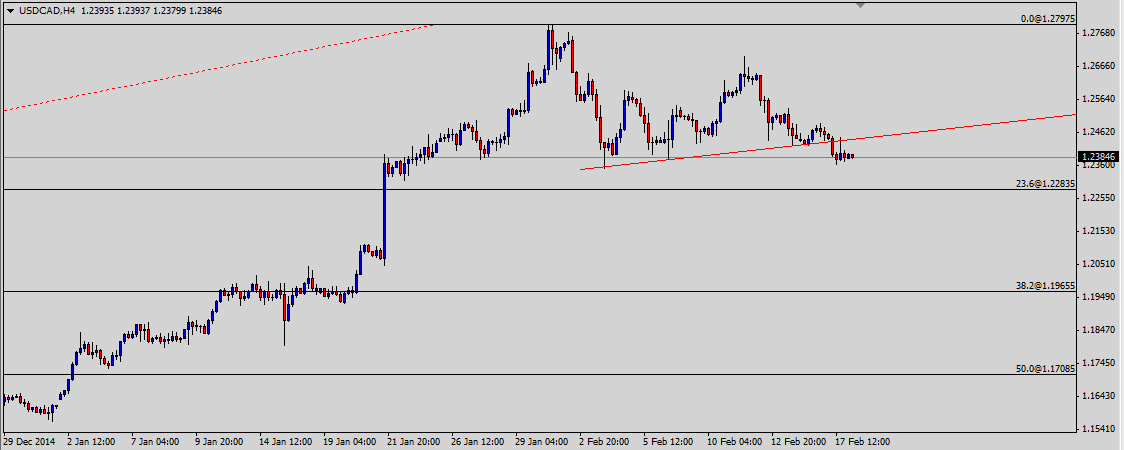
On the upside, the pair is expected to face a hurdle near 1.2443, the trendline support turned resistance ahead of 1.2477, the intraday high of yesterday and then 1.2500, the psychological number. The technical bias will remain bearish as long as the 1.2696 resistance area is intact.
Industrial Production
The US Industrial Production news is scheduled for release on Wednesday. According to the average forecast of different economists the industrial production in the US remained 0.3% in January as compared to -0.1% in the month before. Generally speaking, higher industrial production is considered positive for the economy thus a better than expected actual outcome will be seen as bullish for USDCAD and vice versa.
Trade Idea
Considering the overall technical and fundamental outlook, selling the pair on rallies appears to be a good strategy in short to medium term. The trade should however be stopped out on a daily closing above the 1.2446 resistance area.
Trade over 50 forex markets 24 hours a day with FXOpen. Take advantage of low commissions, deep liquidity, and spreads from 0.0 pips (additional fees may apply). Open your FXOpen account now or learn more about trading forex with FXOpen.
This article represents the opinion of the Companies operating under the FXOpen brand only. It is not to be construed as an offer, solicitation, or recommendation with respect to products and services provided by the Companies operating under the FXOpen brand, nor is it to be considered financial advice.
Stay ahead of the market!
Subscribe now to our mailing list and receive the latest market news and insights delivered directly to your inbox.


Latest articles

EUR/USD Eyes Gains As USD/CHF Weakness Deepens Again
EUR/USD started a fresh increase above 1.1700 and 1.1720. USD/CHF declined further and is now struggling below 0.7835.
Important Takeaways for EUR/USD and USD/CHF Analysis Today
· The Euro started a decent increase from

Apple: Earnings Day Above the Activity Zone
On 30 April, after the market close, Apple Inc. will release its financial results for the second quarter of fiscal 2026. The consensus forecast, based on estimates from 31 analysts, points to revenue of around $109.7 billion, with expected

USD/JPY and USD/CHF Near Key Levels: The Dollar Supported by the Fed
The US dollar continues to trend upwards following the Federal Reserve meeting, drawing support from the regulator’s moderately hawkish stance and comments by Jerome Powell. Markets interpret the Fed’s rhetoric as a signal that restrictive policy is likely