


USDJPY Confirms Bullish Reversal Amid US Jobless Claims News
FXOpen
The US Dollar (USD) extended upside movement against the Japanese Yen (JPY) on Friday, increasing the price of USDJPY to more than 117.90 following the release of downbeat initial jobless claims news from the United States. The technical bias however remains slightly bearish because of a Lower Low in the recent downside wave on the daily chart.
Technical Analysis
As of this writing, the pair is being traded around 117.97. A hurdle may be noted near 118.80, the swing high of the large bearish pin bar which emerged on the daily chart on January 8th, 2016 ahead of 119.00, the psychological number and then 119.85, the 50% fib level as demonstrated in our daily chart.
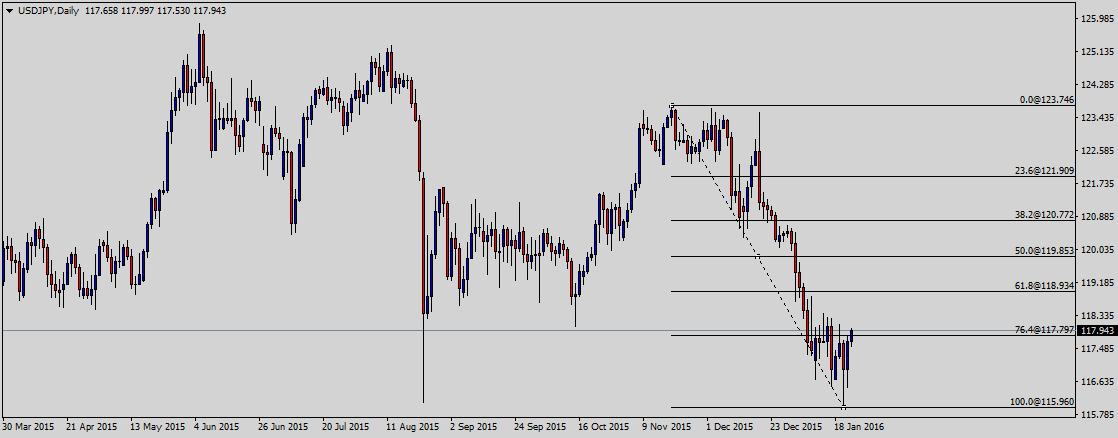
On the downside, the pair is expected to find a support around 117.79, the 76.4% fib level ahead of 117.00, the psychological number and then 115.96, the swing low of the last major downside move. A break and daily closing below the 115.96 support area could incite renewed selling pressure towards the 112.00 zone.
US Initial Jobless Claims
The number of Americans filing for unemployment benefits rose to a six-month high last week, suggesting some loss of momentum in the labor market amid a sharp economic slowdown and major stock market selloff.
Initial claims for state unemployment benefits increased 10,000 to a seasonally adjusted 293,000 for the week ended Jan. 16, the highest reading since early July, the Labor Department said. It was the second straight week of gains and confounded economists’ expectations for a drop to 278,000.
Trade Idea
Considering the overall technical and fundamental outlook, buying the pair around current levels appears to be a good strategy in short to medium term unless we get a valid bearish reversal candle near key resistance zone.
Trade over 50 forex markets 24 hours a day with FXOpen. Take advantage of low commissions, deep liquidity, and spreads from 0.0 pips (additional fees may apply). Open your FXOpen account now or learn more about trading forex with FXOpen.
This article represents the opinion of the Companies operating under the FXOpen brand only. It is not to be construed as an offer, solicitation, or recommendation with respect to products and services provided by the Companies operating under the FXOpen brand, nor is it to be considered financial advice.
Stay ahead of the market!
Subscribe now to our mailing list and receive the latest market news and insights delivered directly to your inbox.


Latest articles

Apple: Earnings Day Above the Activity Zone
On 30 April, after the market close, Apple Inc. will release its financial results for the second quarter of fiscal 2026. The consensus forecast, based on estimates from 31 analysts, points to revenue of around $109.7 billion, with expected

USD/JPY and USD/CHF Near Key Levels: The Dollar Supported by the Fed
The US dollar continues to trend upwards following the Federal Reserve meeting, drawing support from the regulator’s moderately hawkish stance and comments by Jerome Powell. Markets interpret the Fed’s rhetoric as a signal that restrictive policy is likely

EUR/USD and GBP/USD consolidate ahead of the Fed decision
European currencies are showing subdued dynamics, entering a consolidation phase following their previous advance. Earlier, EUR/USD and GBP/USD broke out of their ranges and strengthened; however, the subsequent correction has led both pairs to retest the previously breached