


FXOpen
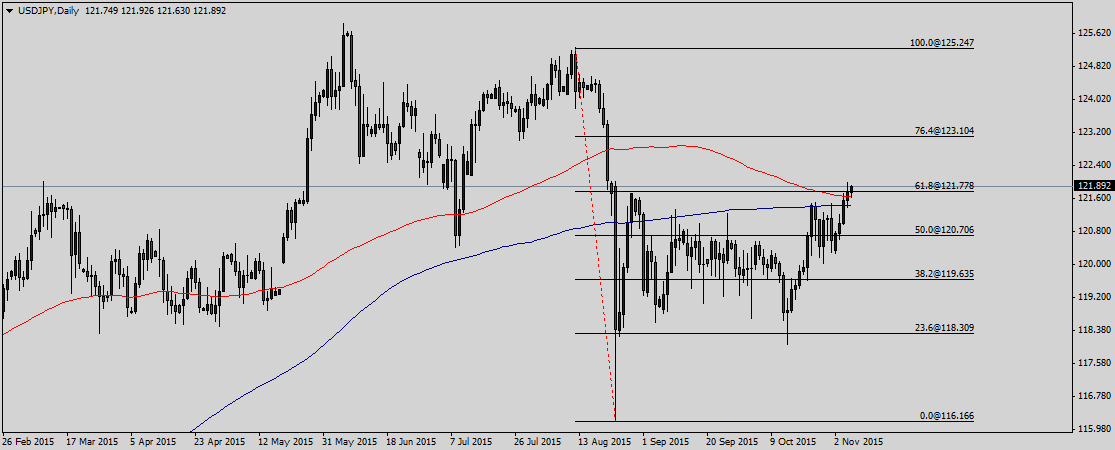
The US Dollar (USD) extended upside movement against the Japanese Yen (JPY) on Friday, increasing the price of USDJPY to more than 121.80 amid the release of some key economic releases. The pair has already broken the key range which may result in renewed bullish momentum in the short to medium term.
Technical Analysis
Yesterday the pair had corrected down to 121.51 intraday, meeting some buying interest around its 200 DMA, and ends the day also above the 100 DMA, a few pips above the largest. In the short term, the 1 hour chart shows that the technical indicators have turned lower, but hold above their mid-lines, whilst the price stands well above its 100 and 200 SMAs, in the 120.80/121.10 region.
In the 4 hours chart, the technical indicators have retreated from overbought levels before resuming their advances, whilst the moving averages are slowly advancing well below the current level, all of which supports additional gains ahead, at least, from a technical point of view.
US Initial Jobless Claims
Initial jobless claims climbed to 276,000 last week.
Economists had forecast, according to Bloomberg, that the Department of Labor’s data showed first-time claims for unemployment insurance totaled 262,000 last week, up 2,000 from the prior period. The total number of claims has not topped 300,000 since March. The four-week moving average, which evens out some of the weekly volatility, rose to 262,750.
Last week, the four-week moving average fell to 259,250, and marked yet another low since 1973. The Labor Department said no special factors impacted the data. The jobs report for October is set for release today.
Trade Idea
Considering the overall technical and fundamental outlook, buying the pair can be a good strategy if we get a daily closing above the long held range.
Trade over 50 forex markets 24 hours a day with FXOpen. Take advantage of low commissions, deep liquidity, and spreads from 0.0 pips. Open your FXOpen account now or learn more about trading forex with FXOpen.
This article represents the opinion of the Companies operating under the FXOpen brand only. It is not to be construed as an offer, solicitation, or recommendation with respect to products and services provided by the Companies operating under the FXOpen brand, nor is it to be considered financial advice.
Stay ahead of the market!
Subscribe now to our mailing list and receive the latest market news and insights delivered directly to your inbox.

Latest from Forex Analysis
Latest articles

Weekly Market Wrap With Gary Thomson: Nasdaq, EUR/USD, USD/CHF, Brent Crude Oil, Googl Shares
Get the latest scoop on the week's hottest headlines, all in one convenient video. Join Gary Thomson, the COO of FXOpen UK, as he breaks down the most significant news reports and shares his expert insights.
- Nasdaq Composite: Worst Session

Analysis of AUD/USD: Exchange Rate Falls to Early May Low
As indicated by the 4-hour AUD/USD chart today:
→ the rate fell below 0.652, a level last seen on May 2;
→ the RSI indicator dropped below 15, a level last seen during the panic over the spread of COVID-19

Analysis of AMZN Stock: Price at 1.5-Month Low
As shown in the AMZN chart, the stock price dropped below:
→ the psychological level of $180;
→ the mid-June interim low.
The last time AMZN traded below $180 was in early June.
Thus, AMZN has faced sell-offs, similar to other tech