FXOpen
The US Dollar (USD) again fell broadly against the Japanese Yen (JPY) on Thursday and closed in the negative territory, showing signs of weakness in the price action. The USD/JPY is expected to test the long term channel support in near future before resuming the upside rallies.
Technical Analysis
As of this writing, the pair is being traded near 102.33. A hurdle may be seen around 102.90, the 100 Simple Moving Average (SMA) ahead of 103.32 that is the 23.6% fib level and then the channel resistance which is currently sitting in near 103.71. A break and daily closing above the channel resistance will push the pair into stronger bullish momentum, opening doors for an upside rally above the 105.00 handle.
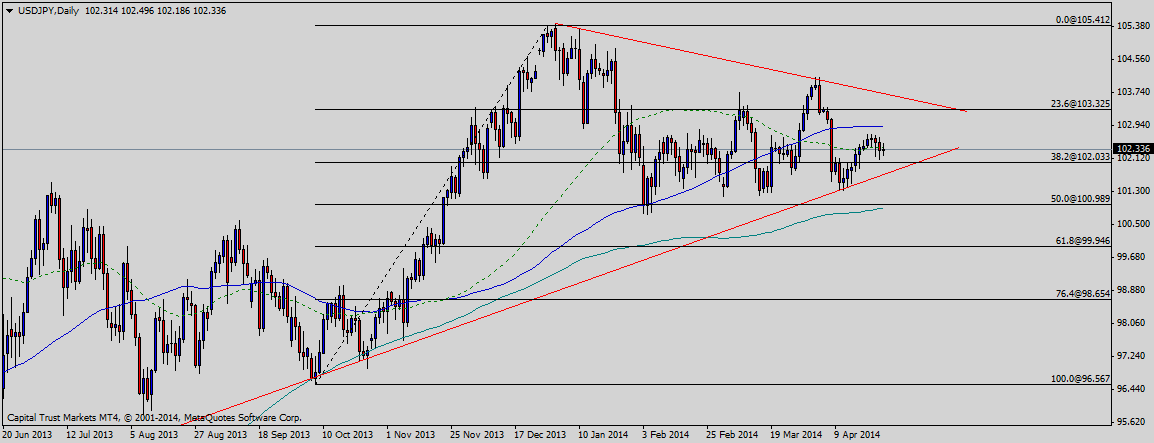
On the downside, the pair is likely to find support near 102.00, the 38% fib level and psychological level and then the channel support which is sitting in around 101.71. A daily closing below the trendline support will validate a deeper correction towards the 100.00 support area.
Japan Retail Sales
On Sunday (April 27), Japan’s Ministry of Economy, Trade and Industry will release the annual retail sales balance. According to the median projection of different economists, the retail sales jumped by 5.5% in March as compared to 3.6% in the same month of the year before, better than expected actual outcome will be seen as bearish for USD/JPY and vice versa.
Trade Idea
The market sentiment for USD/JPY is still very bullish due to Higher Low (HL) in the previous move, so buying on dips (around the channel support) will be a good strategy, the stop should be placed just below the trendline support while the target can be around the channel resistance.
Trade over 50 forex markets 24 hours a day with FXOpen. Take advantage of low commissions, deep liquidity, and spreads from 0.0 pips (additional fees may apply). Open your FXOpen account now or learn more about trading forex with FXOpen.
This article represents the opinion of the Companies operating under the FXOpen brand only. It is not to be construed as an offer, solicitation, or recommendation with respect to products and services provided by the Companies operating under the FXOpen brand, nor is it to be considered financial advice.
Stay ahead of the market!
Subscribe now to our mailing list and receive the latest market news and insights delivered directly to your inbox.


Latest articles

XTI/USD Chart Analysis: WTI Oil Price Fluctuates Near $100
For the third Monday in a row, trading in the oil market has opened with a bullish gap, although this time it is not as wide as the gap seen, for example, on 9 March. The reason for the volatility

Gold Price Falls to a Monthly Low
As the XAU/USD chart shows, gold prices today dropped below the 3 March low, reaching levels last seen in the third week of February.
Why Is Gold Declining Despite the War?
Geopolitical turmoil typically supports demand for gold as