


USD/JPY Rallies To 6-Year High As Fed Tapering Continues
FXOpen
The US Dollar (USD) continued its record break spree against the Japanese Yen (JPY) on Thursday, increasing the price of USD/JPY to more than 108.50 following the Fed monetary policy announcement. The bias remains extremely bullish due to Higher High in the ongoing upside rally.
Technical Analysis
As of this writing, the pair is being traded around 108.59. A huge hurdle can be seen near 110.65, the high of 2008 ahead of 112.66, the 76.4% fib level as demonstrated in the following chart. The long term bias will however remain bullish as far as the 100.82 support area is intact.
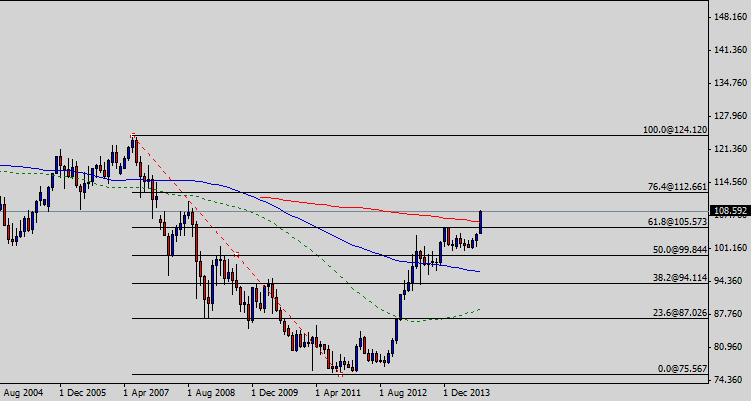
On the downside, the pair is likely to find a support near 106.80, the low of September 16 ahead of 105.57, the 61.8% fib level and then 105.00, the psychological level. The pair which is being traded at the six-year high would threaten the 2007-high if 110.65 is broken.
US Jobless Claims
The number of people who applied for the jobless incentives during the week ended on September 12 remained 305K as compared to 315K in the month before, the median projection of different economists say. The US labor department will release the actual jobless claims figure today in the New York Session. Generally speaking, higher jobless claims are considered negative for the economy, thus a worse than expected actual outcome will be seen as bearish for USD/JPY and vice versa.
Conclusion
Keeping in view the overall technical and fundamental outlook, selling the pair around the current levels appears to be a good strategy if the price leaves a bearish pin, shooting star or bearish engulfing candle on the daily chart. Not to mention, Yellen’s speech which is due today could also add to the ongoing bullish momentum spurred by yesterday’s monetary policy announcement by the Federal Reserve.
Trade over 50 forex markets 24 hours a day with FXOpen. Take advantage of low commissions, deep liquidity, and spreads from 0.0 pips (additional fees may apply). Open your FXOpen account now or learn more about trading forex with FXOpen.
This article represents the opinion of the Companies operating under the FXOpen brand only. It is not to be construed as an offer, solicitation, or recommendation with respect to products and services provided by the Companies operating under the FXOpen brand, nor is it to be considered financial advice.
Stay ahead of the market!
Subscribe now to our mailing list and receive the latest market news and insights delivered directly to your inbox.


Latest articles

DAX 40: consolidation amid technology sell-off
A wave of selling in the technology sector that emerged earlier this week has weighed on European equities. The trigger was investor concern over the profitability of large-scale debt-funded investments by major US tech companies in AI infrastructure. The Nasdaq

Euro Hits Fresh Yearly Lows Amid Dovish ECB Signals
The euro remains under pressure following weak macroeconomic data from the euro area and fresh signals that the European Central Bank is prepared to maintain a more accommodative monetary policy stance. Data released yesterday pointed to a deterioration in business

Pound at Key Levels: Markets Assess Impact of Political Uncertainty in the UK
The British pound remains under pressure following increased political uncertainty in the United Kingdom triggered by the Prime Minister’s resignation. Investors are assessing potential shifts in the political and economic policy outlook after the head of government stepped down,