


USD/JPY Set For Pullback As Potential Double Top Pattern Looms
FXOpen
The US Dollar (USD) extended upside movement against the Japanese Yen (JPY) on Wednesday, hitting the highest level of 2014 as bulls look firmly in control. The sentiment has already turned to bullish due to Higher Low and Higher High in the recent wave. The emergence of double top pattern on weekly chart looks likely which could give rise to the next correction wave.
Technical Analysis
As of this writing, the pair is being traded around 104.98. A hurdle may be seen near 105.31, the intraday high of today ahead of 105.44, the high of 2013 as demonstrated in the following weekly chart. A retracement around the current levels will leave a potential double top pattern on the daily chart which is considered a strong signal for selling pressure in the near future.
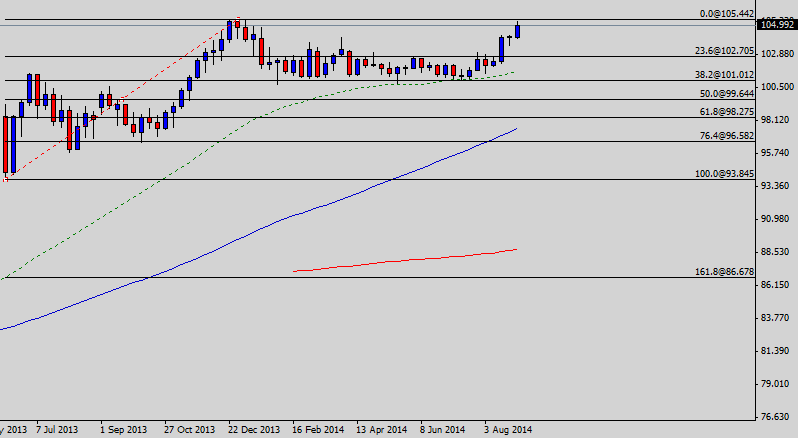
On the downside, the pair is expected to find a support around 104.00, the psychological number ahead of 102.70, the 23.6% fib level and then 102.38, the 200-Day Simple Moving Average (SMA). The sentiment will remain bullish in the long run as far as the 100.82 support area is intact.
US Trade Balance
The Census Bureau of the US will release the trade balance report on Thursday. According to the average forecast of different economists, the trade deficit remained $42.12 billion in July as compared to $41.54 billion in the month before. Generally speaking, higher trade deficit is considered negative for the US economy, thus a worse than expected actual reading could spur bearish momentum in the price of USD/JPY and vice versa.
Trade Ideas
Considering the overall technical and fundamental outlook, selling the USD/JPY around the current levels appears to be a good strategy in short to medium term. The trade should however be stopped out on a daily closing above the 105.50 resistance area as described above.
Trade over 50 forex markets 24 hours a day with FXOpen. Take advantage of low commissions, deep liquidity, and spreads from 0.0 pips (additional fees may apply). Open your FXOpen account now or learn more about trading forex with FXOpen.
This article represents the opinion of the Companies operating under the FXOpen brand only. It is not to be construed as an offer, solicitation, or recommendation with respect to products and services provided by the Companies operating under the FXOpen brand, nor is it to be considered financial advice.
Stay ahead of the market!
Subscribe now to our mailing list and receive the latest market news and insights delivered directly to your inbox.


Latest articles

Amazon Earnings: Does the Chart Already Know Something the Numbers Don't?
All eyes are on July 30, when Amazon reports Q2 2026 earnings, with Wall Street increasingly convinced the bar has been set too low. Consensus sees EPS near $1.82-$2.26 on roughly $197 billion in revenue, but the

WTI Analysis: Gap Breaks Short-Term Trend as Price Remains Trapped Between the POC and Profile Boundary
WTI crude oil plunged by more than 7% on 27 July 2026 after the US suspended a series of strikes against Iran over the weekend, raising hopes of a diplomatic solution and the reopening of shipping through the Strait of

US Dollar Index: A Defining Week for the King of the Markets
The dollar heads into a pivotal week trading near 101.80, just off a 15-month high, with the Fed's July 29 meeting standing as the clear focal point. Markets currently price roughly a 65% chance of a hold, though renewed