


What a Stochastic Indicator Is and How to Read Its Signals
FXOpen

A stochastic oscillator or stochastic indicator is a technical analysis tool that helps traders determine overbought and oversold market conditions and forecast future price directions. The stochastic is often compared with relative strength indicator (RSI) as both tools are oscillators that provide similar signals. Still, there are differences.
Understanding a stochastic oscillator doesn’t require advanced knowledge. The FXOpen guide will tell you about the unique features and main signals.
Stochastic Oscillator Explained
The stochastic oscillator was developed by the financial analyst Dr. George Lane in the late 1950s. As with most indicators, it was created for the security market; however, traders successfully use it for stock, cryptocurrency*, commodity, and forex trading.
The stochastic in technical analysis is a momentum indicator, which means that it doesn't reflect a trend like common trend tools, like moving averages. What does the stochastic measure then? It measures the strength of a price, allowing traders to predict price reversals.
Another classification that can be applied to the stochastic is oscillators. By its nature, it’s an oscillator, meaning it fluctuates between two bands and reflects periods when the asset is overbought or oversold.
Relative Strength Index and Stochastic Oscillator: Differences
The relative strength index (RSI) and the stochastic oscillator are very similar. They are momentum indicators that move within a 0-100 range. However, they differ in how they evaluate a price's strength. The RSI compares the strength of a price in periods when it rises to periods when it falls. The stochastic oscillator compares the current close price to the highest and lowest values over a particular period. Therefore, RSI is believed to be more effective in a trending market, while the stochastic is commonly used in a range-bound market.
Still, both indicators provide similar signals: they reflect overbought and oversold market conditions and allow traders to determine a price reversal with the divergence signal. The only difference is the crossover signal. The stochastic consists of two lines that cross each other and provide buy and sell signals, while the RSI has only one line.
Stochastic Oscillator Calculation
You don’t need to calculate the indicator manually as it’s automatically implemented and calculated on trading platforms – for instance, on the TickTrader platform. Still, it may be useful to know how the indicator is built so you understand which settings you can use for your strategy.
The stochastic consists of two lines – %K and %D, which move within the 0-100 range. The indicator’s main parameter is a period. 14 is a standard setting, so we will use it to explain the oscillator.
%K is the primary line, calculated based on the most recent close over 14 periods (minutes, days, weeks, months, depending on the timeframe) and the highest and the lowest prices over 14 periods (minutes, days, weeks, etc.). This allows the indicator to compare the current position of the close price relative to the high and low, which form a price range over a particular period. %D is a so-called single line. It’s a 3-period simple moving average (SMA) of %K.
Thus, the stochastic formula is:
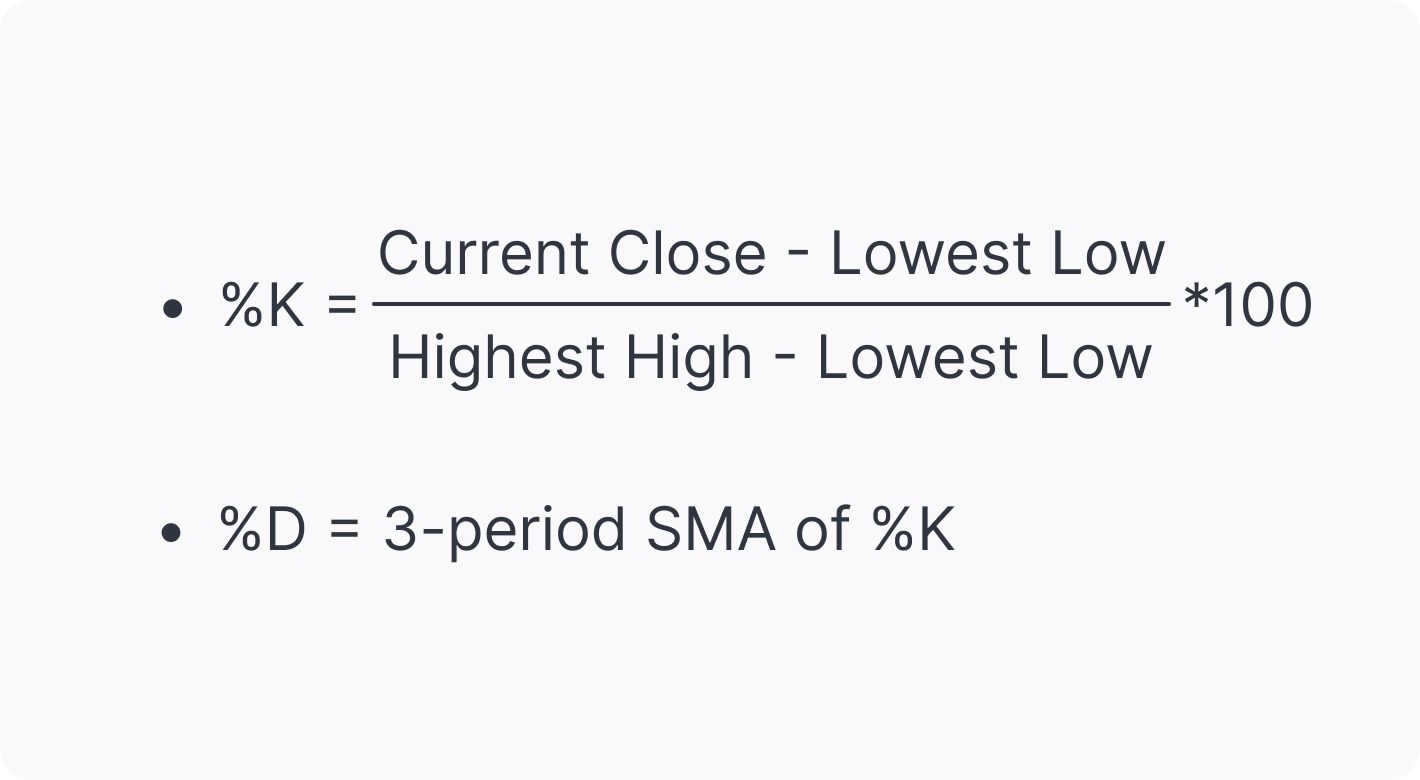
The indicator built on this formula is also known as the fast stochastic.
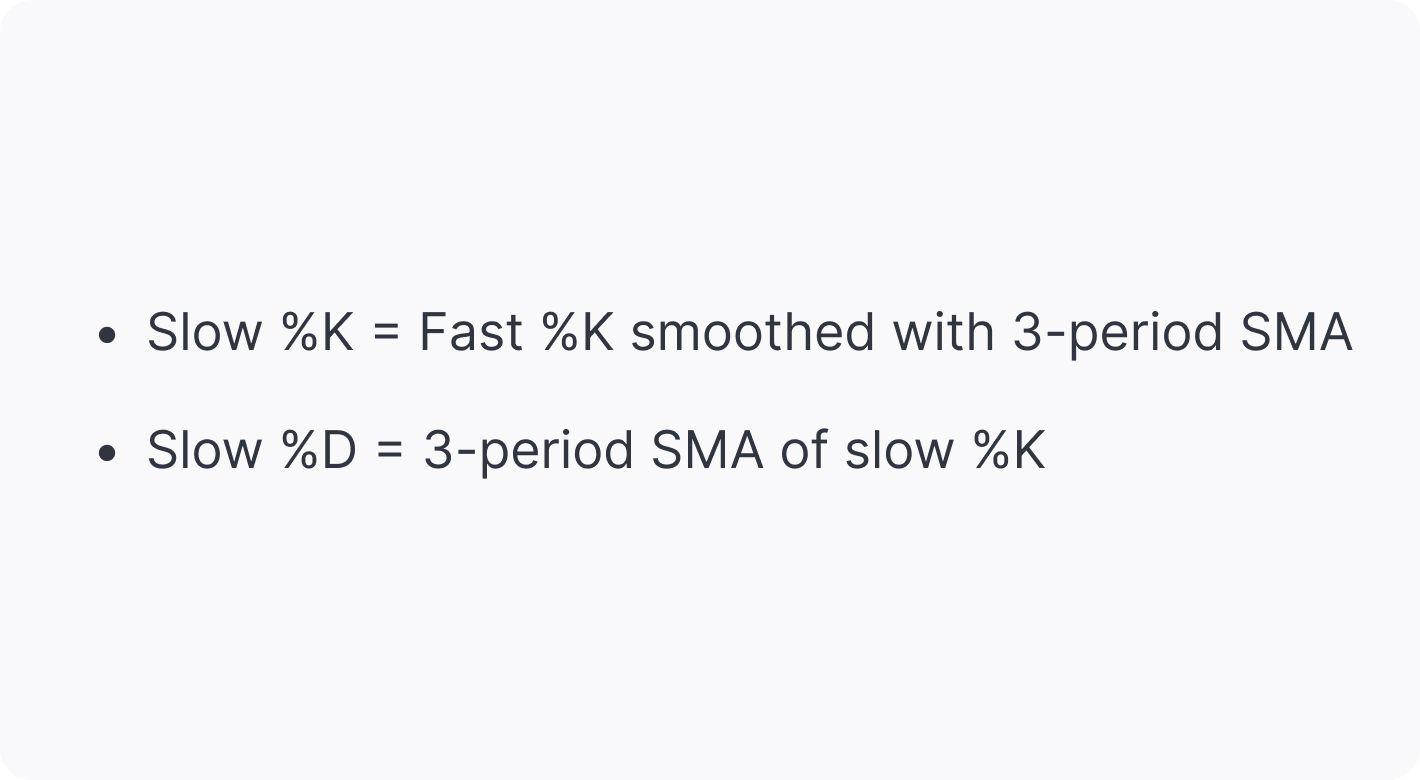
As the fast stochastic provides reliable but very frequent signals, another type of indicator was developed – the slow stochastic. It smoothes price movements and provides fewer signals but makes them more reliable.
The formula for the slow stochastic is:
There is also a full stochastic oscillator. In this version, a trader can change the slow %K and the %D moving average parameters to make it more effective for a particular strategy.
The formula for the full stochastic is:
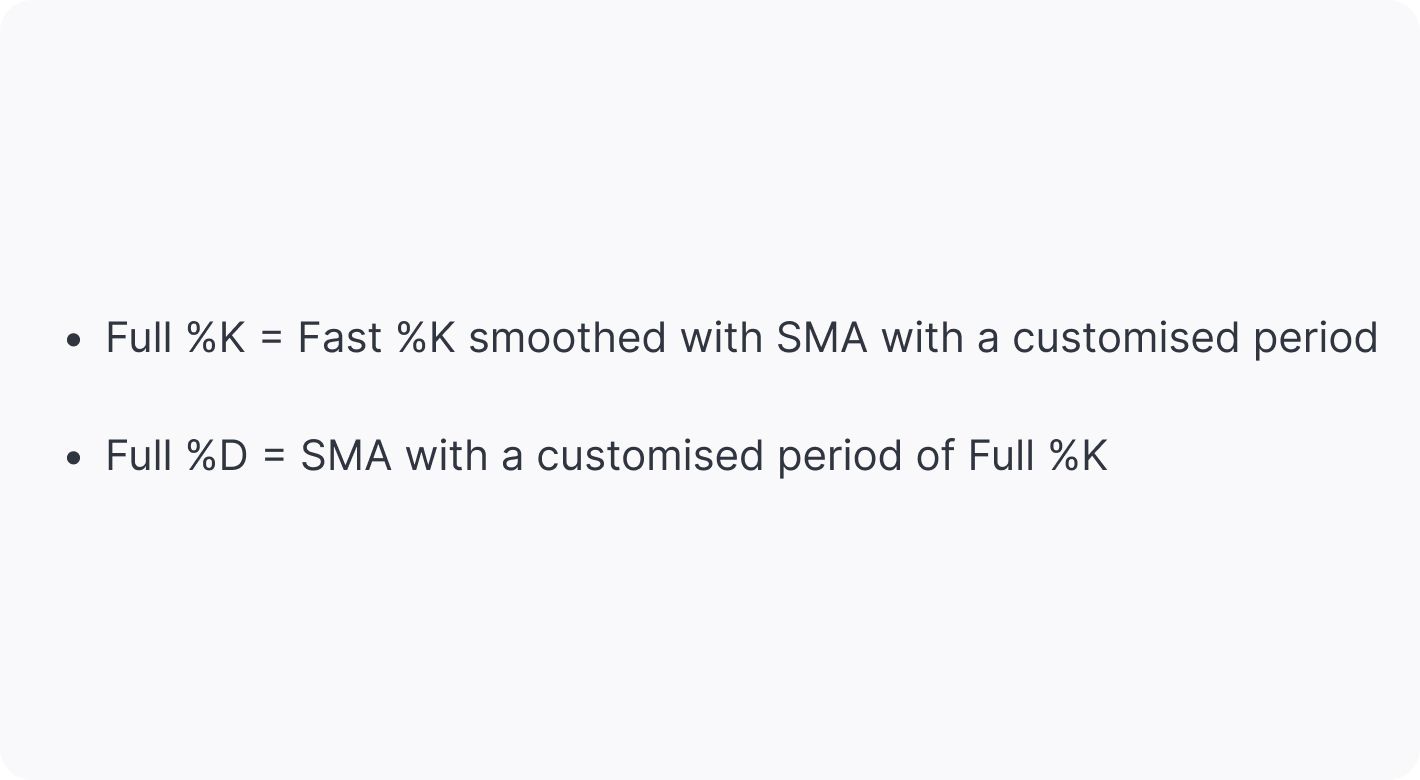
The most common parameters for this stochastic type are 14, 1, 3 and 14, 3, 3. You can implement the full stochastic oscillator on the TickTrader platform and test various settings to determine those that work best for your trading strategy. The creator of the stochastic, Dr. Lane, thought his indicator could be effective if combined with the Fibonacci retracement indicator or with the Elliott Wave theory, which you can also test on TickTrader.
Reading the Stochastic Oscillator
Once, Dr. George Lane said that the stochastic "doesn't follow price, it doesn't follow volume or anything like that. It follows the speed or the momentum of price. As a rule, the momentum changes direction before price." Therefore, the stochastic is widely used to identify future price direction. The indicator provides three primary signals: overbought/oversold conditions, divergences, and crossovers of %K and %D.
Oversold/Overbought Conditions
The stochastic oscillator is compared to the relative strength index because they provide similar signals except for crossovers. However, when it comes to overbought and oversold areas, there are differences.
When the asset is oversold, the stochastic is below 20, while the RSI is below 30. When the asset is overbought, the stochastic is above 80, while the RSI is above 70. It’s worth remembering these rules to read the signals correctly.
When the oscillators are in the overbought area, there is a signal the price may fall soon to return to its fair price. Conversely, when the oscillator is in the oversold zone, traders expect the price to rise shortly to reach its fair value.
How to Trade on the Oversold/Overbought Signal
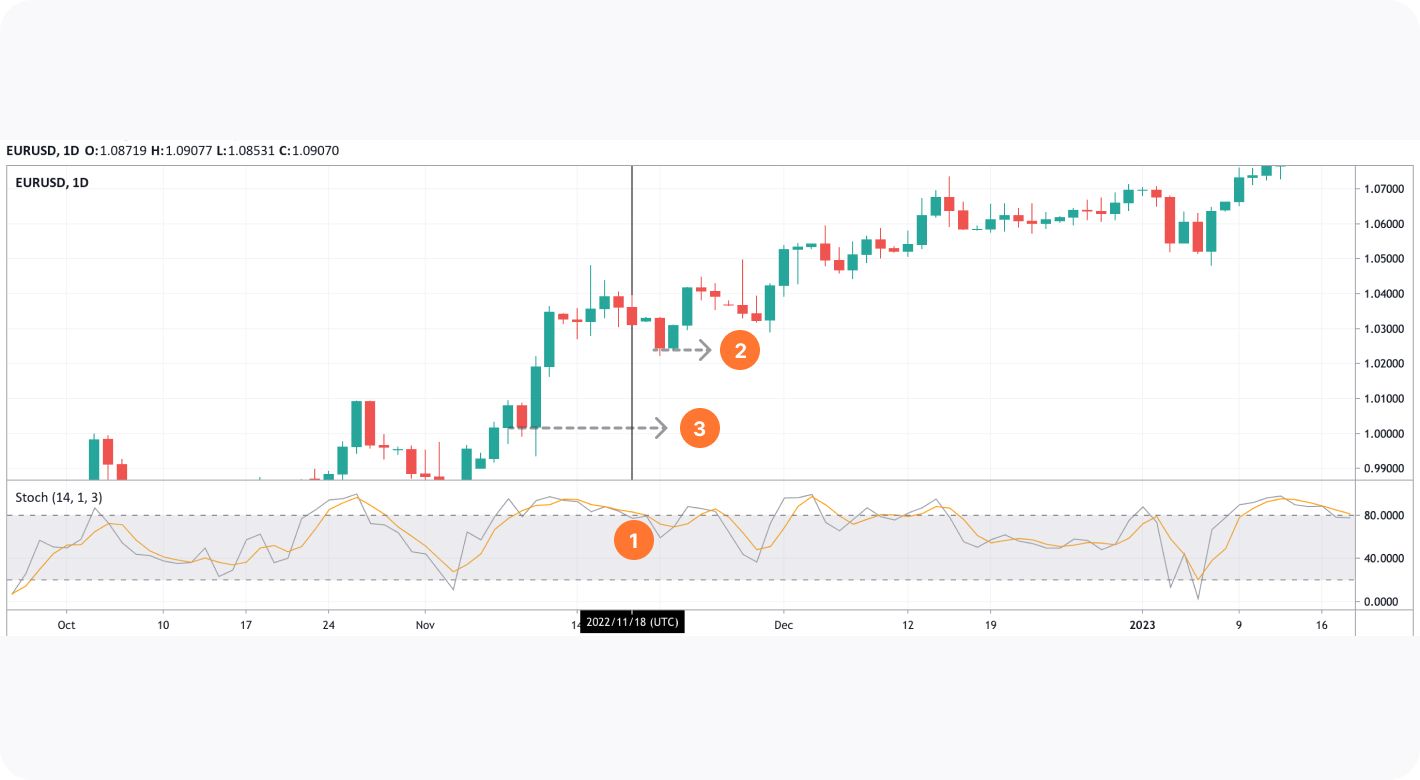
Traders never enter the market when the oscillator is in oversold or overbought areas because it can stay there for a while. A sell signal appears when the indicator falls below 80, while a buy signal occurs when the stochastic rises above 20.
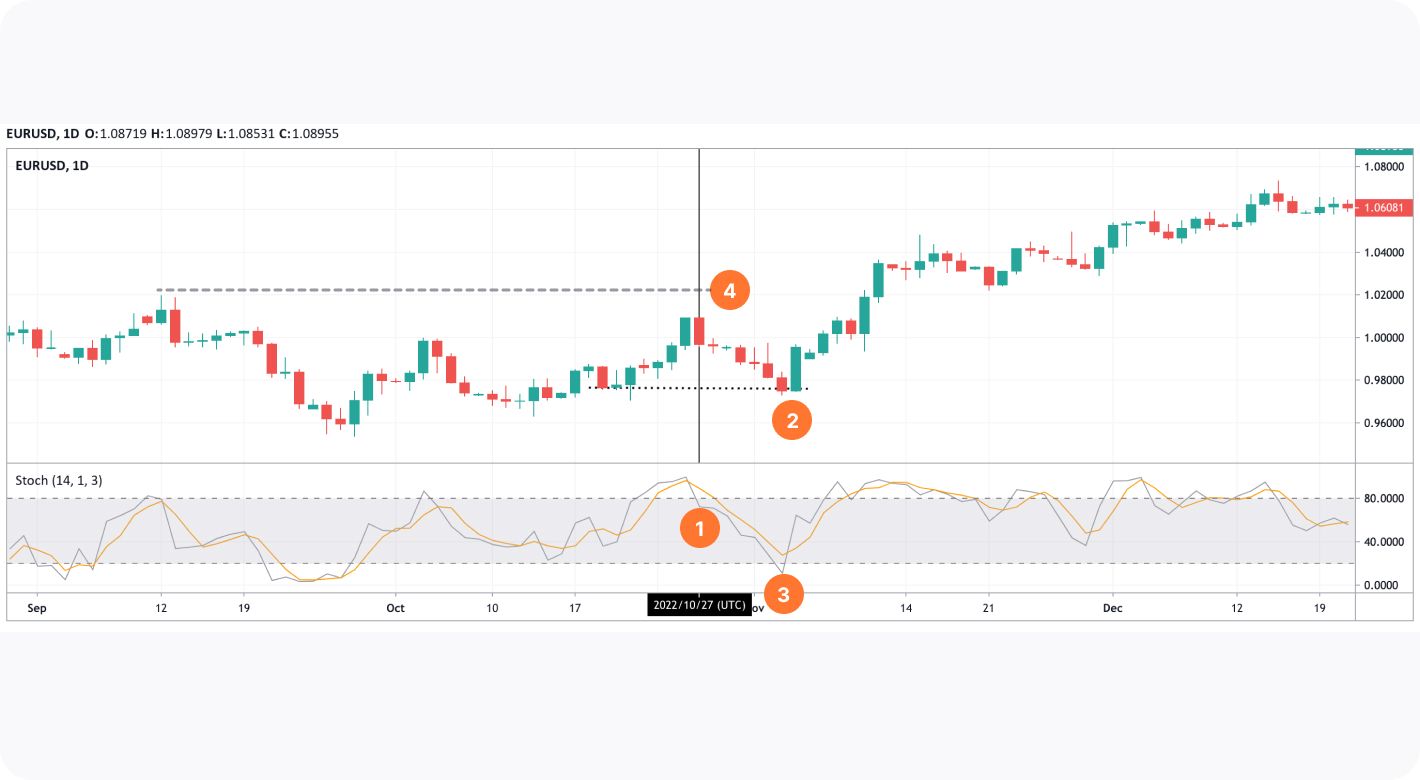
In the chart above, the price fell after the stochastic moved below 80 (1). A trader could close a trade by setting a take-profit order at the nearest support level (2). The closure was confirmed by the stochastic breaking below 20 (3). A stop-loss order could be calculated in accordance with the 1:2 or 1:3 risk/reward ratio. Another option was to place a stop-loss level slightly above the nearest swing high (4).
Note: the second option should be used cautiously. A trader should be sure the risk doesn’t exceed half of the potential profit.
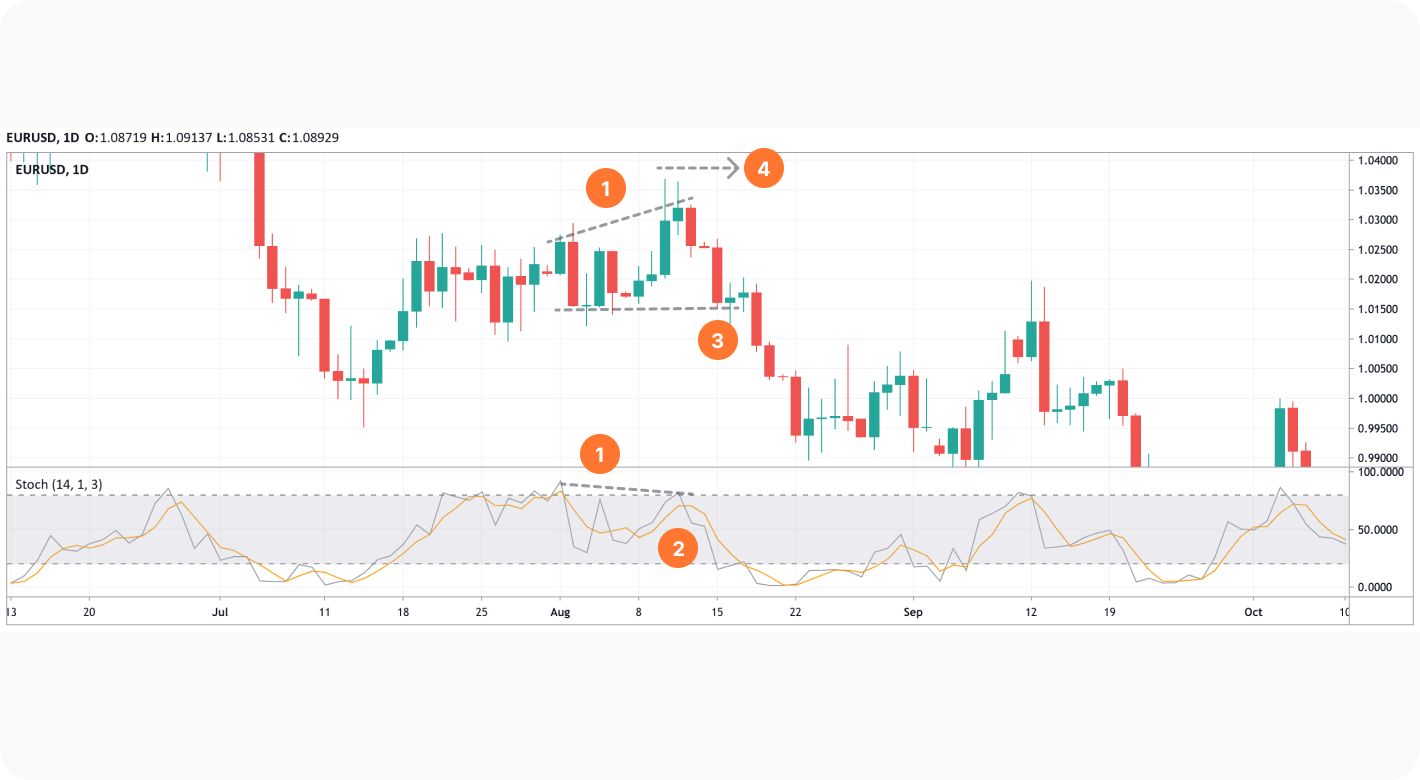
A stop-loss is a vital part of trading, as the stochastic may fail like any other technical analysis tool. The chart below shows similar market conditions. The stochastic broke below 80 (1), so a trader would expect a further price decline. The price was falling for two days (2), but the decline wasn’t significant. Moreover, it was challenging to identify a take-profit level as the closest support level was too far (3). Also, the stochastic didn’t reach the oversold area but soon returned to the overbought conditions.
Divergences
Divergence is one of the most prominent signals of many indicators, including the stochastic and the RSI. Divergences occur when a price moves in one direction, but it’s not confirmed by the oscillator. The divergence types are reflected in the graphic below.
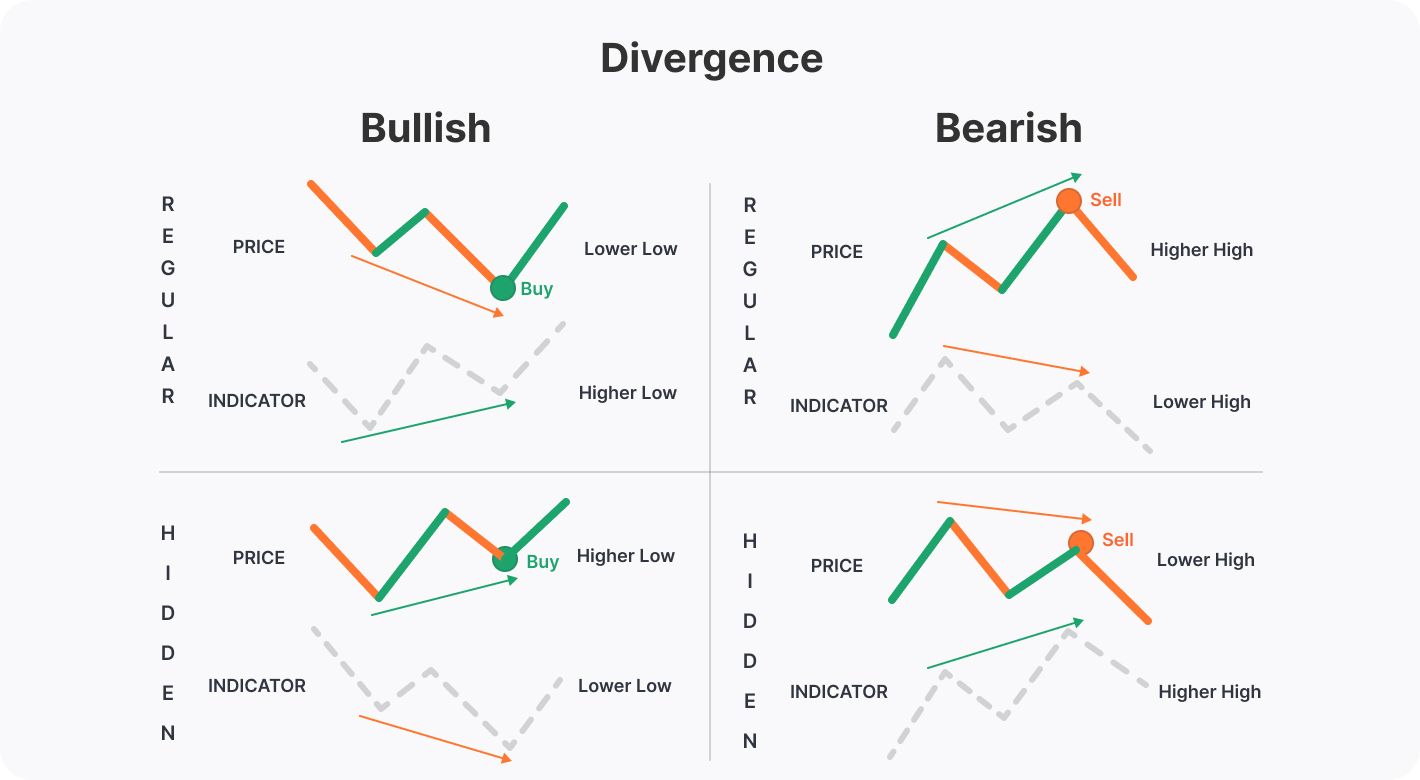
Regular divergences are stronger, while hidden divergences should be confirmed with more reliable signals and analysed by considering the overall market trend.
Regular divergences:
- Bullish. When the price forms a lower low, but the stochastic has higher lows, the market is expected to turn up.
- Bearish. When the price forms higher highs but the stochastic has lower highs, the market is expected to turn down.
Hidden divergences:
- Bullish. When the price forms higher lows, but the stochastic has lower lows, the market is expected to turn up.
- Bearish. When the price forms lower highs but the stochastic has higher highs, the market is expected to turn down.
How to Trade on the Divergence Signal
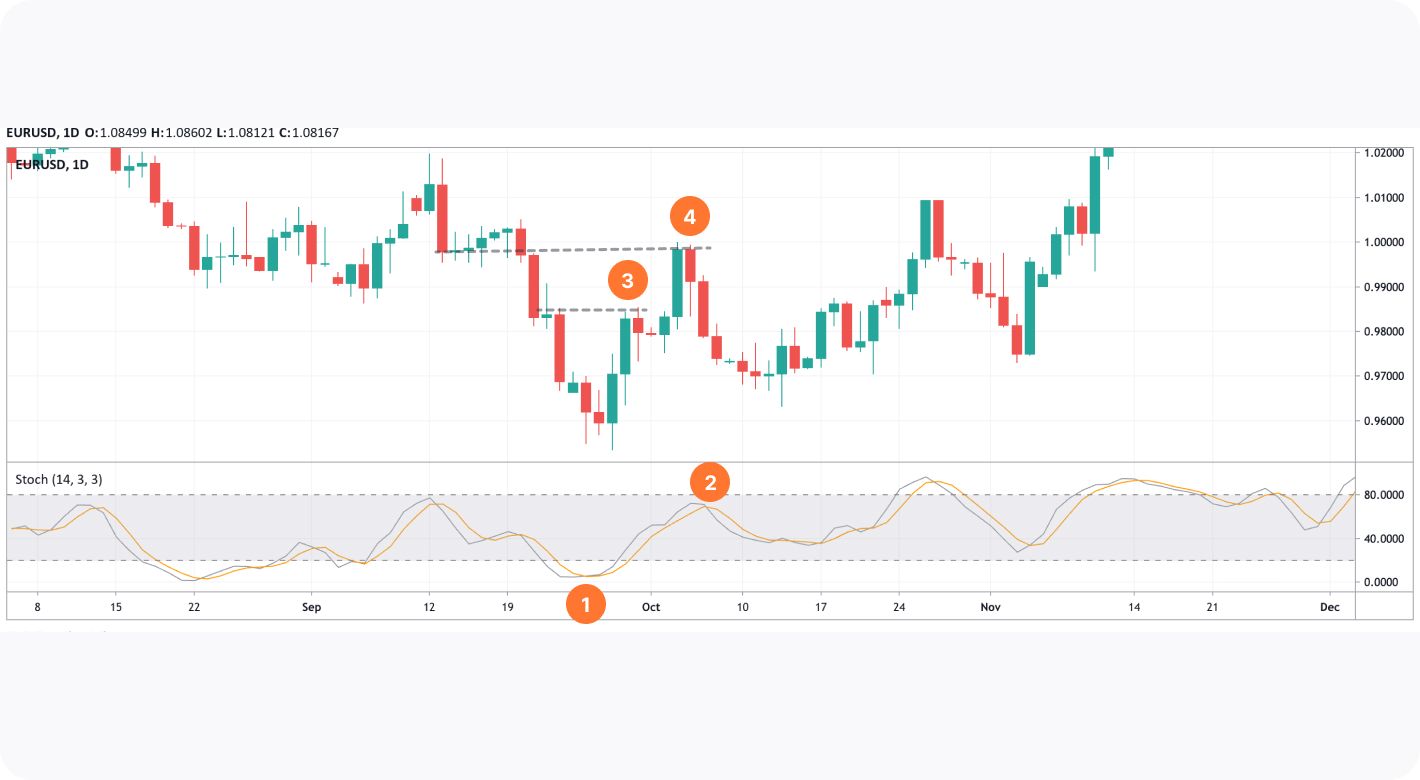
The price and the stochastic oscillator indicator formed a regular bearish divergence (1). A trader could enter the market once the %K (grey line) fell below the %D (orange line) (2). The crossover signal will be discussed in the next section. The take-profit target could be placed on the nearest support level (3). However, a trader could use the trailing take-profit order to move the profit target if they were sure the downtrend would continue.
Note: the stochastic oscillator reflects a potential price reversal but not a trend reversal. This means that the price may turn around for a short period. Therefore, it’s vital to consider the current market conditions and place the take-profit level considering potential risks.
As the price formed two candles with long upper shadows before a reversal, a stop-loss order would be placed above the shadows (4).
Crossovers
The third signal the stochastic can provide is %K and %D crossovers. The RSI indicator doesn’t offer such signals because it consists of a single line.
The rule is simple: when the %K line falls below the %D line, the price is supposed to decline. Conversely, when %K breaks above %D, the price is expected to rise.
How to Trade on the Crossover Signal
Traders often use two crossover signals to enter and exit the market. The first is to open a position, and the second is to close. However, such a strategy may limit potential rewards. A similar situation is reflected in the chart above.
A trader could go long once %K (grey line) crosses %D (orange line) bottom-up (1). If they exit the market once the %K falls below %D, they would lose half of the potential income (2). Another option is to use a trailing take-profit order and to close half of the trade at the nearest resistance level (3) and the second half at another resistance level (4). The second resistance point is tricky as it’s based on previous lows, not highs. Therefore, it is worth waiting for the price to turn down.
Note: you can use not only highs but lows to place resistance levels. Conversely, you can use not only lows but highs to place support levels. This approach works when the trading volumes are low, and a trader assumes buyers/sellers don’t have enough strength to drive the price further.
Takeaway
It’s not difficult to use the stochastic indicator in trading. Its signals are logical, and the parameters are easily customisable. Therefore, traders with any level of experience use the stochastic oscillator in forex, stock, cryptocurrency*, index, and ETF trading. You can open an FXOpen account to practise the stochastic on live charts, comparing its signals to RSI alerts and combining various technical analysis tools.
*At FXOpen UK, Cryptocurrency CFDs are only available for trading by those clients categorised as Professional clients under FCA Rules. They are not available for trading by Retail clients.
This article represents the opinion of the Companies operating under the FXOpen brand only. It is not to be construed as an offer, solicitation, or recommendation with respect to products and services provided by the Companies operating under the FXOpen brand, nor is it to be considered financial advice.
Stay ahead of the market!
Subscribe now to our mailing list and receive the latest market news and insights delivered directly to your inbox.


Latest articles

Intel at a Crossroads: Earnings Beat Meets Technical Resistance
Intel has just delivered its strongest quarter in over fifteen years, and the market reaction says it all. Q2 2026 revenue surged 25% year-over-year to $16.1 billion, crushing the consensus estimate of $14.42 billion, while adjusted EPS of

Tesla: Complex Range Structure Breaks Down Following Quarterly Earnings
Tesla released its Q2 2026 results after the market closed on 22 July. Revenue increased 26% year-on-year to $28.24 billion, while vehicle deliveries reached a record 480,126 units. However, operating margin fell sharply to 1.4%, down from

Pound Weakens After Soft UK Inflation Data as Euro Awaits Fresh Market Signals
The pound remains under pressure following the release of weaker-than-expected UK inflation data. The slowdown in inflation has strengthened expectations that the Bank of England could adopt a more accommodative policy stance in the coming months, weighing on sterling. Meanwhile,