


FXOpen
The 52-week high and low are crucial metrics in stock trading, providing insights into a stock’s performance over the past year. These levels offer valuable guidance on potential breakouts and reversals. In this FXOpen article, we’ll explore their importance for determining reversals and breakouts and examine this with a couple of examples.
Understanding 52-Week High and Low
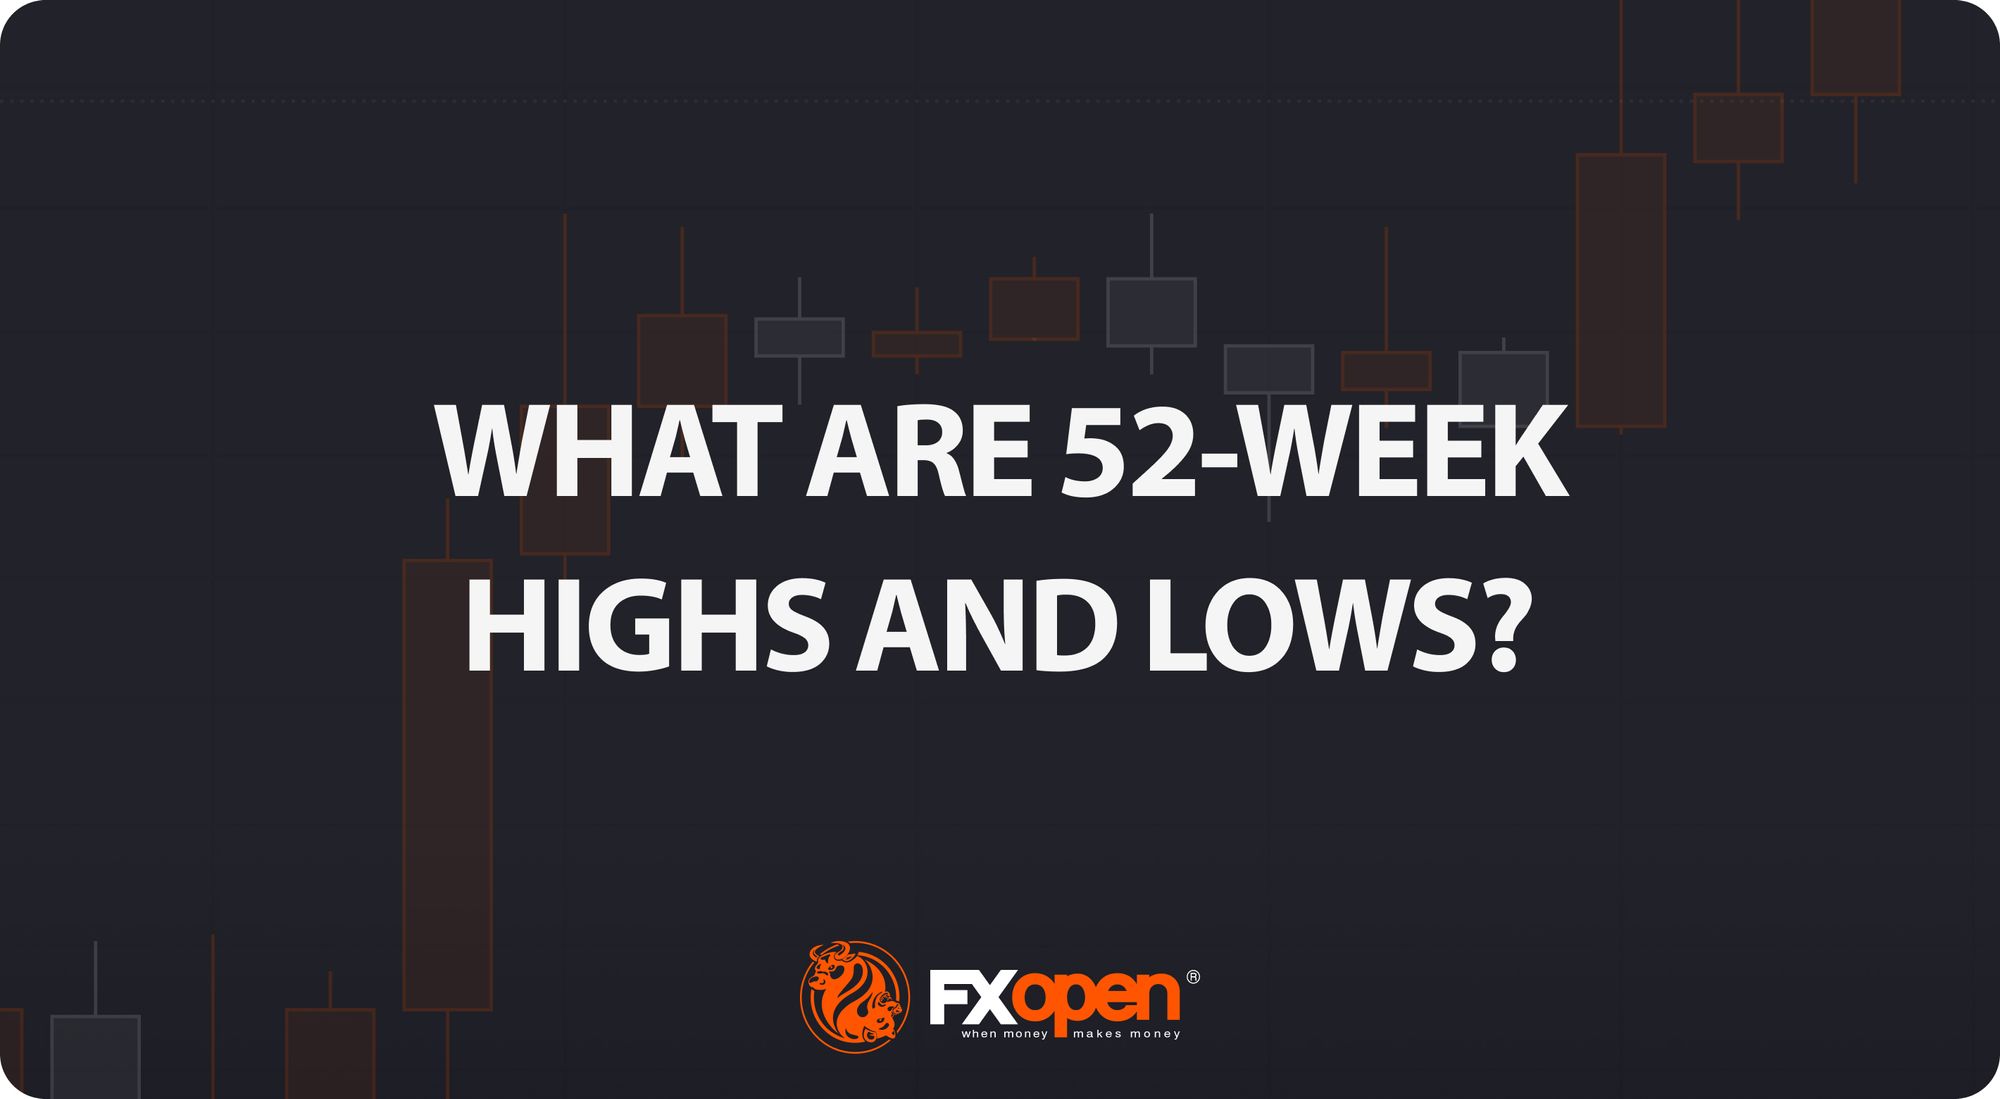
The 52-week high and 52-week low represent the highest and lowest closing prices for a stock over the past year. Note that this means the previous 52 weeks, not year-to-date. This metric is crucial for traders and investors as it provides a longer-term perspective on a stock's performance, helping them assess potential trading opportunities and market sentiment.
The 52-week high is often seen as a resistance level, where a stock's price struggles to rise above, while the 52-week low is viewed as a support level, where the price tends to stop falling. These levels are based on the daily closing prices, which means a stock might touch these levels intraday but not close at them.
52-week high stocks typically indicate bullish sentiment, given that strong momentum must be present for it to retest its 52-week high. Likewise, strong bearish sentiment and investor pessimism likely exist in 52-week low stocks. It is highly significant when a stock either closes beyond or is rejected from these levels.
A study titled “Volume and Price Patterns Around a Stock's 52-Week Highs and Lows: Theory and Evidence” found that small-cap stocks crossing their 52-week highs experienced average excess returns of 0.6275% in the following week, while large stocks saw gains of 0.1795% in the next week.
Importance of 52-Week High and Low in Trading
The 52-week high and low levels serve multiple purposes, guiding traders and investors in various ways.
Traders use the 52-week high and low to anticipate either potential breakouts or reversals. As stated, there is likely to be some strong momentum pushing the stock to these range limits, but that doesn’t necessarily indicate a future breakout.
Reversals, at least in the short term, can be common as these levels indicate a previous extreme in price and are often watched by traders for areas of strong support or resistance. Reversals typically occur as traders take profits or enter long/short positions, considering the stock oversold/overbought.
They also act as psychological benchmarks. Stocks nearing their 52-week highs or lows often attract plenty of attention, with some anticipating that the level will be traded through and break out. Stocks trading near their 52-week lows may present opportunities for value investors if they consider the underlying company to be fundamentally undervalued.
Lastly, the 52-week high and low provide a broader context for assessing a stock's volatility. A narrow spread between these levels indicates lower volatility, while a wider spread suggests higher volatility, helping traders gauge the risk associated with a particular stock.

Determining Reversals or Breakouts at 52-Week Highs and Lows
The 52-week high and low levels are significant markers in stock trading, indicating potential areas of strong support or resistance. Here, we delve into identifying reversals and breakouts at these critical junctures. To gain a deeper understanding of these factors, consider following along in FXOpen’s free TickTrader platform with our real-time stock charts.
Reversals
Here are the most common trader’s tools that can help you identify trend reversals at 52-week highs and lows.
Candlestick and Chart Patterns
Reversals often manifest through specific candlestick and chart patterns. Common reversal patterns include the doji, hammer, and shooting star. Less commonly known but equally significant are patterns like the evening star and abandoned baby. For instance, a doji or series of dojis at the 52-week high suggests indecision, potentially heralding a reversal as buyers lose momentum and sellers start gaining control.
Price Action
Analysing price action involves observing how the stock behaves around the 52-week high or low. If the price struggles to break through these levels over several days, forming reversal patterns or showing indecision, it indicates a likely reversal. Intraday breaches that fail to close beyond these critical levels on the daily timeframe often suggest the same.
Volume Analysis
Volume plays a crucial role in confirming reversals. A decline in volume as the price approaches the 52-week high or low suggests diminishing interest and the possibility of a reversal. Also, a surge in volume as price reverses might confirm the exhaustion of the current trend.
Fundamental Analysis
Fundamental analysis involves evaluating the company's financial health and broader market conditions. For instance, if a stock is nearing its 52-week high amid a broader market trend, such as the AI boom in 2024, rather than strong company-specific performance, the high might not be sustained. This misalignment between valuation and fundamentals can lead to a reversal as investors evaluate whether the stock has the capability to sustain a breakout.
Recency of High or Low
The timing of the 52-week high or low is crucial. Levels reached months ago are more likely to prompt a reversal compared to recent highs or lows. Long-standing levels draw more attention from traders, increasing the likelihood of a reversal when these levels are retested.
VWAP Analysis
The Anchored Volume Weighted Average Price (VWAP) is a valuable tool for identifying potential reversals. Anchoring the VWAP to the start of the year or decade and monitoring 1x, 2x, and 3x standard deviation bands can highlight overbought or oversold conditions. Stocks nearing their 52-week high or low and brushing against the second or third standard deviation bands (covering approximately 95.4% and 99.7% of data, respectively) can be strong candidates for a reversal.
Breakouts
Breakouts can also be confirmed with various tools.
Breakout Candlestick and Chart Patterns
Breakout patterns, like the marubozu, indicate strong momentum. Patterns with minimal wicks suggest decisive moves through the 52-week high or low, signalling a breakout. The inside bar candlestick pattern at these levels can also confirm breakouts, as can chart patterns like a flag, triangle, or pennant.
Price Action
Breakouts are typically characterised by prices moving through the high or low without significant resistance, often indicated by long candlesticks with minimal wicks. Persistent testing of recently established levels, where the price lingers near the high or low, without signs of reversal, supports a breakout scenario.
Volume Analysis
High volume generally confirms breakouts. A substantial increase in volume as the price moves through the 52-week high or low suggests strong trader interest and can confirm the breakout.
Fundamental Analysis
Fundamentals can support breakouts. Positive earnings reports, bullish forward guidance, or favourable market conditions align with breakouts. These factors underpin the stock's ability to sustain its move beyond the 52-week high. At the same time, disappointing fundamentals may trigger a breakout beyond the 52-week low.
Recency of High or Low
If a stock revisits a 52-week high or low reached only a few weeks, it can indicate strong momentum, favouring a breakout. Frequent retests of these levels within a relatively short timeframe reflect a persistent willingness to move past these barriers, given that it wasn’t long ago that price was previously rejected from the area.
Examples of 52-Week High and Low Trading
These are some examples of 52-week high and low trading.
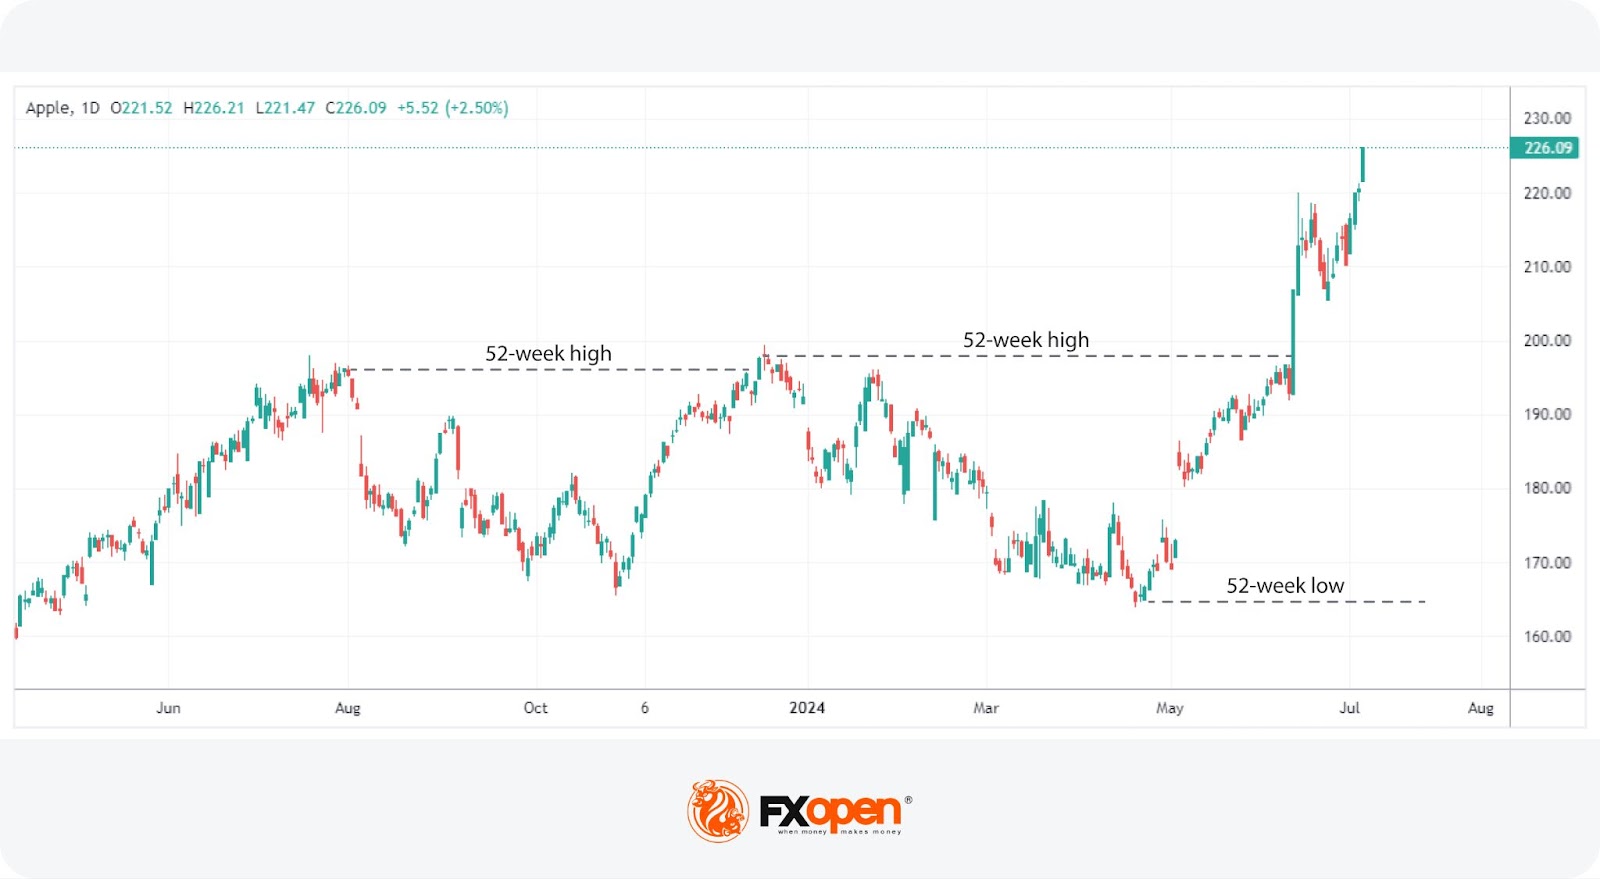
Example 1: Microsoft (MSFT) - 52-Week High
In 2023, Microsoft experienced a robust uptrend, significantly fueled by the third phase of the partnership with OpenAI, the creators of ChatGPT, that was announced in January. This bullish sentiment surrounding AI technology drove Microsoft's stock to a 52-week high in July. Following a trough after this peak, Microsoft's strong earnings report in late October exceeded market expectations and revitalised the stock.
As Microsoft approached its previous high, the stock showed some signs of indecision, including a spinning top as it attempted to close above the 52-week high. It eventually closed that day higher before plotting a strong marubozu candle, signalling strong buying interest.
When traders eventually took profits, the stock briefly declined. However, Microsoft resumed its upward trajectory.
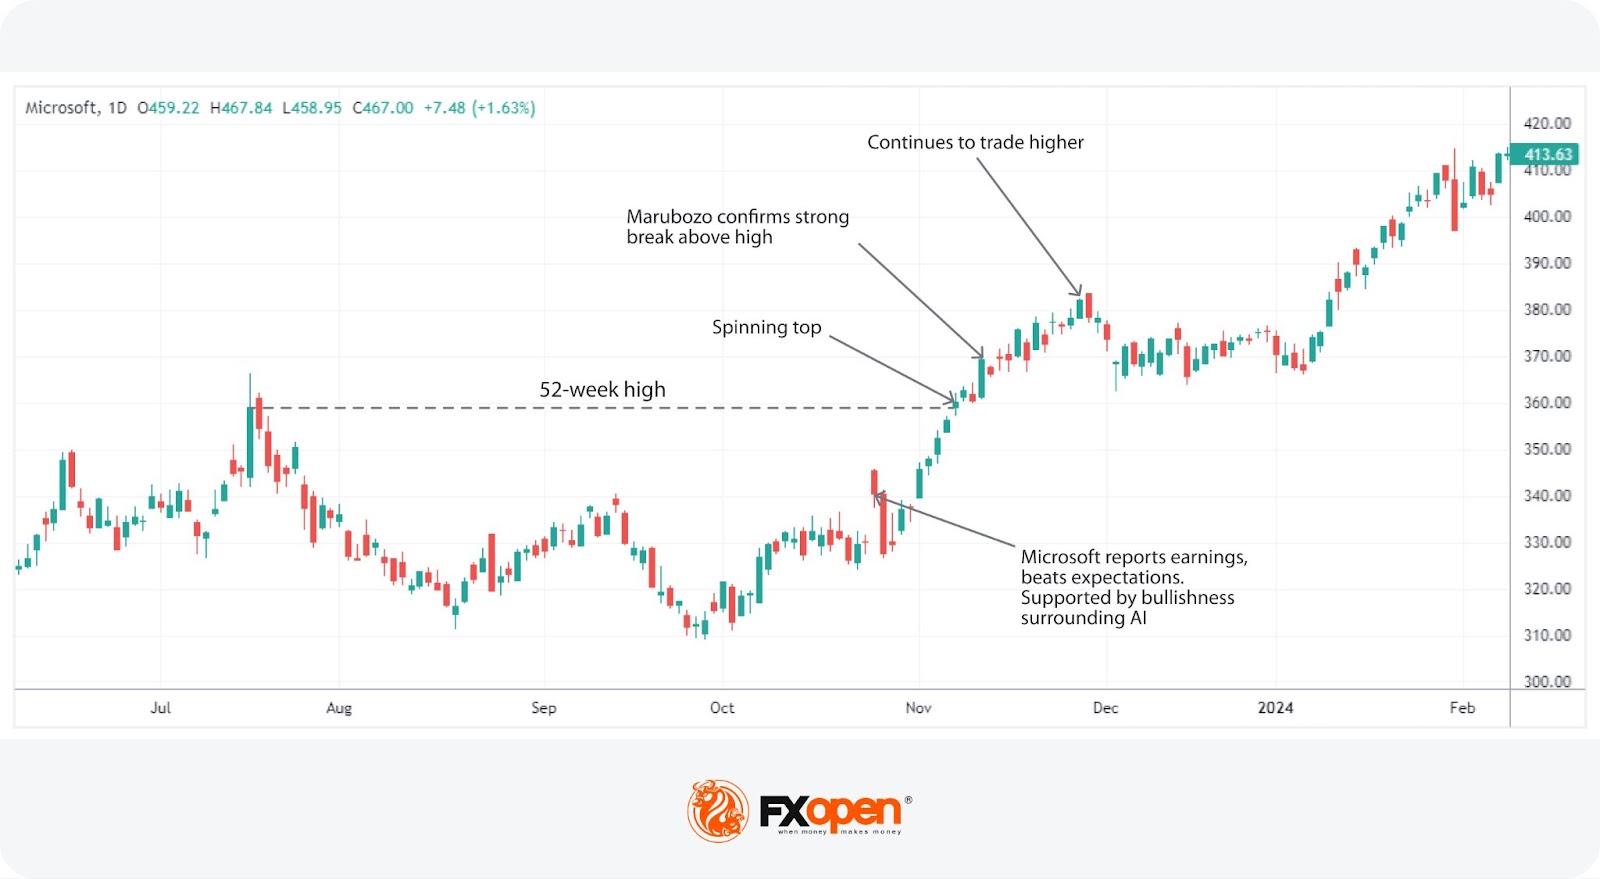
Example 2: PayPal (PYPL) - 52-Week Low
While initially buoyed by the COVID-19 pandemic’s loose monetary policies, PayPal's stock began declining sharply in 2022 as interest rates rose to combat inflation. The stock reached a 52-week low in July 2022. After reporting earnings in early November, PayPal bounced but struggled to make meaningful gains above prior highs.
In December, it traded below its earnings low and 52-week low, forming a hammer candlestick—a potential reversal signal—while showing signs of indecision at this level. However, PYPL didn’t linger here for long; it reversed course with a couple of green marubozu candlesticks and a gap higher, indicating strong upward momentum and a potential entry signal.
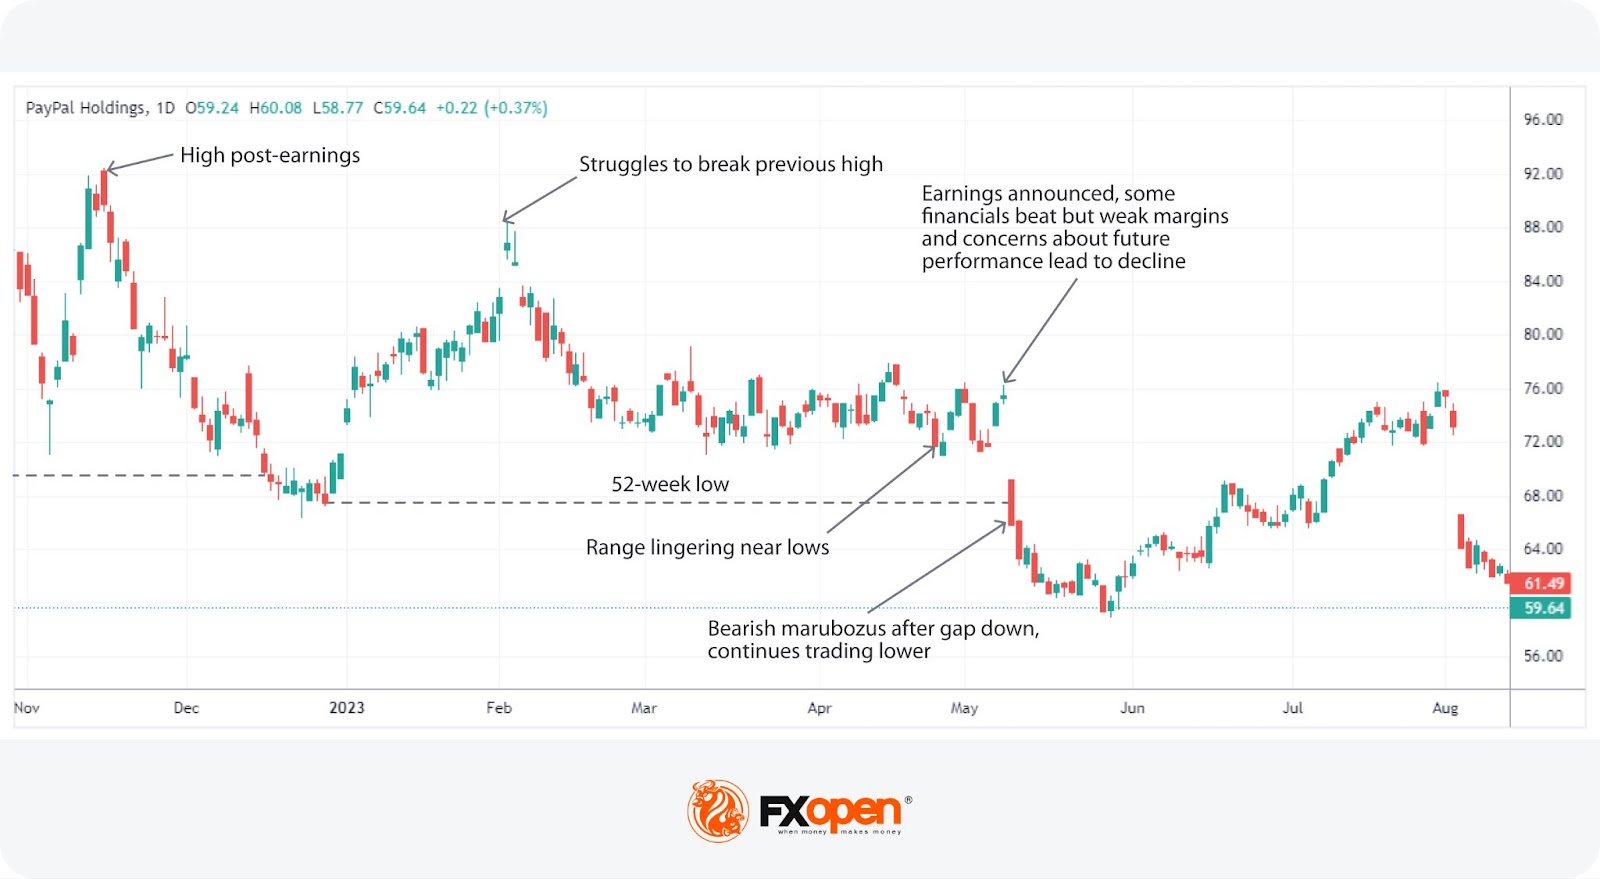
Despite climbing higher after this low, the stock peaked in early February, failing to reach its previous November high. Over the following months, PayPal ranged near its 52-week low. In May, PayPal's earnings beat some expectations but highlighted weak margins and increased competition, damaging future optimism. This resulted in a gap down and strong bearish marubozu candles in the subsequent days.
While there wasn’t a significant breakout after the 52-week low was traded through, the lack of a quick reversal gave traders a strong indication that PayPal was likely to remain bearish. Subsequently, PayPal briefly retested the pre-earnings range in July before the bearish trend continued and the new 52-week low was breached again.
Potential Risks and Considerations
Trading based on 52-week highs and lows carries several risks and requires careful consideration:
- False Signals: Price movements can sometimes give false signals, leading traders to believe a breakout or reversal is occurring when it is not. For instance, a stock might temporarily breach its 52-week high but then reverse sharply, trapping traders in unfavourable positions.
- Market Sentiment Overload: Relying too heavily on 52-week highs and lows can lead to overemphasising market sentiment. This might cause traders to overlook other crucial factors, such as economic indicators or sector-specific trends that could affect stock performance.
- Volatility: Stocks at these critical levels often experience increased volatility. Sudden price swings can lead to significant losses, especially if traders do not use appropriate risk management strategies like stop-loss orders.
- Fundamental Misalignment: A stock reaching its 52-week high or low might not always reflect its true value. External factors such as market hype or short-term news can drive prices, leading to misalignment with the stock’s fundamental value. For example, during the AI boom in 2024, many stocks surged despite having weak underlying financials.
The Bottom Line
Understanding and utilising the 52-week high and low can enhance stock trading strategies by providing insights into market sentiment and potential price movements. By incorporating these metrics, traders can make wiser decisions about breakouts and reversals. Open an FXOpen account today to start leveraging these crucial trading indicators and enhance your market analysis capabilities in over 600 markets.
FAQ
What Does the 52-Week High and Low Mean?
The 52-week high and low represent the highest and lowest prices at which a stock has traded over the past year. These levels help traders and investors gauge market sentiment and identify potential support and resistance points. They provide a longer-term perspective on a stock’s price movements and are important indicators in technical analysis.
How to Calculate the 52-Week Range?
To calculate the 52-week range, identify the highest and lowest closing prices of a stock over the past 52 weeks. This data can typically be found in the summary section of financial news websites or stock market tracking apps. The 52-week high is the highest closing price, and the 52-week low is the lowest closing price within this period.
Why Is a 52-Week High Important for Stocks?
A 52-week high is significant because it indicates strong investor confidence and bullish sentiment. It often acts as a resistance level where the stock price might face selling pressure. A 52-week high trading strategy typically involves watching for reversals or breakouts in these areas.
How Many Days Are in 52 Weeks?
There are 364 days in 52 weeks, as each week consists of 7 days (52 weeks x 7 days = 364 days). This figure is just one day short of a full year, which is 365 days in a common year and 366 days in a leap year.
This article represents the opinion of the Companies operating under the FXOpen brand only. It is not to be construed as an offer, solicitation, or recommendation with respect to products and services provided by the Companies operating under the FXOpen brand, nor is it to be considered financial advice.
Stay ahead of the market!
Subscribe now to our mailing list and receive the latest market news and insights delivered directly to your inbox.


Latest articles

European Currencies Decline: Pound Hits New Lows, Euro Under Pressure
European currencies continue to weaken against the US dollar amid rising geopolitical tensions and increased demand for safe-haven and liquid assets. Market participants are reducing exposure to riskier instruments, putting pressure on both the euro and the pound. Additional support

Market Analysis: GBP/USD Dips Further As EUR/GBP Regains Traction
GBP/USD failed to climb above 1.3500 and corrected some gains. EUR/GBP started a decent increase and might aim for more gains above 0.8700.
Important Takeaways for GBP/USD and EUR/GBP Analysis Today
· The British Pound
