


What Are Seasonal Trading Patterns and How Can You Trade with Them?
FXOpen
Unpredictability is a trademark of financial markets, but certain formations seem to repeat over time. These are called seasonal trading patterns. In this article, we'll demystify what they are and explore how to take advantage of them in your trading. Whether you're new to the field or an experienced trader, understanding these could help you make smarter investment decisions. Let's get started!
What Are Seasonal Patterns of Financial Markets?
Seasonal moves of financial assets represent predictable trends or fluctuations in asset prices that reoccur at certain times throughout the year. This concept, known as seasonal trading patterns, lies in the fact that market movements often correlate with seasonal activities or calendar periods. The understanding and study of these formations can provide a useful guide for timing investment and trading decisions.
Popular types of these patterns include the “January Effect.” This phenomenon often results in a surge in stock prices at the start of the year. The “Christmas Rally” is another trend where the US stock markets often strengthen towards the end of December.
“Sell in May and Go Away” is another popular strategy that suggests offloading shares in May and re-entering the market in October to avoid summer stagnation.
Seasonal patterns are determined by either the average profit or loss for a specific period in terms of the financial instrument analysed (e.g. gold exhibited an average 6% rise in March) or by merely evaluating the net positive or negative performance during that period (e.g. GBP/USD experienced declines in 8 out of the last 10 Februaries).
How Are Seasonal Patterns of Financial Markets Formed?
Seasonal patterns in financial markets can be influenced by various factors:
- Specific times of the year, such as seasons, months, or weeks.
- Anticipated occurrences like corporate reporting periods or major economic news.
- Weather conditions like particularly cold winters or hot summers.
Other reasons why seasonal patterns form can be found below:
- Many human behaviours follow a seasonal rhythm.
- Fluctuations in the supply and demand of financial securities.
- Emotional states vary based on the time of year, like during festive seasons.
- Particular seasonal payment schedules, for instance, at the year's commencement or termination.
- Times of extreme weather conditions, including extreme heat or cold, storms, and so on.
- News dissemination times, like when businesses disclose their quarterly financial data.
- The agricultural harvest season.
Why Trade Seasonal Patterns of Financial Markets?
Trading them is appealing due to their predictability. By identifying formations that consistently occur, traders can position themselves to capitalise on these movements.
For instance, if a trader notices that a particular currency pair exhibits a consistent trend during a specific month, they can execute trades based on this knowledge. Moreover, these setups allow traders to manage risk by informing them about when to exit a position before a trend reverses.
Let's consider whether additional factors could inspire you to incorporate seasonal trends into your financial market trading strategy. Here are a few:
- Asset prices in financial markets often respond to natural occurrences and cycles.
- When an event has taken place consistently in the past, there's a good chance it will happen again. Changes in seasons, tax payment periods, and company report releases are examples of events that typically happen around the same time.
- Analysing past data is one of the few methods available to predict financial market movements, which is also the foundation of technical analysis.
- It's wise to use multiple analysis techniques to validate your trading signals. Seasonal market patterns and charts can be valuable tools in this regard.
How to Find Seasonal Patterns in Financial Markets
Finding repetitive motifs in the finance world requires careful research and analysis. Traders can use historical data to identify trends. Traders can download trading seasonal price patterns in stocks, futures, & forex available on several investing platforms. Further education is available through different platforms to further enhance traders' understanding of these setups.
How to Trade Seasonal Patterns in Financial Markets
To trade period setups, traders first identify the recurring trends in an asset's price. In different time series, seasonal patterns in trading are identified. Once a formation is identified, a trader can create a strategy to capitalise on predictable movements. This may involve buying an asset before the expected upward trend and selling it before the trend's typical reversal. Remember, these setups provide probabilities, not certainties, and must be used alongside other technical analysis tools.
To start trading these setups, you first need to open a trading account – you can open an FXOpen account and begin your journey. To make the process even easier, FXOpen provides a trading platform known as TickTrader, which comes equipped with sophisticated tools for analysing market trends.
Below there are examples of seasonal patterns in different markets, including commodities, foreign exchange, and stocks.
Seasonal Patterns of Gold
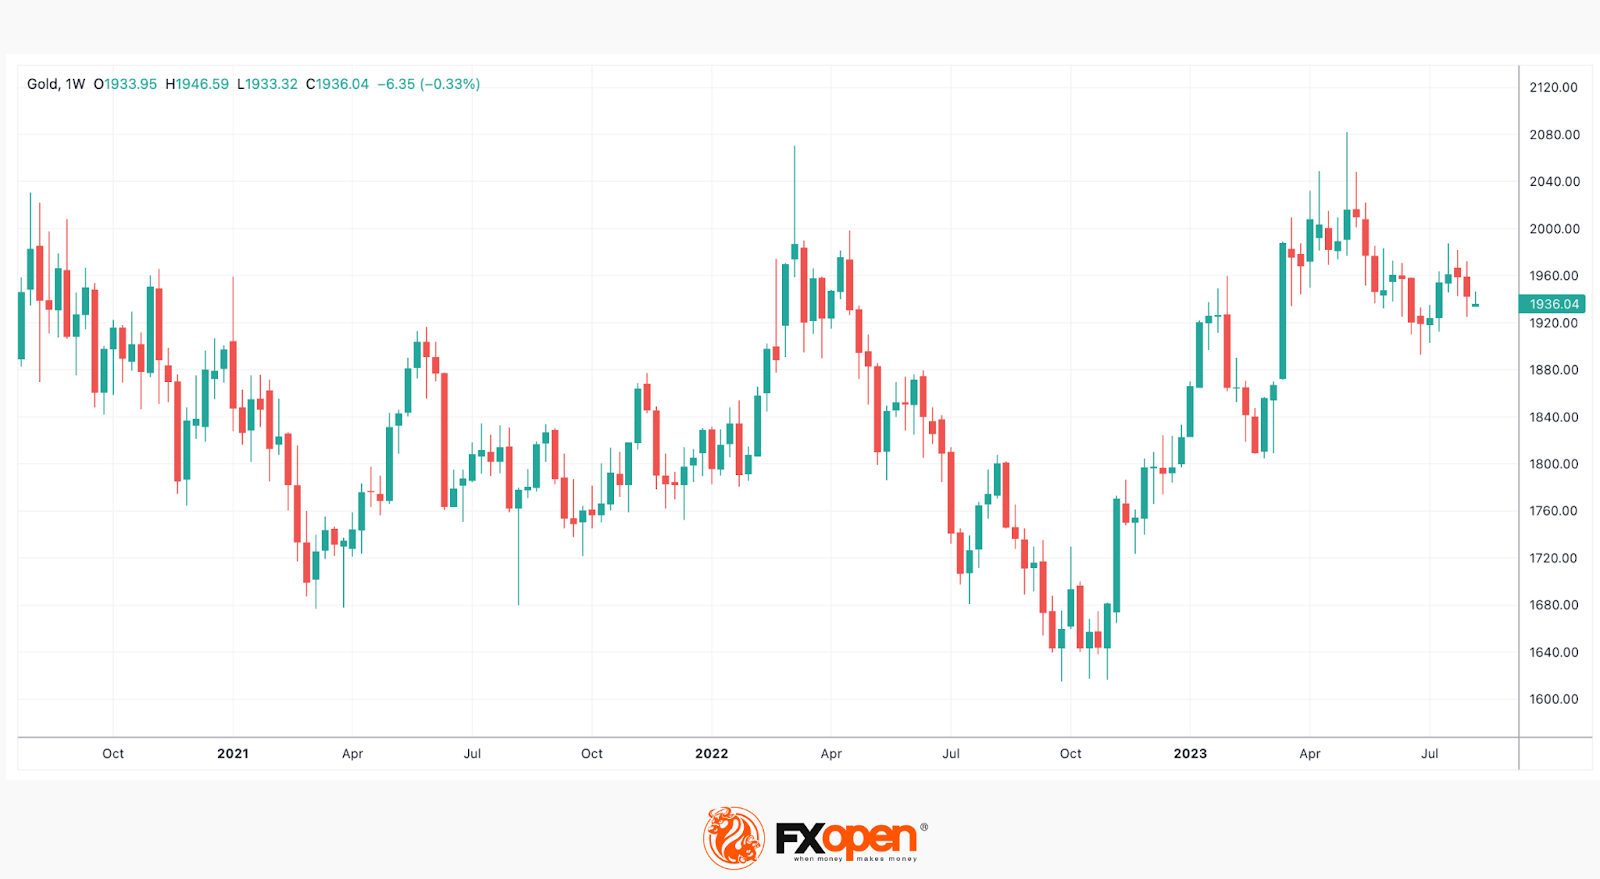
Gold often experiences a rise in demand during periods of economic uncertainty. However, it also displays consistent behaviour. Indian wedding seasons and Chinese New Year celebrations can often trigger a rise in the gold price due to cultural traditions of gifting gold.
Gold exhibits traditional strength at the beginning of the year in January and February, is typically traded in the range from March to July, and experiences traditional strength again in August and September.
Seasonal Patterns of Oil
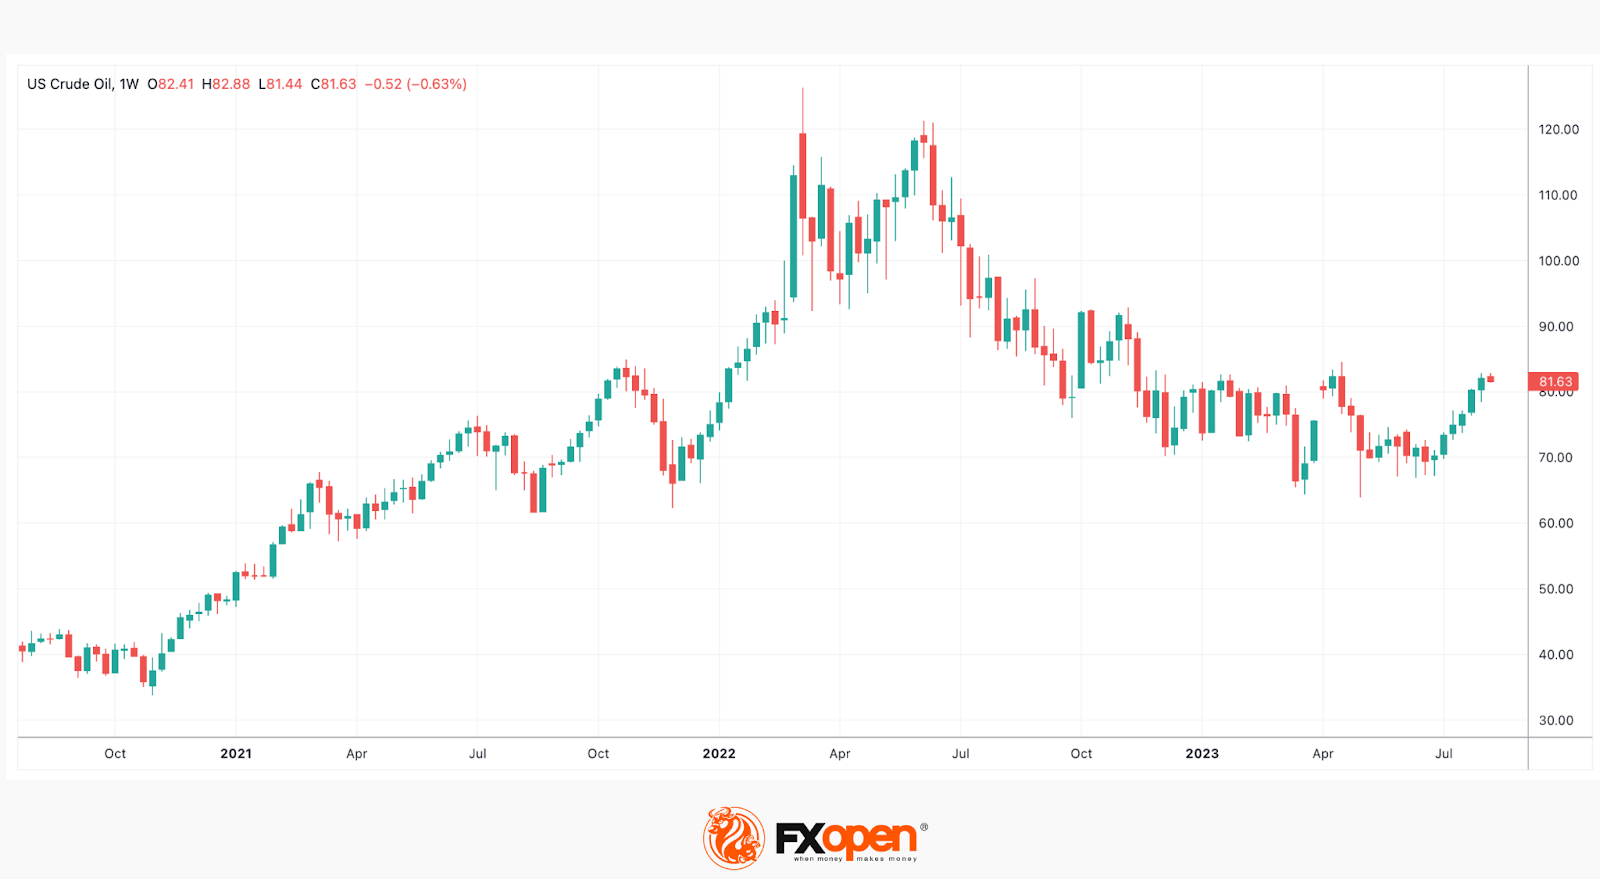
Oil prices often rise during the summer months when demand for gasoline peaks due to the travel season. Alternatively, prices typically fall in late autumn when the demand decreases.
WTI oil prices commonly experience an upward trend during the majority of the first half of the year, specifically from February to June. Subsequently, WTI is predominantly traded between July and September, while historically, the last quarter has been traditionally weak for WTI oil.
Seasonal Patterns in the Forex Market
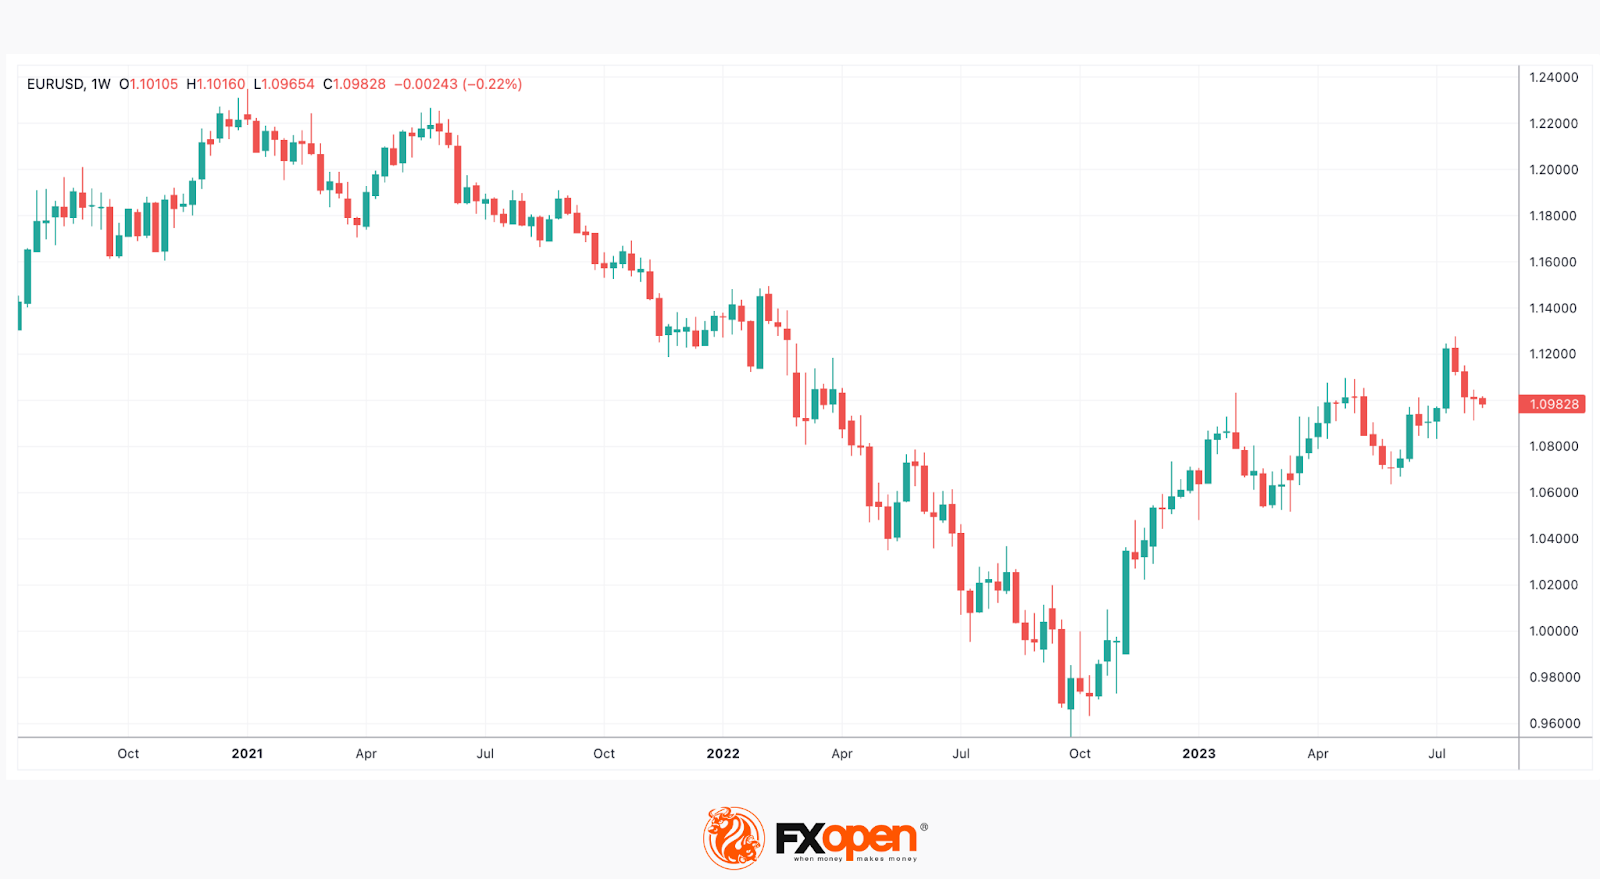
Forex also shows similar trends. For example, the USD generally strengthens at the start of the year and weakens in December.
EUR/USD, as shown below, typically exhibits weakness at the start of the year, particularly in January and February. In contrast, the currency pair traditionally reaches its lowest point in November and performs strongly in December. Moreover, EUR/USD tends to show relatively positive trends in March and April, as well as in the month of September.
It's essential to note that other currency pairs traded on the forex market may also display seasonal trends, but the periods of strength and weakness are likely to vary for each pair.
Seasonal Patterns of Stocks
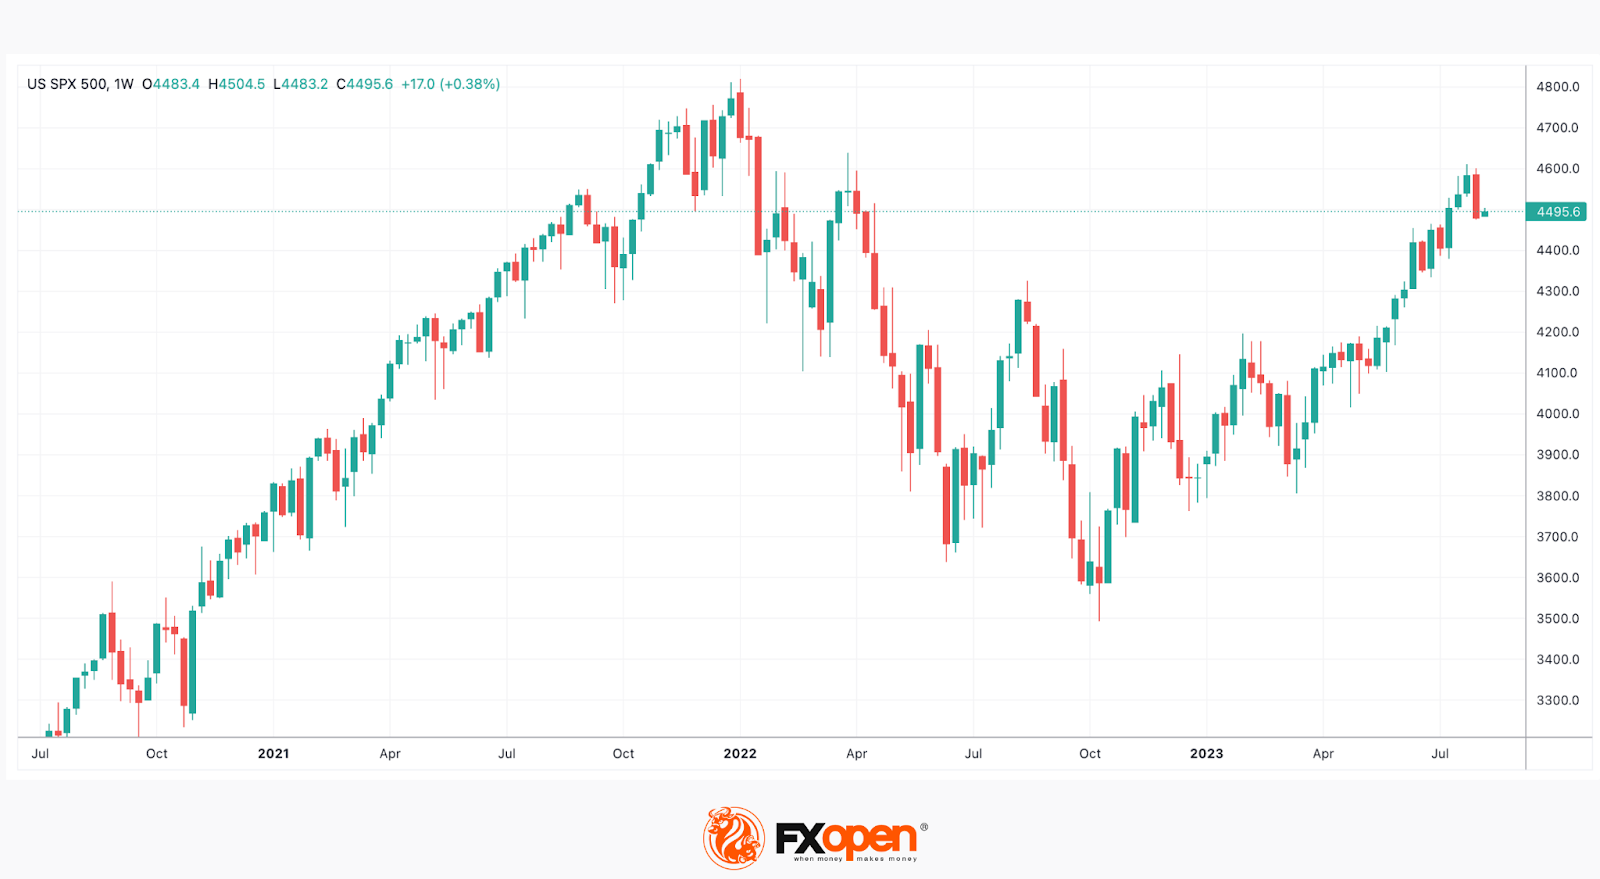
The S&P 500 index - the best example of the stock market - typically demonstrates strength in the last quarter of the year, along with a rally in the last and first days of the year, known as the “Christmas Rally” and “January Effect.” Additionally, the S&P 500 traditionally experiences strength during the March-April period. However, from May to September, the S&P 500 is more commonly traded within a range, adhering to the “Sell in May and Go Away trend.”
Similar patterns can be observed in other stock indexes and trending stocks.
Final Thoughts
Trading periodic setups can provide a wealth of opportunities for traders who understand how to exploit these recurring trends. It's a powerful strategy when used correctly but should be employed alongside other trading tools and techniques for confirmation.
Remember, these patterns provide probabilities, not certainties. Keep refining your knowledge, utilising different resources for trading seasonal price patterns in stocks, futures, and forex, and keep a close eye on your trades with the help of efficient trading platforms like FXOpen.
This article represents the opinion of the Companies operating under the FXOpen brand only. It is not to be construed as an offer, solicitation, or recommendation with respect to products and services provided by the Companies operating under the FXOpen brand, nor is it to be considered financial advice.
Stay ahead of the market!
Subscribe now to our mailing list and receive the latest market news and insights delivered directly to your inbox.


Latest articles

AI Valuations Are Back in the Spotlight
Artificial intelligence remains the dominant investment theme of 2026, but investors are increasingly questioning whether AI stock valuations are keeping pace with reality.
💰 Big Tech continues to invest at an unprecedented scale, with hyperscaler AI spending projected to exceed $800

AUD/CAD: Months of Indecision — Is a Breakout Finally Coming?
The Australian dollar has clawed back most of its end-of-June losses, when it touched three-month lows against the greenback amid escalating Middle East tensions. Since then, sentiment has improved: the RBA's Assistant Governor Sarah Hunter signalled the board stands ready

USD/JPY: Battling at the Top of the Triangle
On 3 July, Japan's Finance Minister, Satsuki Katayama, stated that the Ministry of Finance remains in close contact with US authorities regarding developments in USD/JPY as the yen traded near its weakest level in almost 40 years. Similar verbal