


What Are Triangle Patterns in Crypto Trading?
FXOpen
Triangle patterns play a significant role in crypto trading, offering traders valuable insights into potential market dynamics. Whether it's an ascending, descending, or symmetrical triangle, these patterns provide helpful information for making informed trading decisions in the exciting and fast-paced world of cryptocurrency trading. This article will delve into the crypto triangle patterns and explain their unique features.
What Is the Triangle Pattern?
The triangle is a pattern that can be found in bullish and bearish trends and can signal both their continuation and reversal depending on the market conditions. It is formed by drawing trendlines connecting a series of highs and lows, resulting in a converging triangular shape. The setup represents a period of consolidation or indecision in the market as the price range narrows between the two trendlines.
Traders often analyse these formations to identify potential breakouts and trade on platforms like FXOpen, taking advantage of the opportunities presented by these patterns in the cryptocurrency market.
Ascending Triangle Pattern in Crypto
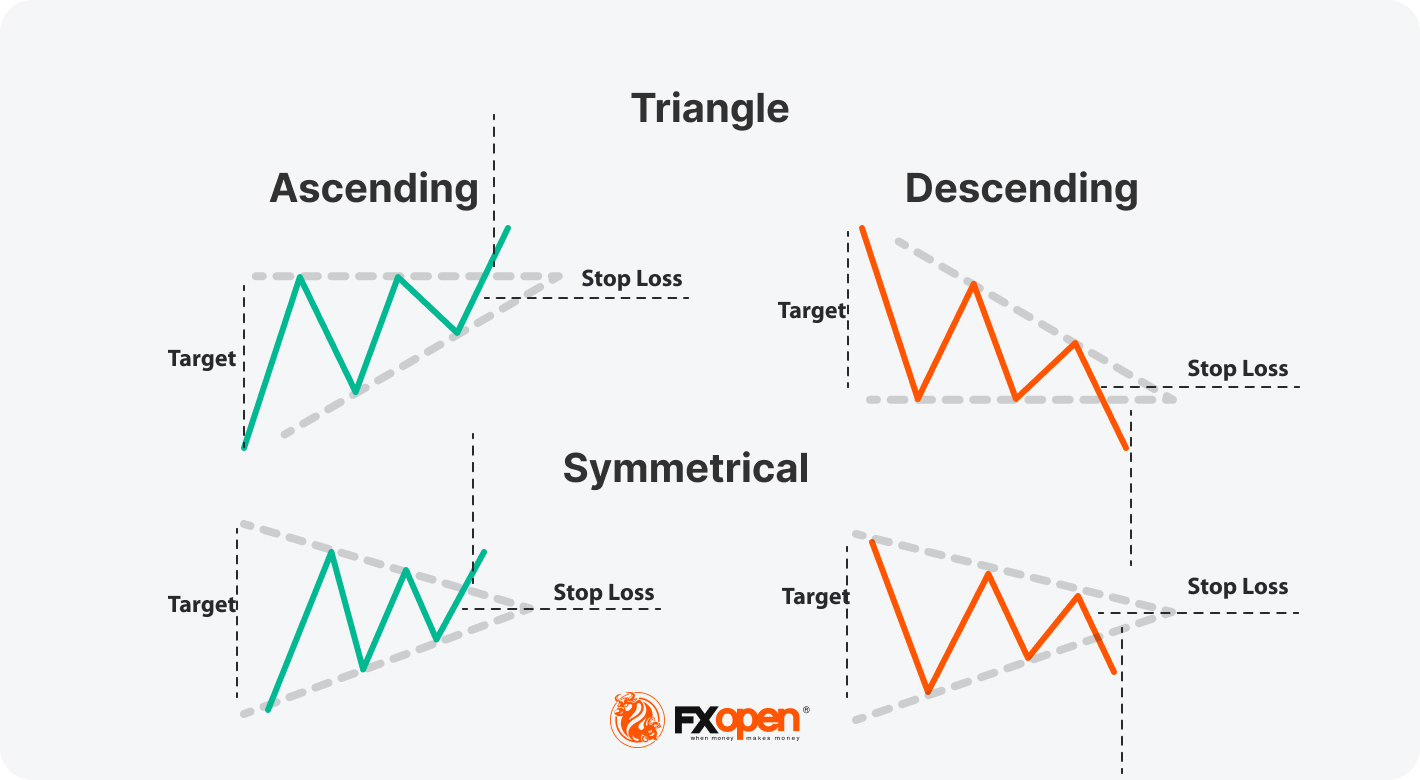
An ascending triangle is a bullish variation of the triangle pattern. It is characterised by a horizontal resistance line that connects almost equalled highs and an upward-sloping support line that connects the higher lows. This formation suggests that buyers are becoming more aggressive and pushing the price higher. A breakout above the horizontal resistance line is considered a bullish signal, potentially leading to further price appreciation.
Descending Triangle Pattern in Crypto
A descending triangle is a bearish variation of the triangle setup. It is formed by a horizontal support line connecting almost equalled lows and a downward-sloping resistance line connecting the lower highs. This formation indicates that sellers are becoming stronger, driving the price lower. A breakdown below the horizontal support line is seen as a bearish signal, potentially triggering further price declines.
Symmetrical Triangle Pattern in Crypto
A symmetrical triangle is a neutral pattern where both the support and resistance lines converge. This formation suggests a period of indecision in the market, with buyers and sellers in equilibrium. Traders typically wait for a breakout above or below the triangle's boundaries to determine the direction of the next major price move.
Triangle Pattern Timescales
Triangle setups can be observed on various timescales, from short-term intraday charts to long-term weekly or monthly ones. The significance and duration of a triangle pattern may vary depending on the timeframe in which it occurs. A shorter-term formation may lead to smaller price moves, while a longer-term formation could indicate more notable trends.
How to Crypto Trade with Triangle Patterns
Trading triangle formations in cryptocurrencies involve identifying the formation of the pattern and waiting for a confirmed breakout. Traders often place entry orders just above or below the pattern's boundaries to capture potential price movements.
Stop-loss orders may be placed on the opposite side of the breakout, aiming to limit potential losses if the market moves against the trade. Profit targets may be set based on technical analysis techniques, such as measuring the height of the triangle setup and projecting it in the direction of the breakout. Traders may also use the closest support and resistance levels as targets.
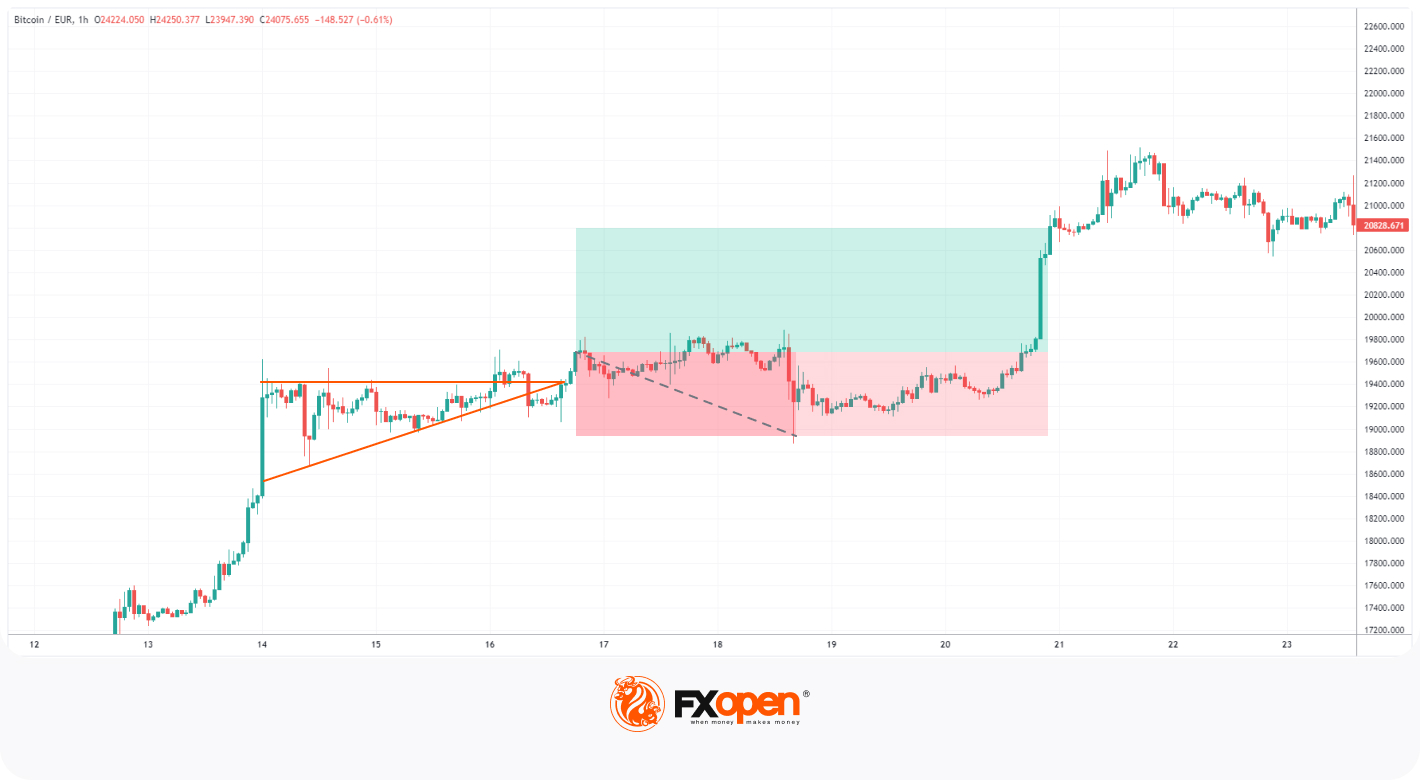
A trader places a buy trade at the close of the candle formed after the breakout of an ascending triangle on the BTCUSD chart. They place a stop loss just beneath the breakout bar with the take profit value similar to the height of the setup.
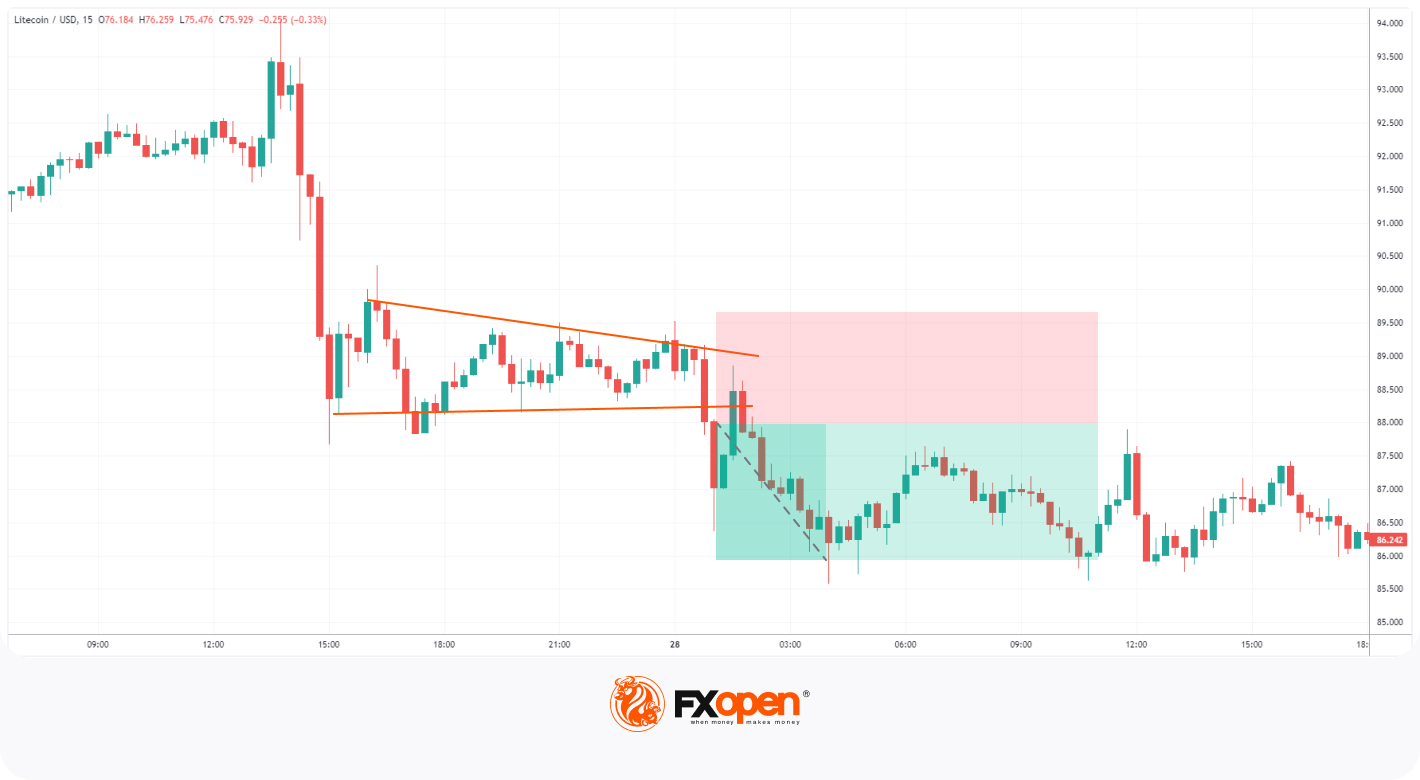
There is a descending triangle setup on the LTCUSD chart, where a trader places a short trade at the breakout of the setup. The stop loss is above the breakout with the take profit at the next support.
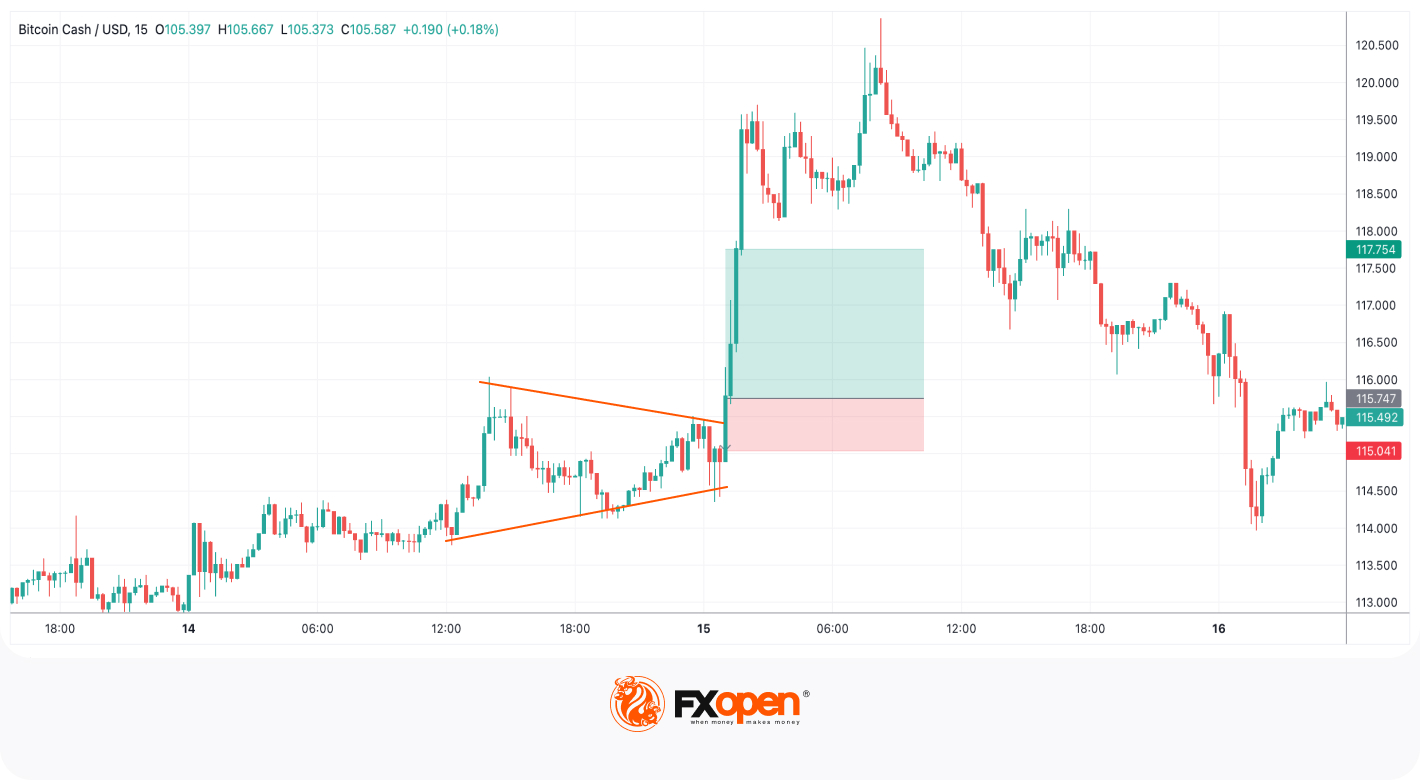
There is a symmetrical triangle setup on the BCH/USD chart, where the trader places a buy trade at the close of the breakout candle. The stop loss is below the upper band of the symmetrical triangle with the take profit at a distance equal to the triangle’s height.
If you're interested in trading triangle patterns in cryptocurrencies, you may open an FXOpen account. We provide a reliable platform that enables you to execute trades and manage your positions effectively.
How to Test the Triangle Strength
To test the strength of a triangle pattern, traders can consider the following factors:
- Timeframe: Analyse the triangle pattern on different timeframes, ranging from shorter-term to longer-term charts, to gain a better understanding of its strength and significance.
- Triangle Structure: Evaluate the structure of the triangle pattern. A well-defined shape with clear trendlines can indicate a stronger pattern compared to a distorted or irregular formation.
- Duration: Consider the duration of the triangle pattern. Generally, the longer the pattern persists, the stronger its potential breakout can be.
- Volume: Examine the volume during the formation of the triangle pattern. Gradually decreasing volume within the triangle indicates reduced market interest and potential indecision. However, a sudden surge in volume during the breakout can strengthen the pattern's reliability.
- Trend Confirmation: Assess the direction of the preceding trend before the formation of the triangle. A triangle pattern that aligns with the prevailing trend tends to be stronger.
Key Points to Note When Trading with Triangle Patterns
When trading with the setup, it is important to consider the following factors:
- Confirmation: When trading with triangle patterns, it is crucial to wait for a confirmed breakout before entering a trade to avoid false breakouts. Confirmation of a breakout can be achieved through various methods, including a sustained move beyond the breakout level with a closing price beyond it, higher trading volumes during the breakout, and a confirmation of trend indicators.
- Timeframe: Determine the timeframe of the triangle formation to match your trading strategy and objectives.
- Market Context: Consider the broader market conditions, trends, and relevant news or events that could impact the breakout.
- Risk Management: Set appropriate stop-loss orders and position sizes to manage risk and protect capital.
Closing Thoughts
It is crucial to remember that no setup or technical analysis technique guarantees successful trading outcomes. Complementing technical analysis with fundamental analysis, market research, and risk management strategies may be preferred. Developing a disciplined and informed approach, combined with experience and a focus on continuous learning, may improve decision-making and potentially result in more successful trading outcomes.
Platforms like TickTrader provide valuable resources, including charting tools and technical analysis indicators, to aid in the analysis and identification of triangle formation. By leveraging these tools and combining them with effective trading strategies, traders may strive for more favourable outcomes when trading triangle setups in the dynamic world of cryptocurrencies.
FAQ
Are triangle patterns reliable indicators of future price movements?
While these formations can provide valuable insights, they are not foolproof and should be used in conjunction with other technical analysis tools and market indicators. It's important to consider the overall market context, trend, and other factors influencing price action for a comprehensive analysis.
What is a false breakout in triangle patterns?
A false breakout in a triangle formation occurs when the price briefly moves beyond the formation’s boundaries but fails to sustain the breakout, reversing back into the consolidation range. False breakouts can result in losses.
Can triangle patterns occur in other financial markets apart from cryptocurrencies?
Yes, the setups are observed in various financial markets, including stocks, forex, and commodities. They are considered common and reliable chart setups across different asset classes.
How do triangles help in risk management?
Triangles can assist in position sizing and risk management by providing potential entry and exit points for trades. By calculating the potential reward-to-risk ratio, typically derived from profit targets based on the pattern's height, traders can assess whether the potential profit justifies the risk taken. It is essential to note that risk management strategies should be individualised and consider the trader's risk tolerance, trading style, and overall portfolio management principles.
At FXOpen UK and FXOpen AU, Cryptocurrency CFDs are only available for trading by those clients categorised as Professional clients under FCA Rules and Professional clients under ASIC Rules, respectively. They are not available for trading by Retail clients.
This article represents the opinion of the Companies operating under the FXOpen brand only. It is not to be construed as an offer, solicitation, or recommendation with respect to products and services provided by the Companies operating under the FXOpen brand, nor is it to be considered financial advice.
Stay ahead of the market!
Subscribe now to our mailing list and receive the latest market news and insights delivered directly to your inbox.


Latest articles

WTI Analysis: Gap Breaks Short-Term Trend as Price Remains Trapped Between the POC and Profile Boundary
WTI crude oil plunged by more than 7% on 27 July 2026 after the US suspended a series of strikes against Iran over the weekend, raising hopes of a diplomatic solution and the reopening of shipping through the Strait of

US Dollar Index: A Defining Week for the King of the Markets
The dollar heads into a pivotal week trading near 101.80, just off a 15-month high, with the Fed's July 29 meeting standing as the clear focal point. Markets currently price roughly a 65% chance of a hold, though renewed

NZD/USD: Inflation Surge Meets Strong US Dollar Pressure
On 21 July, Stats NZ reported an acceleration in inflation: the Consumer Price Index rose 1.5% in the second quarter, while the annual inflation rate climbed to 4.1%, its highest level in more than two years and slightly