


FXOpen

In crypto trading, candlestick patterns serve as crucial tools for traders to analyse market trends and anticipate reversals. Tweezer top and bottom candlesticks fall into this category. These distinctive formations grab traders' attention as they indicate potential trend reversals. This article explores the meaning of tweezer top and bottom setups in technical analysis.
What Are Tweezer Tops and Tweezer Bottoms?
Tweezer tops and bottoms are technical setups that indicate potential trend reversals.
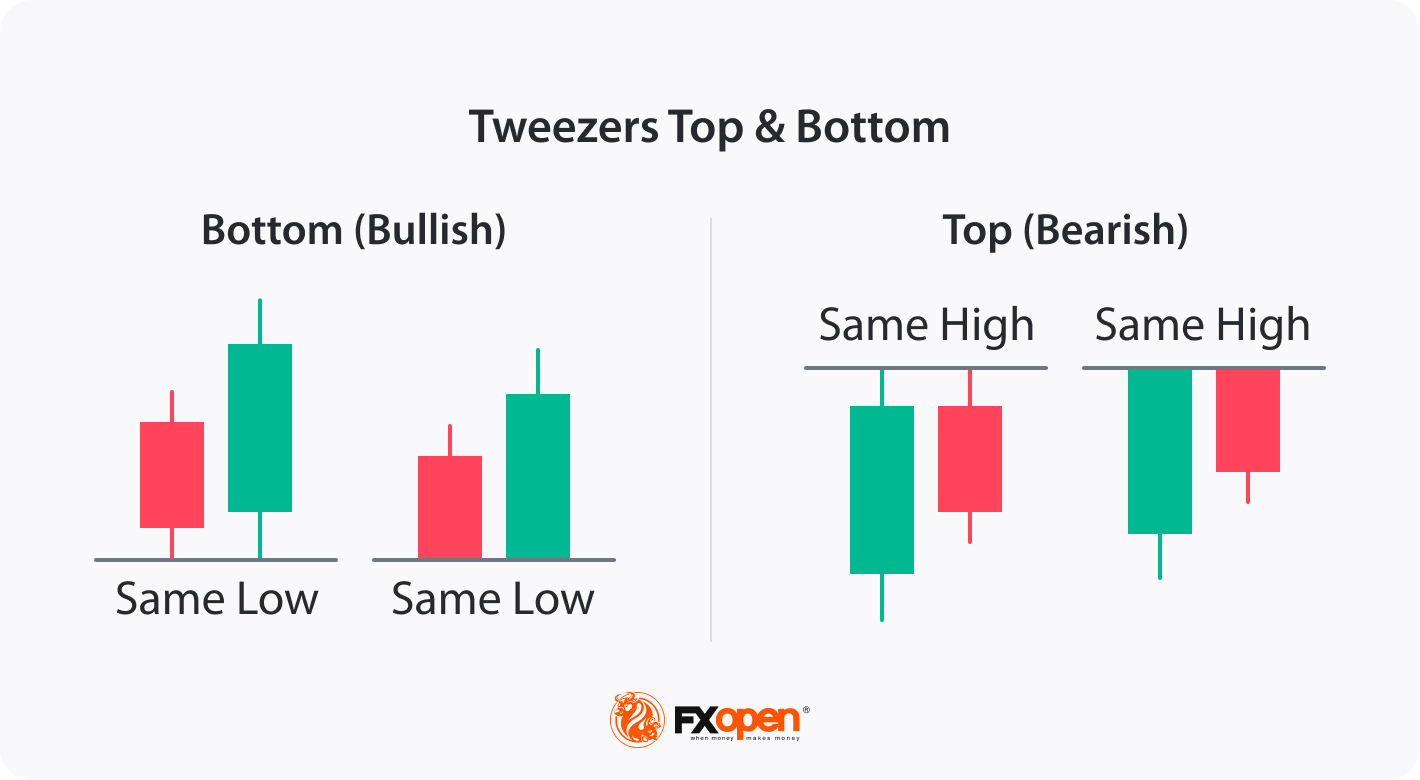
- Tweezer Tops: A tweezer top candlestick pattern occurs when two consecutive candlesticks, green and red, have similar high prices, forming a horizontal resistance level. It suggests a possible bearish reversal, indicating that buying pressure is weakening.
- Tweezer Bottoms: A tweezer bottom candlestick pattern forms when two consecutive candlesticks, red and green, have similar low prices, creating a horizontal support level. It suggests a potential bullish reversal, indicating that selling pressure is subsiding.
Regardless of the timeframe, traders can utilise the pattern across various financial instruments like forex, stocks, cryptocurrencies, ETFs, and indices. If you're seeking to trade this pattern, consider the advantages of trading on the FXOpen platform.
Identifying Tweezer Tops and Bottoms on Crypto Charts
Identifying tweezer tops and bottoms on crypto charts can be valuable for traders. To spot a tweezer top, look for two consecutive candlesticks with similar high prices, forming a resistance level. This suggests a potential bearish reversal. For tweezer bottoms, observe two consecutive candlesticks with similar low prices that create a support level, indicating a potential bullish reversal.
How to Trade Crypto with Tweezer Patterns
Trading crypto with tweezer patterns involves a systematic approach to analysing potential trend reversals. Here's a step-by-step walkthrough for trading crypto using tweezer patterns:
- Identify Setups: Look for consecutive candlesticks with similar highs (tops) or similar lows (bottoms) on your crypto charts.
- Determine the Trend: A tweezer top in an uptrend reflects a bearish reversal, while a tweezer bottom in a downtrend suggests a potential bullish reversal.
- Set Entry and Exit Points: Once the pattern is confirmed, you may set your entry point slightly below the low of the tweezer top or above the high of the tweezer bottom. Use stop-loss orders to manage risk and define your exit point or take-profit levels using support and resistance levels or technical indicators.
- Combine with Other Indicators: Enhance your trading strategy by combining the setup with other technical indicators, such as moving averages, RSI, or MACD, to gain additional confirmation and improve your overall trading decisions.
- Practice Risk Management: Always implement proper risk management techniques, such as position sizing, to protect your capital. Avoid risking more than a set percentage of your trading account on any single trade.
- Monitor and Adapt: Monitor your trades and adjust your strategy as market conditions change. Be flexible and ready to exit or adjust your position if the price action deviates from your expectations.
Remember, no trading strategy guarantees success. It's essential to practise, analyse your trades, and adapt your approach based on your experience and market conditions. Utilising their skills, traders can leverage the free TickTrader platform to enhance their trading strategies.
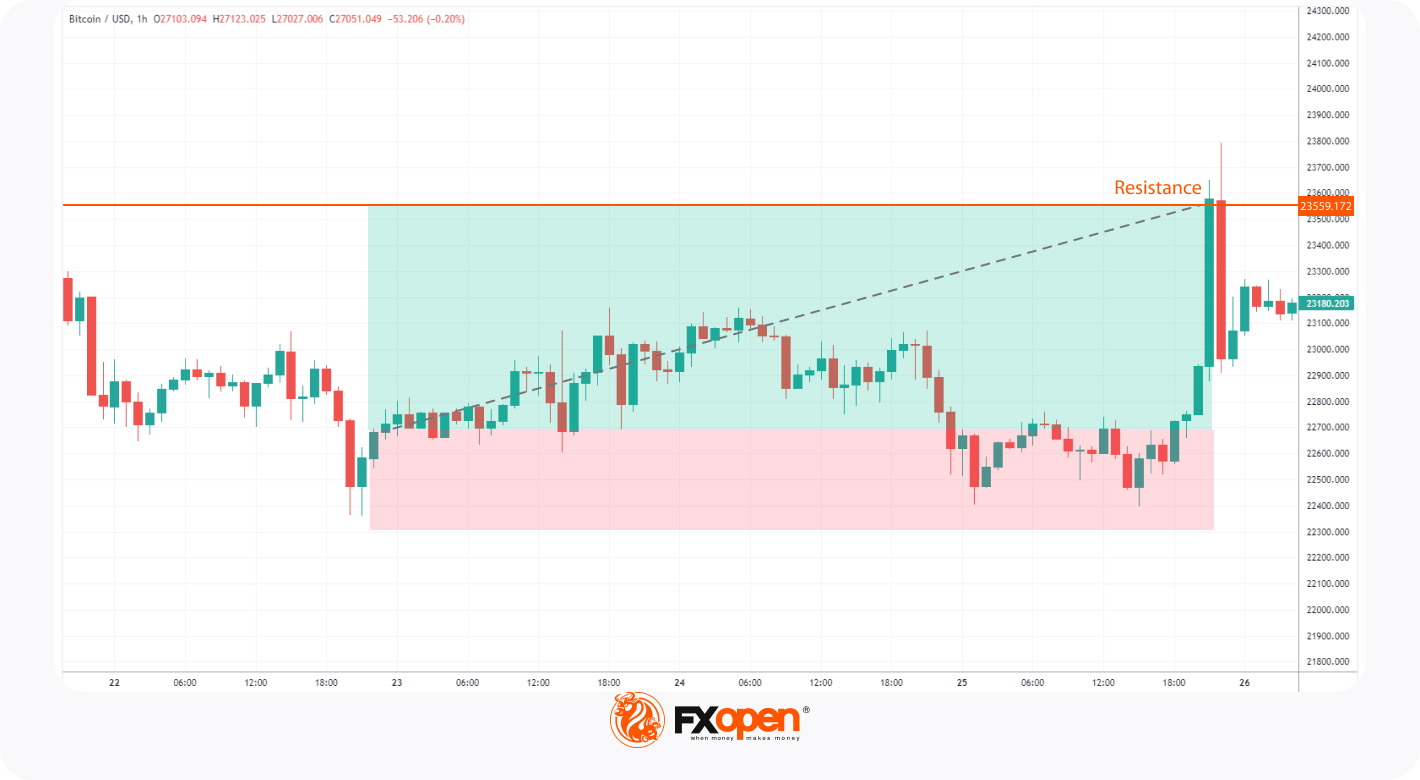
A trader identifies a tweezer bottom on BTCUSD. They place a stop loss just beneath the setup with a take profit at the next resistance level.
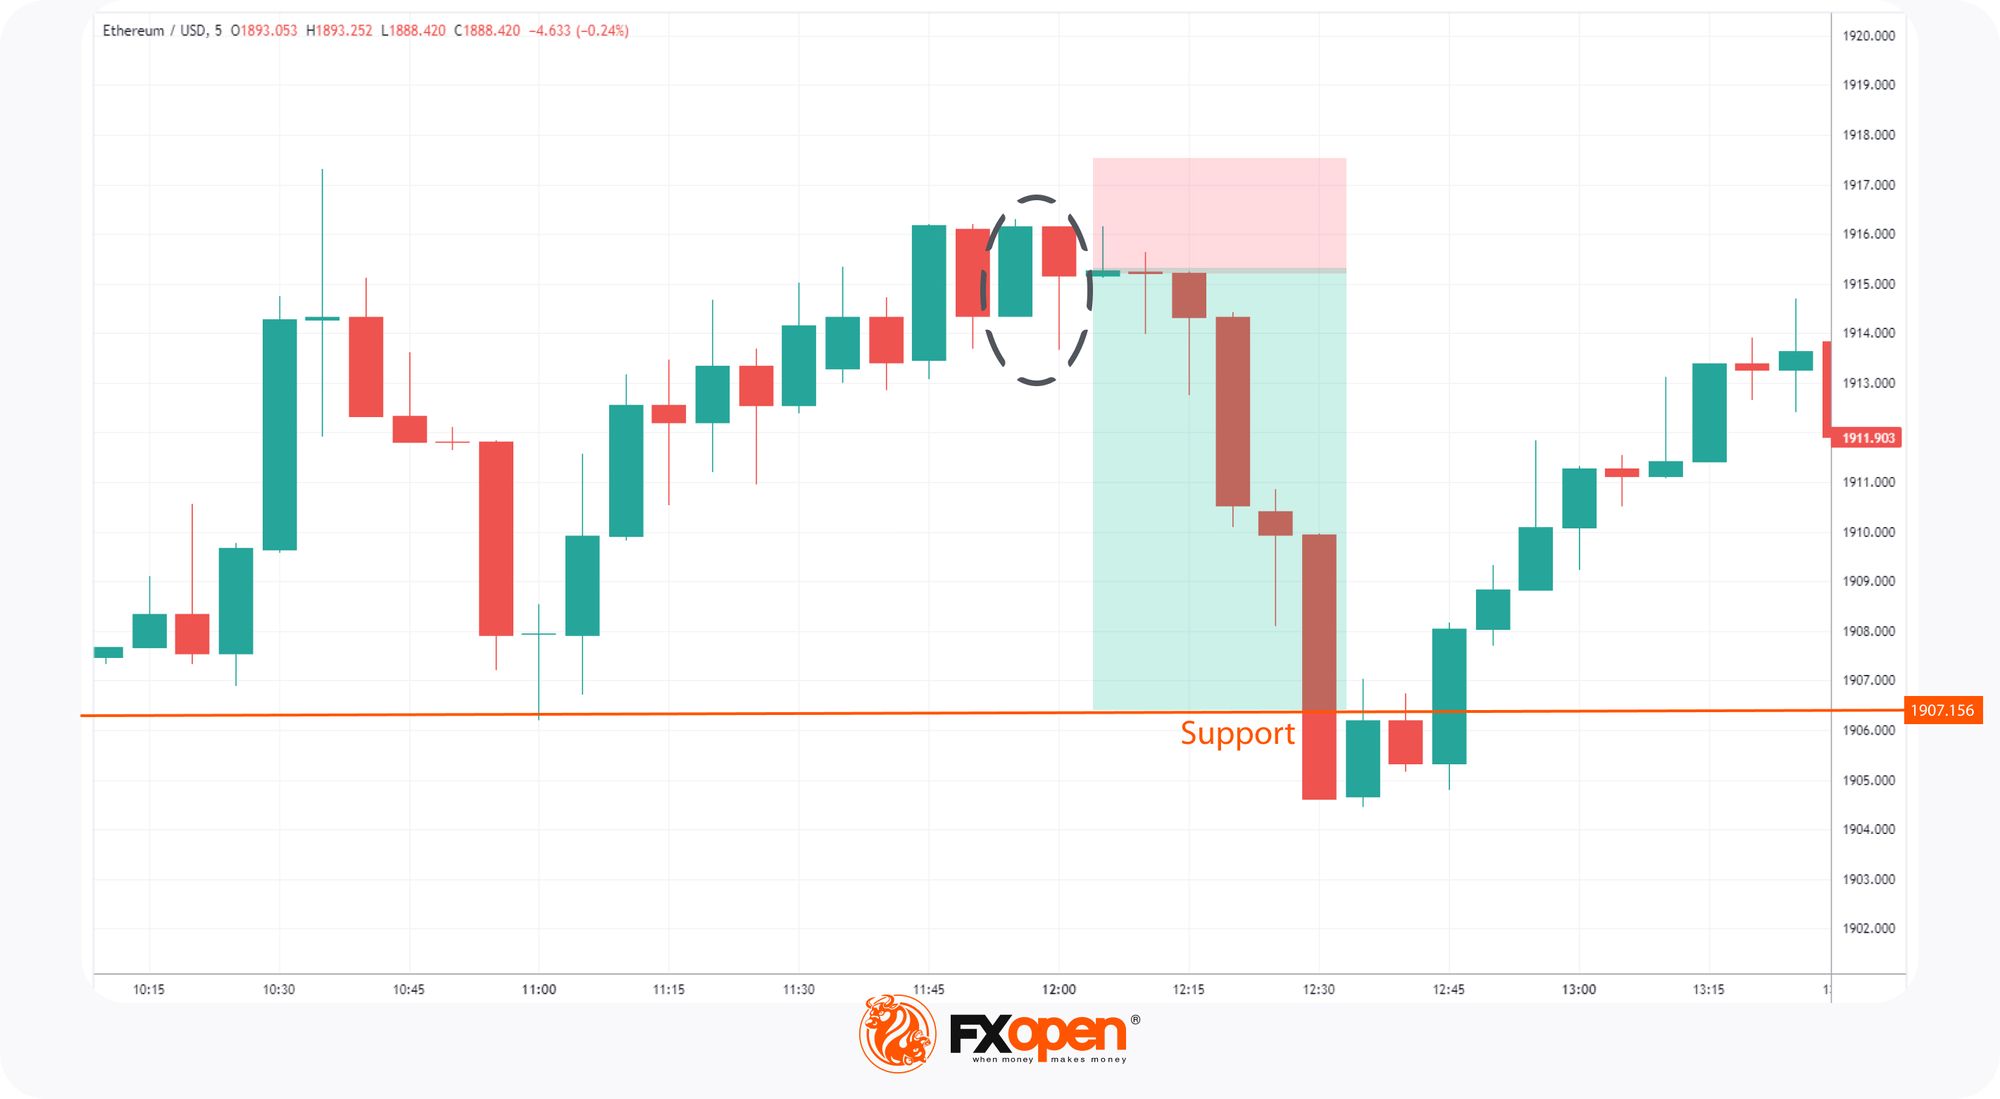
A tweezer top pattern on ETHUSD shows a potential reversal to the downside. On finding the setup, a trader takes a short position just beneath the pattern with a stop loss above the high of the bar. The take profit is the next level of support.
Benefits and Disadvantages of Using Tweezer Top and Bottom Patterns
Using these setups in your trading has several advantages and disadvantages. Let's explore the benefits first:
- Trend Reversal Signals: Tweezer tops and bottoms can indicate potential trend reversals, providing traders with early signals to enter or exit positions.
- Clear Entry and Exit Points: These patterns offer clear entry and exit points, making it easier for traders to set their stop-loss and take-profit levels.
- Versatility: Tweezer patterns can be applied to various financial instruments and timeframes, allowing traders to apply them in different markets.
- Confirmation with Other Indicators: Tweezer patterns can be used together with other technical indicators, providing additional confirmation and improving the accuracy of trading decisions.
The cons are:
- False Signals: Like any trading pattern, the formation is not 100% accurate. Traders may encounter false signals, leading to potential losses if not managed properly.
- Subjectivity: Identifying the setup is subjective, as different traders may have varying opinions on whether a pattern is valid or not.
- Additional Confirmation Required: Relying solely on the setup may not be sufficient. Traders often need to use other technical analysis tools to confirm the validity of the signals.
Tweezer Candles vs Other Reversal Patterns
When comparing the setup to other reversal patterns, such as the Hammer, Shooting Star, and Engulfing patterns, it's important to understand each of their unique characteristics and implications in trading.
Tweezer Top vs Hammer
A tweezer top pattern consists of two consecutive candlesticks with similar highs, indicating a potential bearish reversal, while a Hammer is a single bar with a small body, a long lower wick, and a small or no upper shadow, signalling a bullish reversal. While both patterns suggest a reversal, the bearish tweezer top candlestick emphasises a potential shift in bullish momentum, while the Hammer highlights a potential shift in bearish momentum.
Tweezers vs Shooting Star
Tweezers, whether tops or bottoms, indicate potential trend reversals. In contrast, a Shooting Star is a single bar with a small body and a long upper wick, suggesting a bearish reversal. While both patterns suggest a reversal, tweezers indicate a struggle between buyers and sellers at a specific price level, while the Shooting Star implies a potential rejection of higher prices and a shift towards bearish sentiment.
Tweezer Bottom vs Engulfing Patterns
A bullish tweezer bottom candlestick consists of two consecutive candlesticks, bearish and bullish, with similar lows, signalling a potential bullish reversal. On the other hand, the bullish engulfing pattern occurs when a green bar completely engulfs the previous red candle, indicating a bullish reversal.
Final Thoughts
Enhancing decision-making and identifying profitable trading opportunities requires traders to comprehend the setup's implications within the broader market context and implement effective risk management strategies. Once traders gain confidence in their analysis, they can open an FXOpen account to engage in live market trading.
FAQ
What is a tweezer bottom candlestick?
It is a bullish setup consisting of two consecutive candlesticks with similar lows, indicating a potential shift in market sentiment from bearish to bullish. The first bar is typically bearish, showing selling pressure, while the second is bullish and forms a support level at the same low as the previous candlestick.
What is a tweezer top pattern?
It is a bearish setup consisting of two consecutive candlesticks with identical or similar highs, indicating a potential shift in market sentiment from bullish to bearish. The first bar is typically bullish, showing buying pressure, while the second is bearish and forms a resistance level at the same high as the previous candlestick.
Is a tweezer top bullish or bearish?
A tweezer top is actually considered a bearish reversal pattern. It occurs when two consecutive candlesticks have identical or similar highs, indicating a potential shift in market sentiment from bullish to bearish.
How do you trade a tweezer bottom?
When trading the setup, the theory states the following steps:
- Identify the pattern on the price chart, which consists of two consecutive candlesticks with similar lows.
- Wait for confirmation signals such as an increase in trading volume or the pattern forming at a significant support level.
- Once confirmed, you may consider entering a long position by placing a buy order slightly above the high of the second bullish candlestick.
- Set a stop loss below the low of the pattern to manage risk.
- Determine a profit target by identifying resistance levels or using technical analysis tools.
At FXOpen UK and FXOpen AU, Cryptocurrency CFDs are only available for trading by those clients categorised as Professional clients under FCA Rules and Professional clients under ASIC Rules, respectively. They are not available for trading by Retail clients.
This article represents the opinion of the Companies operating under the FXOpen brand only. It is not to be construed as an offer, solicitation, or recommendation with respect to products and services provided by the Companies operating under the FXOpen brand, nor is it to be considered financial advice.
Stay ahead of the market!
Subscribe now to our mailing list and receive the latest market news and insights delivered directly to your inbox.


Latest articles


Market Insights with Gary Thomson: Oil, US Retail Sales & NFP in Focus
In this video, we’ll explore the key economic events and market trends, shaping the financial landscape. Get ready for insights into financial markets to help you navigate the week ahead. Let’s dive in!
In this episode of Market

Geopolitics Fuels Volatility: AUD/USD and USD/CAD Near Key Levels
Commodity-linked currencies continue to weaken amid rising geopolitical tensions, which are boosting demand for safe-haven assets and increasing volatility across both FX and commodity markets. The US dollar is gaining support from demand for liquid and defensive assets, while currencies