


What Is RSI in Crypto and How to Use the Indicator in Trading?
FXOpen

The relative strength index (RSI) is a highly regarded momentum indicator that’s found significant popularity amongst crypto traders in recent years. In this crypto for RSI explained article, we’ll discuss what the RSI is, how it can be applied to crypto, and offer some strategies.
What Is RSI in Crypto?

The relative strength index (RSI) is a popular momentum oscillator that measures the speed and change of price fluctuations. Developed by J. Welles Wilder Jr. in 1978, RSI is a versatile tool that can be applied across almost all financial markets, including stocks, commodities, forex, and cryptocurrencies.
RSI measures the ratio of average gains to average losses during a specific timeframe, typically over 14 periods. The indicator calculates this by taking the average price change of an asset during the periods it closed higher and dividing it by the average price change during the periods it closed lower. The result is a value that oscillates between 0 and 100.
The formula for RSI is as follows:
RSI = 100 - (100 / (1 + Relative Strength))
Where:
Relative Strength = Average gain / Average loss
Luckily, you don’t need to perform this calculation yourself. At FXOpen, our free TickTrader platform will handle the maths and plot the RSI for you in seconds. There, you’ll also find dozens of additional indicators and tools ready to help you navigate the markets.
Learning how to read the RSI for crypto trading can offer valuable insights into current market conditions, allowing traders to quickly identify overbought or oversold assets, potential trend reversals, and market momentum.
How the RSI in Crypto Differs From the RSI in Other Markets
While the indicator’s application is largely the same across all markets, some notable differences exist when using the relative strength index for cryptocurrency. One of the most significant differences is the heightened volatility typically found in cryptocurrency markets.
This volatility can lead to more frequent and larger price swings, so you may need to adjust the indicator to find the best RSI settings for crypto. You may also need to change readings of the RSI for crypto, meaning changing its overbought and oversold thresholds or increasing the calculation periods.
Crypto markets are often highly reactive and based on sentiment, while other markets, like forex or commodities, tend to be driven by fundamental factors. This is one of the causes of the high volatility mentioned. As a result of this sentiment-led dynamic, RSI may throw up more false signals, leading a trader to believe the market is oversold or overbought when, in reality, it’s just the start of a substantial bullish or bearish push.
What Signals Does the RSI Provide?
RSI signals in crypto can be primarily sorted into two categories: reversal and trend continuation signals. We’ll move on to the specifics shortly, but let’s explore these two categories for now.
RSI can be used to identify potential reversals using both overbought/oversold conditions and divergences. When the indicator reaches extreme levels, it may suggest that an asset is overvalued (overbought) or undervalued (oversold). Meanwhile, divergences occur when the asset’s price movements differ from the RSI's.
Trend continuation is a less popular way to use RSI, but it’s still equally as effective. The RSI features a midpoint (50), and it’s said that moves above the midpoint are bullish, while moves below are bearish. So-called hidden divergences can also provide insight into the continuation of a trend.
Using the RSI Indicator for Cryptocurrency Trading
Let’s examine the four primary ways traders can use the relative strength index for crypto trading.
RSI Oversold/Overbought Crypto Conditions

Overbought and oversold conditions occur when the RSI reaches extreme levels, typically indicating that an asset's price may be ready for a correction or reversal. In traditional markets, RSI levels above 70 are considered overbought, while levels below 30 are oversold. However, due to the heightened volatility in crypto markets, some traders adjust these thresholds to 80 (overbought) and 20 (oversold) for better accuracy.
When the RSI crosses these levels, traders can consider the move as a potential signal for entry or exit points. These reversals tend to have the best chances of success when they line up with a broader trend.
Divergences

Regular divergences are where price and RSI move in opposite directions, suggesting a weakening trend and a potential reversal. As in the RSI crypto chart example above, if price is making higher highs while the RSI forms lower highs, this indicates bearish divergence, signalling a possible downtrend. Conversely, if the price creates lower lows while the RSI shows higher lows, this demonstrates bullish divergence, hinting at an upcoming uptrend.

Similarly, hidden divergences form when price and the RSI move in opposite directions and indicate trend continuation. However, they are effectively the opposite of regular divergences; instead of price creating a higher high and RSI showing a lower high (bearish), price puts in a lower high while RSI shows a higher high. Likewise, a bullish hidden divergence will see price moving up with higher lows while RSI plots lower lows.
While they may seem complicated, spotting both regular and hidden divergences become simple once you know what to look for. Feel free to use these guidelines to spot them for yourself in the free TickTrader platform.
Failure Swings

Failure swings are unique RSI patterns that can help traders confirm potential reversals. A bearish failure swing occurs when the RSI moves above the overbought threshold, dips back down, and then fails to reach the overbought level again before breaching the recent low. This pattern suggests weakening bullish momentum and a possible trend reversal.
A bullish failure swing happens when the RSI falls below the oversold threshold, rises back up, and then fails to reach the oversold level again before climbing above its recent high. This indicates a weakening bearish momentum.
Failure swings are similar to how market structure forms; a potential reversal in price can be confirmed with a new trend forming, shown by consecutive higher highs and higher lows (bullish) or lower highs and lower lows (bearish).
Trend Confirmation
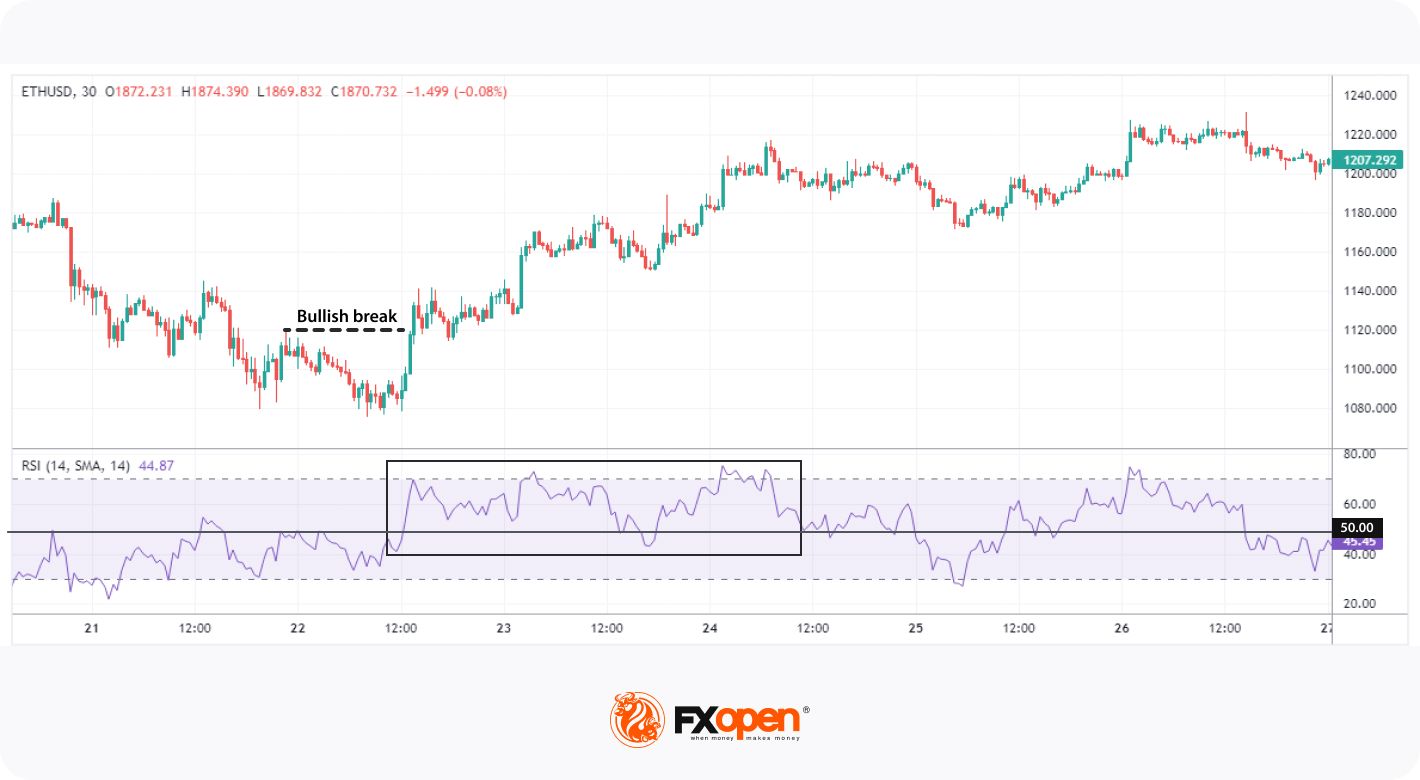
While the primary purpose of RSI is to identify overbought or oversold conditions, it can also be useful for trend confirmation. By observing how the RSI behaves in relation to its midpoint (50), traders can gauge the strength of the overall trend. If the RSI consistently stays above the midpoint, it suggests a strong bullish trend, while if it remains below 50, it demonstrates a strong bearish trend.
It’s important not to use this signal in isolation when looking to determine trends. Instead, traders usually use it as a confirmation tool after highlighting the trend with your own eyes. For example, you may have a bullish bias based on consecutive higher highs and higher lows. Your bias can then be confirmed by observing that RSI has consistently remained above 50.
Recommendations When Using the RSI Indicator for Crypto
When creating your crypto RSI trading strategy, there are a few things to consider before you start using it in live markets.
Combine RSI With Other Technical Tools
While the RSI is certainly one of the more effective indicators, it’s still known to produce false signals, especially during strong trends. Instead, try using RSI with other indicators, such as moving averages, support and resistance levels, or chart patterns, to confirm your analysis. Since RSI is a leading indicator, you could pair it with a lagging indicator, like Bollinger Bands or MACD.
Experiment to Find Your Ideal RSI Crypto Settings
The default RSI setting is typically 14 periods, but you may need to adjust this based on your trading style and chosen timeframe. For example, short-term traders might use a lower period setting, like 9 or 10, for a more responsive RSI, while long-term traders may opt for a higher period setting between 20 and 30 to smooth out fluctuations.
Factor in Crypto Volatility
Due to the increased volatility in cryptocurrency markets, consider adjusting the overbought and oversold thresholds to 80 and 20, respectively. This can help reduce false signals and increase the reliability of the indicator.
The Bottom Line
Overall, understanding RSI for crypto is an excellent next step in your crypto trading journey. It’s an incredibly versatile indicator highly regarded amongst crypto traders, and following this guide should help you better understand how the RSI is best applied.
All of the above are tailored toward crypto, you can read about how to use the relative strength index (RSI) in other financial markets here. Once you develop a strong understanding of how to use RSI effectively, you can open an FXOpen account to gain access to over 600+ markets, the advanced TickTrader platform, and low-cost trading. Good luck!
*At FXOpen UK and FXOpen AU, Cryptocurrency CFDs are only available for trading by those clients categorised as Professional clients under FCA Rules and Professional clients under ASIC Rules, respectively. They are not available for trading by Retail clients.
This article represents the opinion of the Companies operating under the FXOpen brand only. It is not to be construed as an offer, solicitation, or recommendation with respect to products and services provided by the Companies operating under the FXOpen brand, nor is it to be considered financial advice.
Stay ahead of the market!
Subscribe now to our mailing list and receive the latest market news and insights delivered directly to your inbox.


Latest articles

Amazon Analysis: Strong Earnings Coincide with a Breakout from the Correction
On 30 July, Amazon.com reported its financial results for the second quarter of 2026, significantly exceeding market expectations. Revenue rose 20% year-on-year to $200.6 billion, compared with the consensus forecast of around $196.5 billion. The main growth

GBP/USD and EUR/GBP Await Key Bank of England Decision
The pound strengthened following the outcome of the US Federal Reserve meeting, where the central bank, as expected, kept interest rates unchanged. However, the Fed did not provide the market with clear signals of an imminent shift towards rate cuts,

Microsoft Analysis: Earnings Beat Expectations
On 29 July 2026, Microsoft reported its results for the fourth quarter of fiscal year 2026. Revenue reached $90 billion, up 18% year-on-year, while adjusted earnings per share came in at $4.74, comfortably ahead of analysts' expectations of $4.