
What Is a Bullish Harami Pattern in Trading
The bullish harami is a two-candlestick pattern that signals a potential reversal from a downtrend to an uptrend. It can be useful for traders and technical analysts looking to identify buying opportunities. In this article, we will explain how to identify the bullish harami on a price chart and read its signals.
What Is a Bullish Harami Pattern?
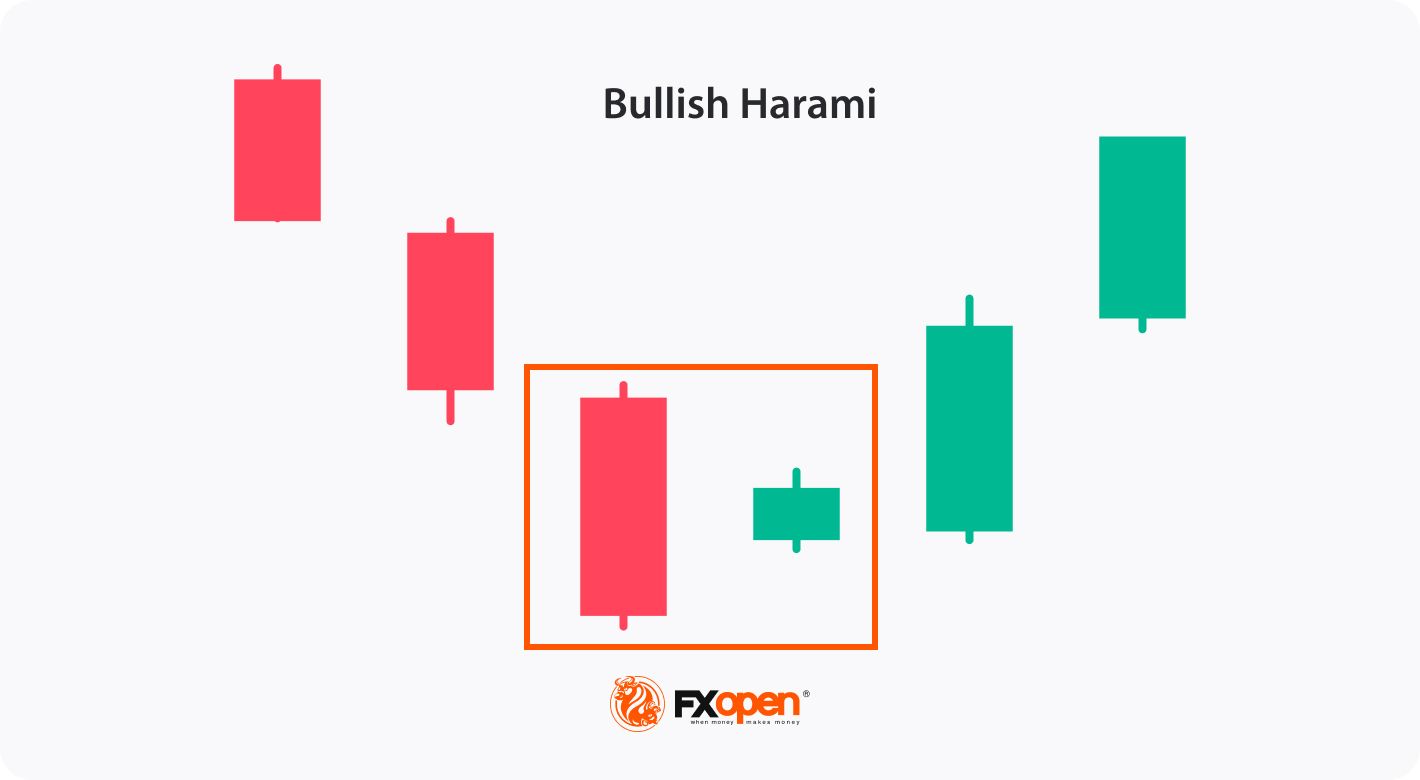
A bullish harami is a candlestick chart pattern that typically signals a potential bullish reversal in the price of an asset. It consists of two candles appearing at the end of a downtrend.
To identify a bullish harami candlestick pattern, traders should look for two candlesticks on a price chart in a solid downtrend. The first candlestick should be a long bearish candle, indicating a downtrend in the market.
The second candle should be small and bullish. Its body and high and low shadows should be entirely contained within the first candlestick. The small green bar represents a potential shift in market sentiment, as the bulls have started to take control and create a support level that the bears were unable to break. The pattern is considered more reliable if the second candle opens with a gap up.
The bullish harami can be observed in any financial instrument, such as stocks, cryptocurrencies*, ETFs, indices, and forex, regardless of the timeframe. FXOpen allows its clients to trade all these instruments via CFDs.
Bullish Harami vs Bearish Harami
As mentioned above, the bullish harami is characterised by a long bearish candlestick, followed by a small green one that is completely engulfed by the former. This formation indicates that the bears are losing control and that the bulls are starting to take charge, potentially leading to a trend reversal from a downtrend to an uptrend.
On the other hand, the bearish harami setup is characterised by a long green candlestick, followed by a small bearish candle that is completely engulfed by the former. This formation suggests that the bulls are losing control, and the bears are starting to take charge, indicating a potential trend reversal from an uptrend to a downtrend.
You can examine how to analyse bull and bear harami setups on charts of different assets and on different timeframes for free using the FXOpen TickTrader platform.
Trading the Bullish Harami Candlestick Pattern
When trading the bullish harami candle pattern, traders usually base their strategies on these general rules:
- Entry: Traders may enter a long position as soon as they spot a formation on a chart. However, it's important to wait for confirmation before entering the trade. Confirmation may come as the next bullish candlestick after the formation or as a break above a resistance level. Entering a trade too early can increase the risk of loss.
- Take Profit: A take-profit level can be set by identifying a potential resistance level. Traders look at previous price actions or use technical analysis tools such as trendlines or Fibonacci retracements.
- Stop Loss: A stop-loss order is a crucial risk management tool and may be placed below the low of the bearish candle. This helps limit potential losses if the setup fails to play out as expected.
Live Market Example
A trader finds a bullish harami setup on the Alibaba chart. The proceeding candle provides additional confluence on market indecisiveness to continue its bear trend, acting as a bullish harami pattern confirmation. The stop loss is placed below the setup with the take profit towards the following resistance line.
Final Thoughts
While the bullish harami pattern can be helpful in identifying potential trend reversals, traders never rely solely on it when making trading decisions. It's crucial to incorporate technical indicators and risk management strategies to minimise potential losses. Additionally, traders must be mindful of false signals and adjust their trading strategies accordingly to increase their chances of success. Once you feel confident in your strategy, you can open an FXOpen account and apply it to live trading.
FAQ
What is a bullish harami pattern?
It is a candlestick chart formation that indicates a potential reversal from a down to an uptrend. It consists of a small green candle contained within the previous bearish candlestick. The small one suggests indecision, while the larger one indicates selling pressure. When other technical indicators confirm the setup, it can be used as a signal to enter a long position in the market.
How do you trade bullish harami?
To trade the formation, you first need to find a solid downtrend. Then, there should be a small green candle that is contained within the previous bearish candlestick at the bottom. Once the setup is identified, traders usually confirm it with other technical indicators and price analysis. If the pattern is confirmed, you may enter a long position by buying the asset at the current market price. Traders may place a stop-loss order below the low of the bearish candle and take profits once the price reaches the target (support or resistance level) or use trailing stops to lock in profits as the price continues to rise.
Is the bullish harami pattern reliable?
The bullish harami is considered to be a reliable setup for identifying potential trend reversal from down to up. However, like all technical analysis patterns, it can’t provide 100% accurate signals, so traders confirm it with technical indicators or other patterns before making a trading decision.
What is a bearish harami pattern?
A bearish harami is a candlestick chart formation, appearing when a small falling candle (the "harami" or "inside" candle) is contained within the larger rising candlestick. The setup suggests that the market momentum is shifting from bullish to bearish, as the small candle indicates indecision. It is important to note that the setup is not always reliable and should be confirmed by other technical indicators or price analysis before making any trading decisions.
*At FXOpen UK and FXOpen AU, Cryptocurrency CFDs are only available for trading by those clients categorised as Professional clients under FCA Rules and Professional clients under ASIC Rules, respectively. They are not available for trading by Retail clients.