


Fibonacci Retracements in Action: Practical Applications for Traders
FXOpen
If you’re wondering how to trade with Fibonacci retracements, you’re in the right place. In this article, we will break down why traders use retracements, their unique features, and how you can apply them in your trading strategies. Keep reading to learn about Fibonacci trading.
The Fibonacci Sequence for Trading
Fibonacci retracements are well-known tools used by traders of any level of experience. You may have never heard of Fibonacci Circles, Fibonacci Arcs, or a Fibonacci Spiral, but you have heard of retracements.
Fibonacci retracements make use of the Fibonacci sequence and the resulting Golden Ratio. Simply put, the Fibonacci sequence is a mathematical concept that starts at 0, then 1, with each following number being the sum of the previous two. It goes 0, 1, 1, 2, 3, 5, 8, 13, 21, 34, etc.
The key concept here is the relationship between the numbers in the Fibonacci sequence. For instance, dividing one number by the next, like 13 divided by 21, gives you a value close to 0.618, known as the Golden Ratio. Specifically, 13 divided by 21 equals approximately 0.619. As the sequence progresses, this ratio consistently approaches 0.618. There are other calculations that yield related ratios like 0.236, 0.382, and 0.786.
Traders typically focus on the 0.236, 0.382 and 0.618 ratios, as these are considered significant in market analysis. Additionally, the 0.5 level is frequently used, even though it isn't a true Fibonacci ratio. When applying Fibonacci tools in trading, these ratios are usually represented as percentages: 23.6%, 38.2%, 50%, and 61.8%.
While these ratios are most often applied to Fibonacci retracements, there are actually quite a few ways to use them. The Fibonacci ratios are also fundamental to harmonic pattern trading. The ABCD, Gartley, Crab, and Bat patterns, amongst others, all use Fibonacci retracements and extensions. Once you get the hang of these levels, learning these patterns could be an excellent next step in developing your Fibonacci skills.
What Are Fibonacci Retracements?
Fibonacci retracements, often referred to simply as “fibs,” help traders identify potential support and resistance levels in the market. These levels are derived from the Fibonacci sequence and the associated Golden Ratio described earlier, which reflects naturally occurring patterns found in nature, art, and mathematics.
When applied to trading, Fibonacci retracements are used to determine price levels where an asset might experience a reversal or pause in its current trend. Traders typically apply the Fib retracement tool in trending markets, drawing retracement lines between a significant swing high and a swing low.
The key Fib retracement levels, represented as percentages—38.2%, 50%, and 61.8%—highlight potential zones where the price might retrace before continuing in the direction of the original trend. The 61.8% level, in particular, is often referred to as the "Golden Ratio" in trading, and it’s closely watched as a strong potential reversal point.
Fibonacci retracements are not exact predictors but rather guideposts that suggest areas of interest. Traders often combine these levels with other indicators and chart patterns to increase the reliability of their analysis. By providing a framework for anticipating potential market movements, Fibonacci retracements offer traders a valuable tool for planning entry and exit points, setting stop losses, and identifying target prices. There is no best timeframe for Fibonacci retracements. They can be used on all timeframes.
Using Fibonacci Retracements for Trading
Getting to grips with the Fibonacci retracement tool is easy. There are just two key rules to remember:
- If you’re looking for support levels, set the first point at a significant swing low and the second at a significant swing high.
- If you’re looking for resistance levels, set the first point at a significant swing high and the second at a significant swing low.
Let’s take a look at a few examples. If you’d like to try your hand at using Fibonacci retracements, use the TickTrader trading platform by FXOpen. Gain access to live charts of over 600 trading instruments, use the built-in Fibonacci retracement tool, and enjoy trading with tight spreads and high-speed trade execution.
AUD/USD
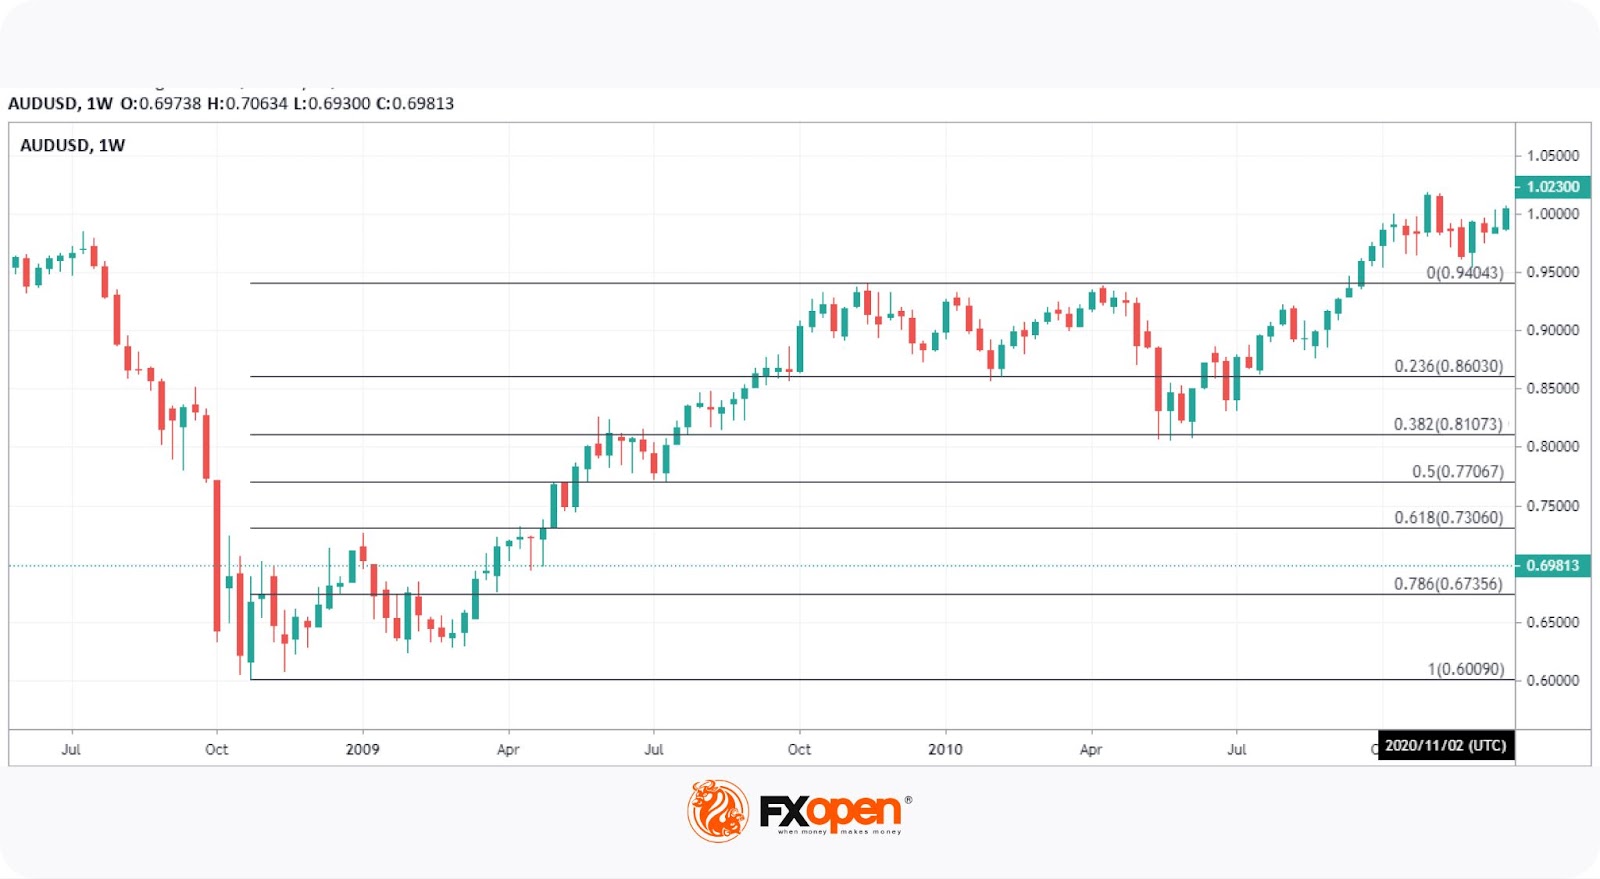
On the weekly chart of the AUD/USD pair, the price formed swing high and low points. Notice that, upon touching the 38.2% area, the price attempted to close below but was rejected three times, giving us three long wicks. This rejection was an opportunity for traders to identify that further bullishness was inbound, which could’ve influenced their lower timeframe decision-making.
XBR/USD
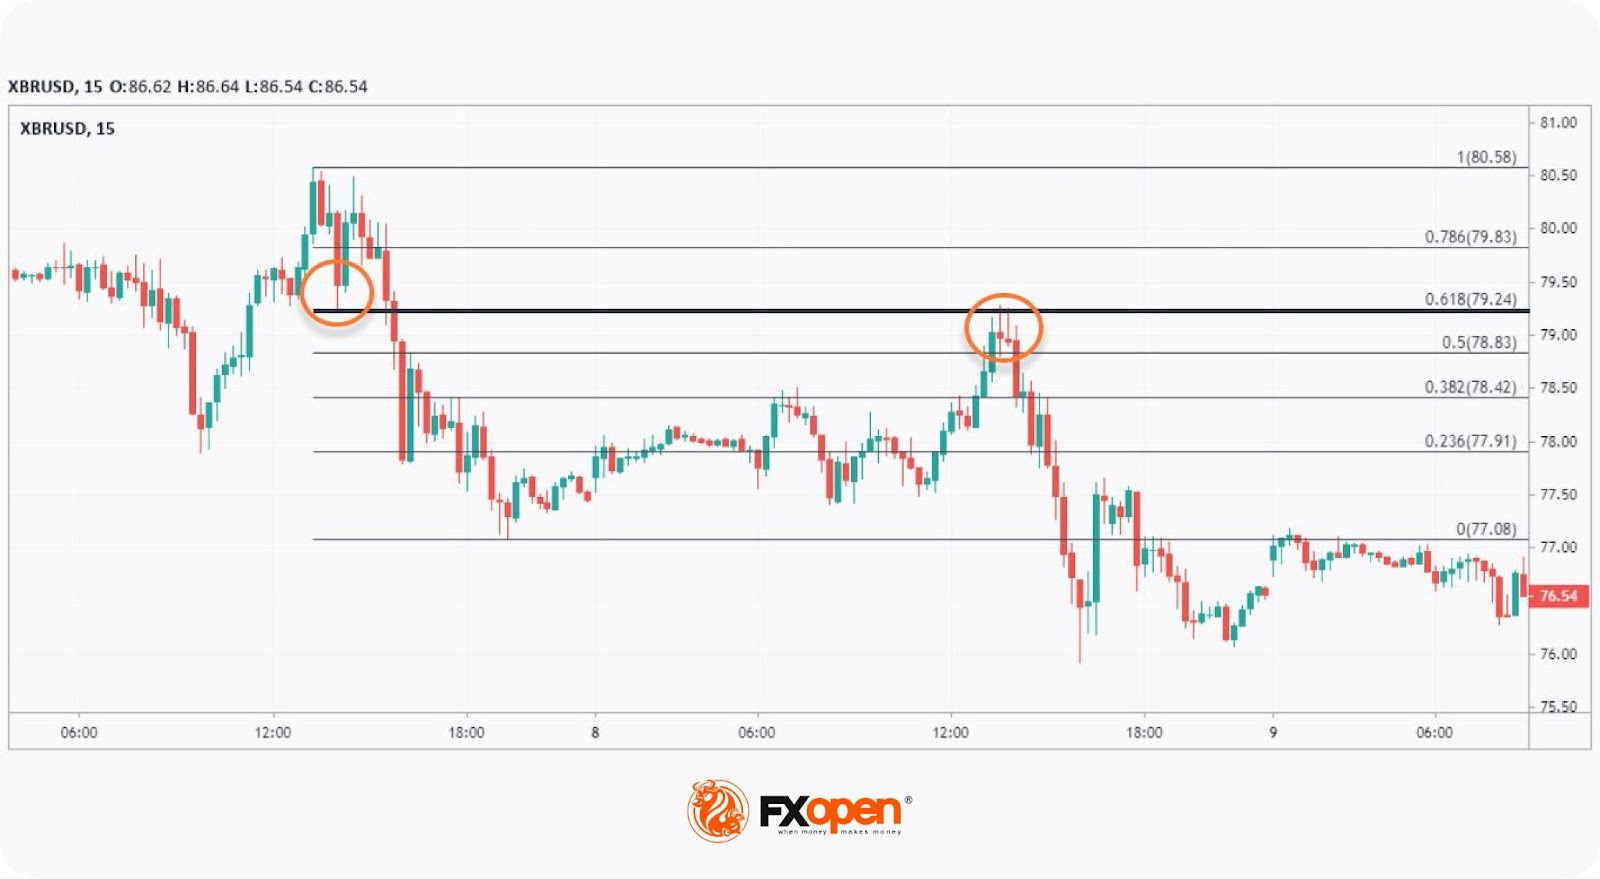
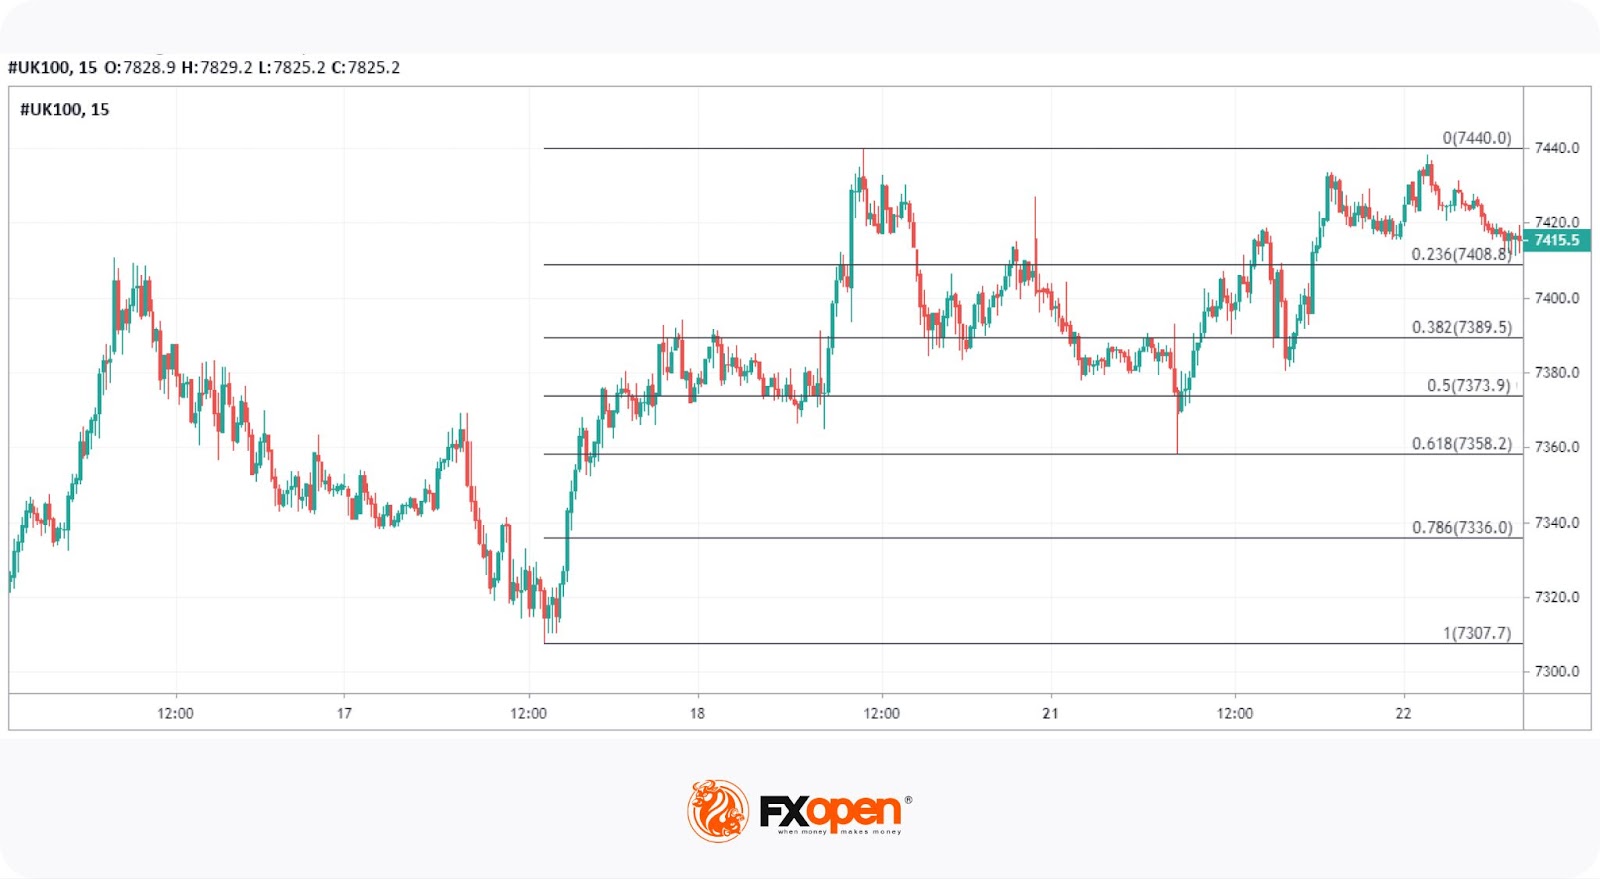
In this example, Brent Crude Oil showed signs of bearishness on the 15-minute chart, breaking support and making a lower low. The 61.8% area posed significant resistance. Two bearish candles with long upper shadows indicated that the price would move lower. Additionally, this area also lined up with a level of support-turned-resistance at 61.8%, giving traders extra confirmation that bearish sentiment would hold.
GBP/USD
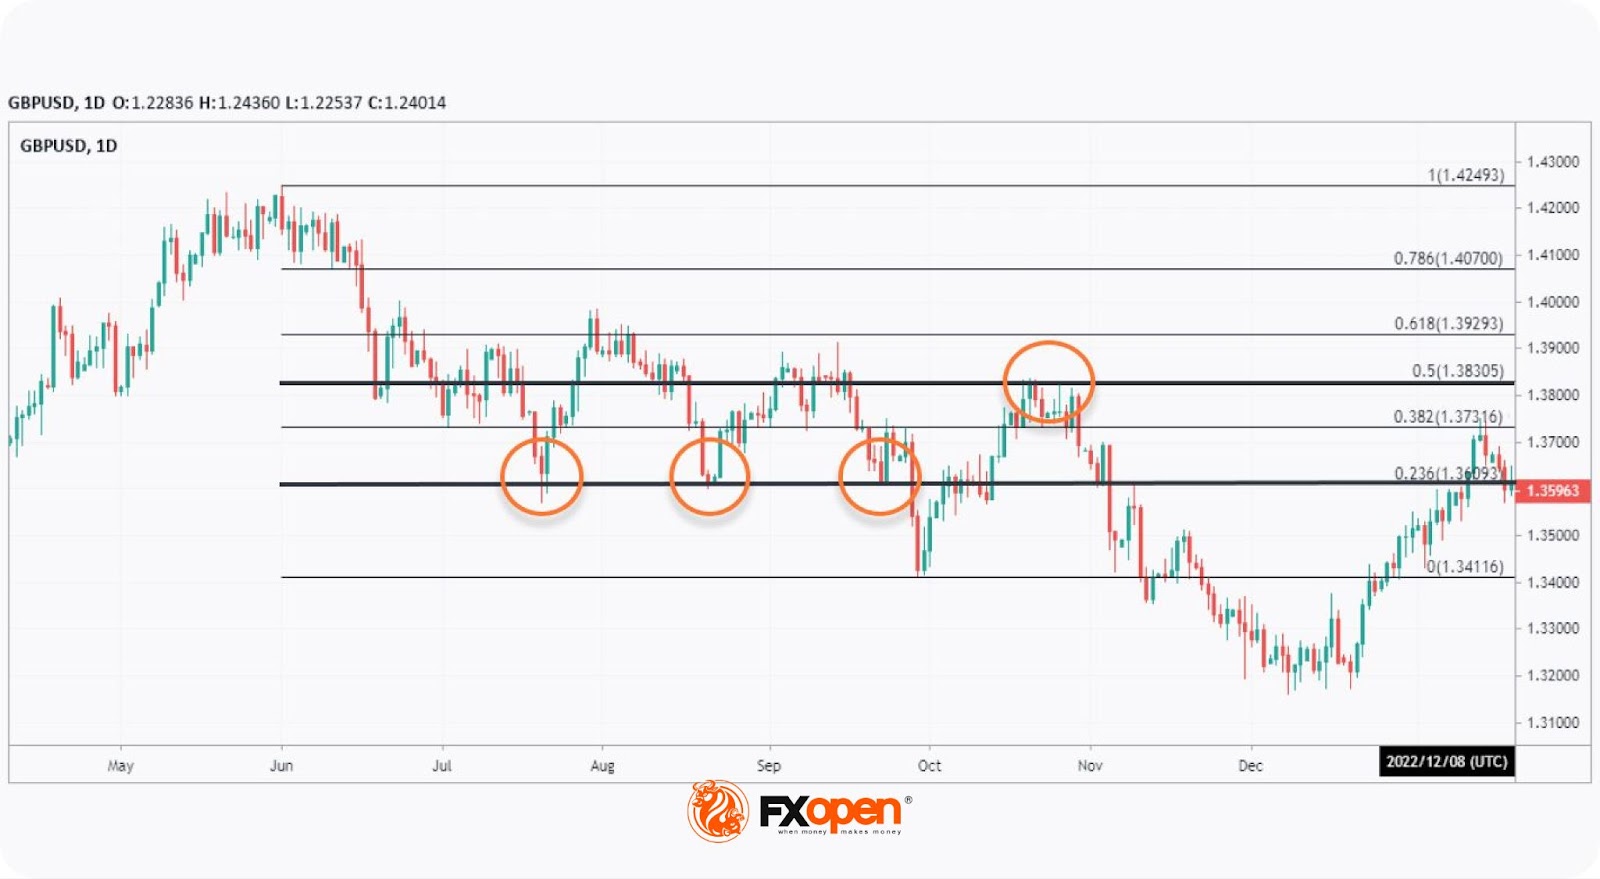
In the chart above, GBP/USD struggled to maintain any bullishness on the daily chart, continually making lower highs and lower lows. By using the most extreme swing low, we can see that a retracement to the 50% area gave traders a chance to get in shortly before a further breakdown.
How Trader Confirm Fib Retracement Signals
Fibonacci retracement levels are valuable tools for identifying potential reversal points in the market, but relying solely on them can be risky. To increase the accuracy of your trades, you need to confirm these signals with additional indicators and techniques. Here’s how to strengthen your analysis:
- Candlestick Patterns: Traders often look for specific candlestick patterns, such as hammers, shooting stars, or engulfing patterns, at or near Fibonacci levels. These patterns can provide clues about market sentiment and potential reversals, adding weight to the retracement signal.
- Moving Averages: It’s useful to check if the Fibonacci levels align with significant moving averages, like the 50- or 200-period. When these levels coincide with a major moving average, it’s often a stronger support or resistance zone.
- Divergence with Oscillators: Momentum indicators can be used to spot divergences. If the price is approaching a Fibonacci retracement level while the indicator shows divergence, it could signal a weakening trend and increase the likelihood of a reversal.
- Volume Analysis: Trading volume at Fibonacci levels can also offer some insights. A retracement accompanied by low volume might indicate a lack of conviction in the move, while a bounce or reversal with increased volume can confirm the strength of the signal.
How Can You Set Entry and Exit Points with Fib Levels?
Fibonacci retracements offer traders a systematic way to determine entry and exit points. Visit our dedicated Fibonacci retracement strategies article to learn more.
Identifying Optimal Entry Points
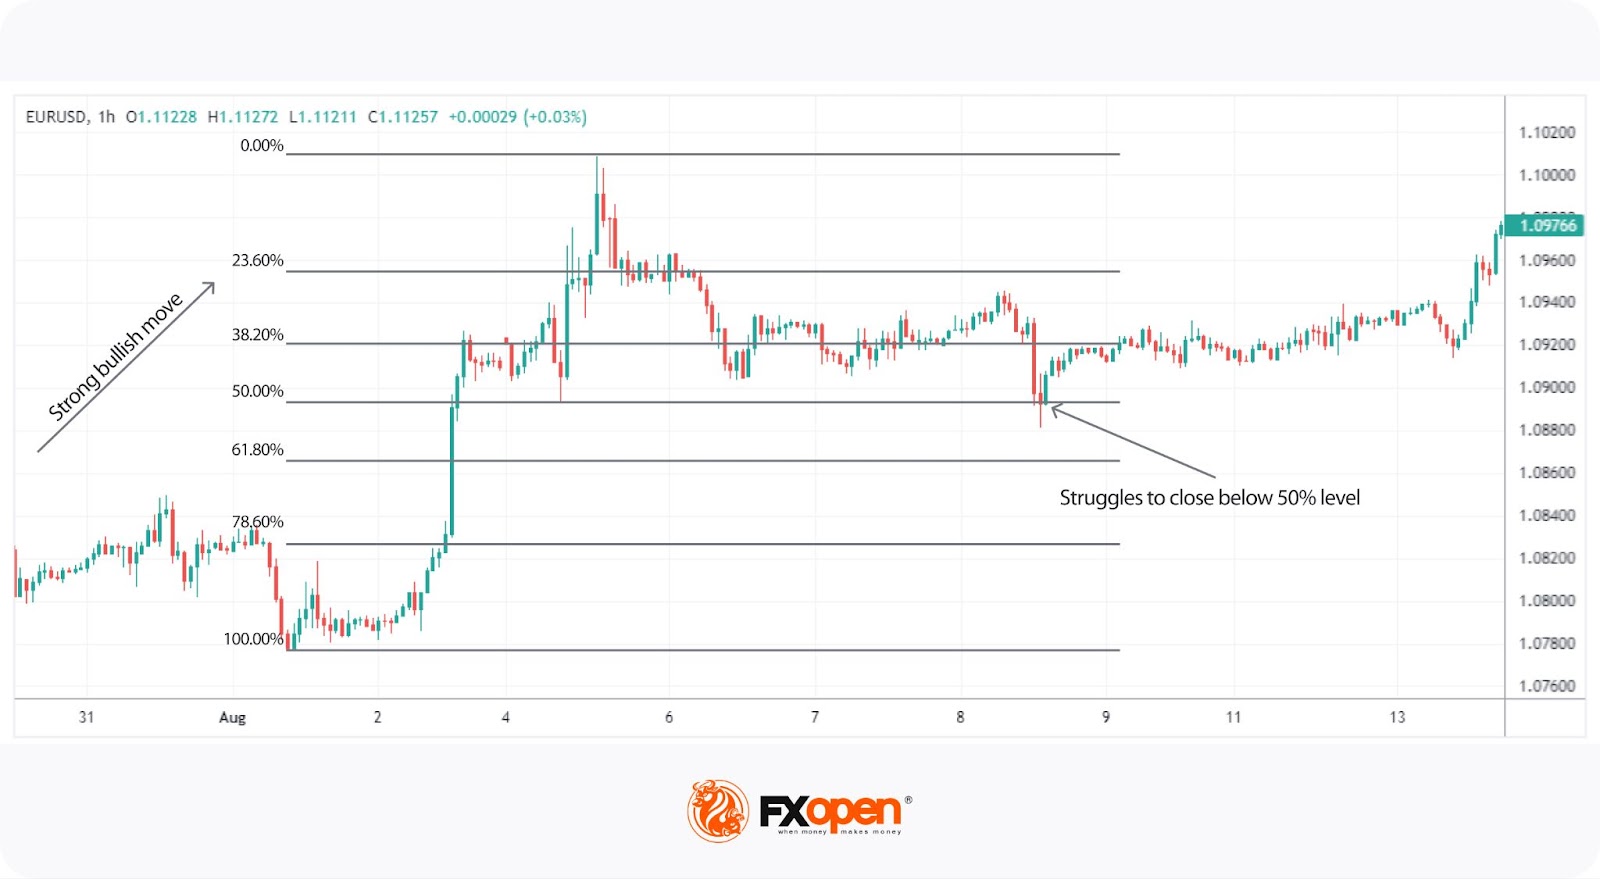
Optimal entry points often align with key Fibonacci levels, particularly 38.2%, 50%, and 61.8%. When the price pulls back to these levels after a significant move, it presents a potential opportunity to enter a trade in the direction of the prevailing trend.
Traders watch for price reactions at these levels—such as hesitation or reversal patterns—to gauge the best moment to enter. For example, a bullish candlestick formation at the 61.8% retracement in an uptrend could signal a strong buying opportunity.
Determining Exit Points with Precision
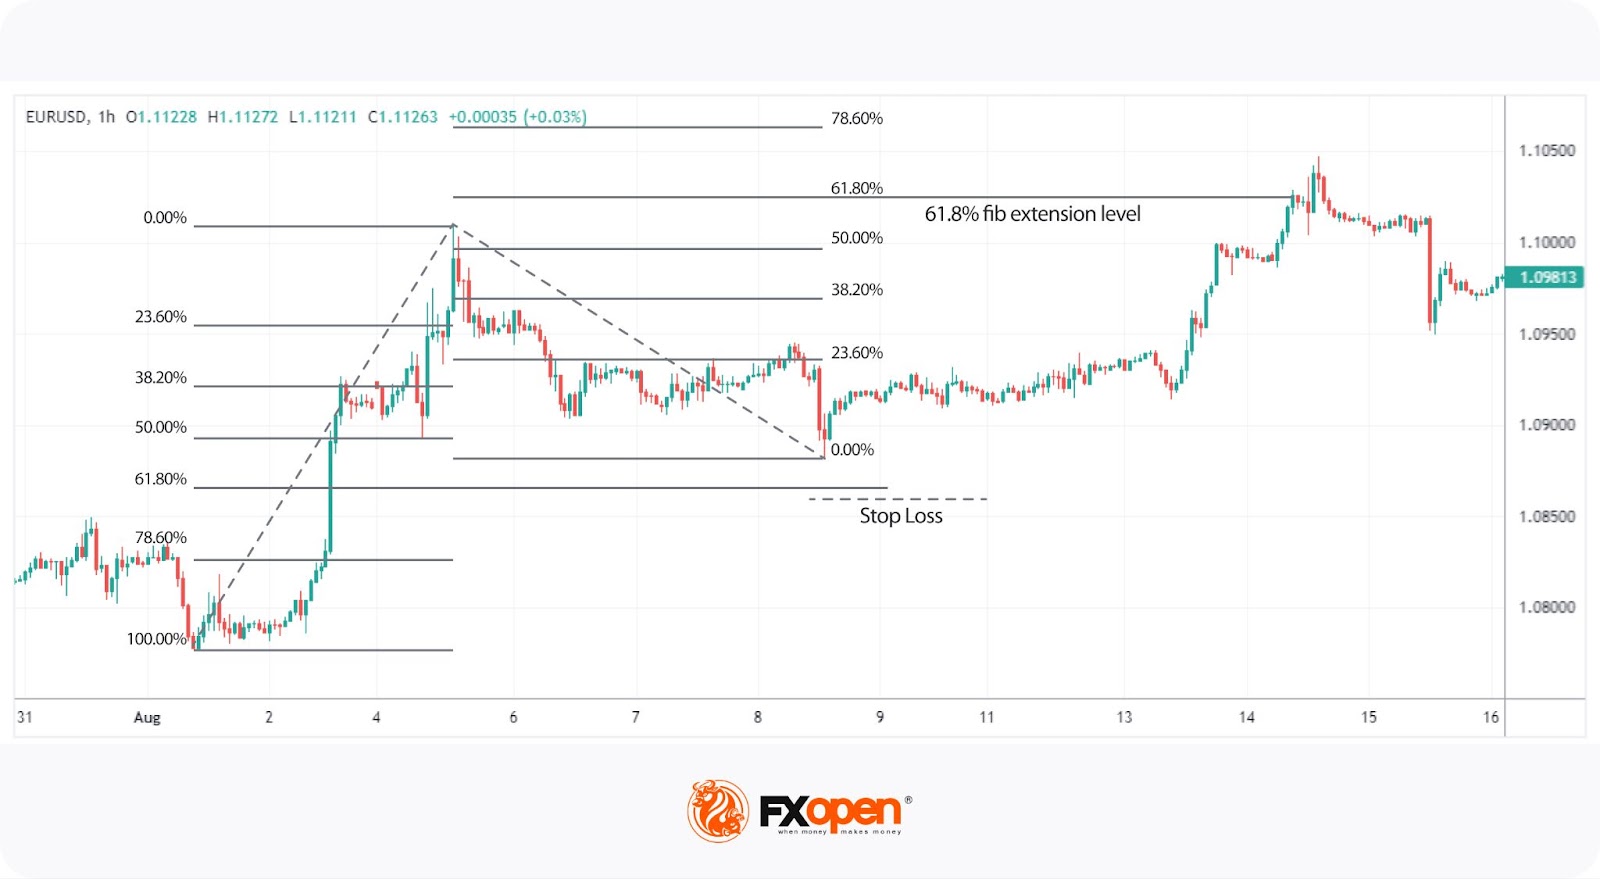
Exits are equally critical. Stop losses are typically set just beyond a key Fibonacci level, usually the one that the trader enters at but possibly the next level.
Profit targets are also usually aligned with key Fibonacci levels. A trader might place a target at the 61.8% level, anticipating that the price will struggle to break through this significant resistance or support area.
They can also be identified using Fibonacci extensions, which project potential reversal levels beyond the original swing. After entering a trade at a retracement level, traders often look to Fibonacci extension levels to set profit targets. These extensions reflect the potential distance a price might move following a retracement.
What Can Help You Use Fibonacci Retracements Effectively
Despite their simplicity, there are a few nuances to learn that can help you when trading with Fibonacci retracements.
They’re Not a Silver Bullet
Fib retracements are a useful tool, but they aren't foolproof. Relying solely on them without considering other indicators or market conditions can lead to poor decisions. Always combine Fibonacci levels with other technical tools and keep the broader market context in mind to enhance accuracy.
Evaluate the Price Behaviour
To ascertain whether an area is holding, traders will typically look at the strength of the reaction from the retracement level. If the price is continually rejected and seems to be struggling, it’s more likely to rebound from the retracement level.
Be Aware of Higher Timeframe Trends
According to the theory, it’s the best practice to align your trades with the dominant trend on higher timeframes. Higher timeframe trends provide a clearer picture of the market's direction and help you filter out noise from lower timeframes. Always consider these trends when using Fibonacci retracements to ensure your trades are in sync with the overall market movement.
Takeaway
Fibonacci retracements are a powerful tool for identifying key market levels and refining your trading strategy. With an understanding of how to use the Fib retracement tool, you can build a more robust approach to trading. Ready to apply these insights to real markets? Open an FXOpen account today and gain access to advanced trading tools, live charts, and over 600 trading instruments, all with competitive spreads and high-speed execution.
FAQ
What Is a Fibonacci Retracement Tool?
Fibonacci retracements are a popular technical analysis tool that helps traders identify potential support and resistance levels based on key ratios derived from the Fibonacci sequence. These levels are used to determine where an asset's price might retrace before continuing in the direction of the trend.
How Do Fibonacci Retracements Work?
Fibonacci retracements work by plotting horizontal lines at specific percentages of a price movement—typically 23.6%, 38.2%, 50%, 61.8%, and 78.6%. These levels suggest where a market correction might occur, offering insights into possible entry and exit points.
How Can You Set Up a Fibonacci Retracement Tool?
Setting up Fibonacci retracement levels involves identifying a significant price swing on a chart. From there, the tool is applied by marking significant swing low and high in an uptrend and significant swing high and low in a downtrend. The key Fibonacci levels are automatically plotted, helping traders spot potential reversal areas.
How To Use the Fibonacci Retracement Tool?
The Fibonacci retracements are used to anticipate where a price might pull back during a trend. Traders draw the retracement lines between the highest and lowest points of a significant move, then watch for price action near the Fibonacci levels to make trading decisions.
Why Is 61.8 a Golden Ratio?
The 61.8% level is known as the Golden Ratio because it frequently appears in nature, mathematics, and art. When applying Fibonacci numbers to trading, this ratio represents a key retracement level, often viewed as a strong indicator of potential support or resistance.
This article represents the opinion of the Companies operating under the FXOpen brand only. It is not to be construed as an offer, solicitation, or recommendation with respect to products and services provided by the Companies operating under the FXOpen brand, nor is it to be considered financial advice.
Stay ahead of the market!
Subscribe now to our mailing list and receive the latest market news and insights delivered directly to your inbox.


Latest articles

GBP/CHF: Trendline or RSI — Which One Is Lying?
Sterling enters this week on firmer footing, with political uncertainty fading fast after Andy Burnham's confirmation as Labour leader eased investor concerns over the succession to Keir Starmer. Markets reacted further to reports pointing to Shabana Mahmood as the frontrunner

Silver Attempts to Break Out of Its Range
Silver continues to balance between its dual role as an industrial metal and so-called refuge asset, and this combination largely explains the lack of a clear trend in recent weeks. Shifting expectations for central bank interest rates can influence the

Nasdaq 100: Is This the Correction Traders Have Been Waiting For?
The Nasdaq 100 (US Tech 100 Mini on FXOpen) remains caught between two opposing forces: cooling inflation on one side, and persistent geopolitical instability on the other. On 14 July, June's CPI print came in softer than expected, easing near-term