


What Is a Chop Zone Indicator?
FXOpen
The Chop Zone indicator serves as an intuitive tool for traders. Using a distinct colour-coded system, it provides instant insights into market momentum, offering an at-a-glance view of trends and reversals. This article delves into its intricacies and how to take advantage of its signals.
What Is a Chop Zone in Trading?
So what is a Chop Zone indicator? A staple in various trading platforms, including FXOpen’s native TickTrader platform, it’s a technical tool used by traders to gauge the momentum and strength of the market. Developed as a visual representation of market conditions, the Chop Zone indicator provides traders with an easy-to-understand, colour-coded system.
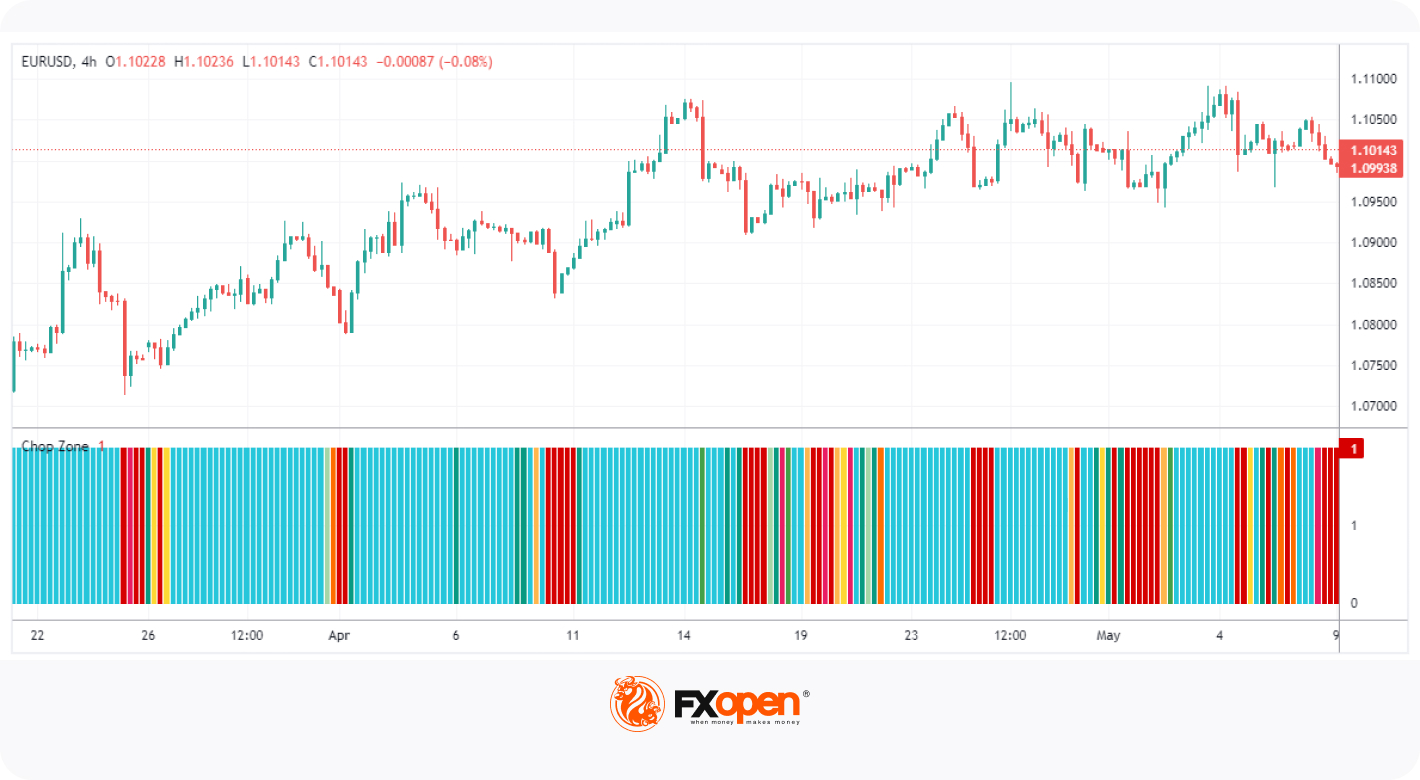
The system primarily utilises three colours: turquoise, red, and yellow. Each colour signifies a specific market sentiment, thereby offering traders a quick glance at the current momentum. For instance, the change from red to turquoise or vice versa can indicate possible reversals or shifts in direction. Meanwhile, yellow often represents neutral or undecided market conditions.
In essence, the Chop Zone analyses recent price action and volatility to generate its colour-coded output. The value of this indicator lies in its ability to offer real-time insights without delving into complex chart analysis. While its simplicity is an advantage, traders often combine the Chop Zone indicator with other tools to ensure comprehensive market analysis.
What Colours in the Chop Zone Mean
The Chop Zone uses a detailed colour system to illustrate market conditions. Each shade offers insights into an asset's momentum and likely direction.
- Turquoise: Representing bullish trends, turquoise appears when an asset shows an upward movement, implying potential future growth. Varying green shades, which may precede the turquoise, also hint at bullishness.
- Yellow/Orange: Indicative of choppiness or consolidation, this hue suggests the asset is moving sideways. It signals uncertainty or potential breakout anticipation.
- Red: Denoting sell-offs, the red intensity in the Chop Zone indicates bearish momentum. A deeper red suggests a stronger sell-off, while lighter shades can signify weakening bearishness.
How To Use the Chop Zone Indicator
Mastering the application of the Chop Zone indicator can enhance your decision-making process. After understanding what the Chop Zone indicator is and the meanings behind its distinct colour cues, we can now delve into its practical usage.
Interpreting Market Trends
Utilise the colour cues in the Chop Zone indicator to identify market trends.
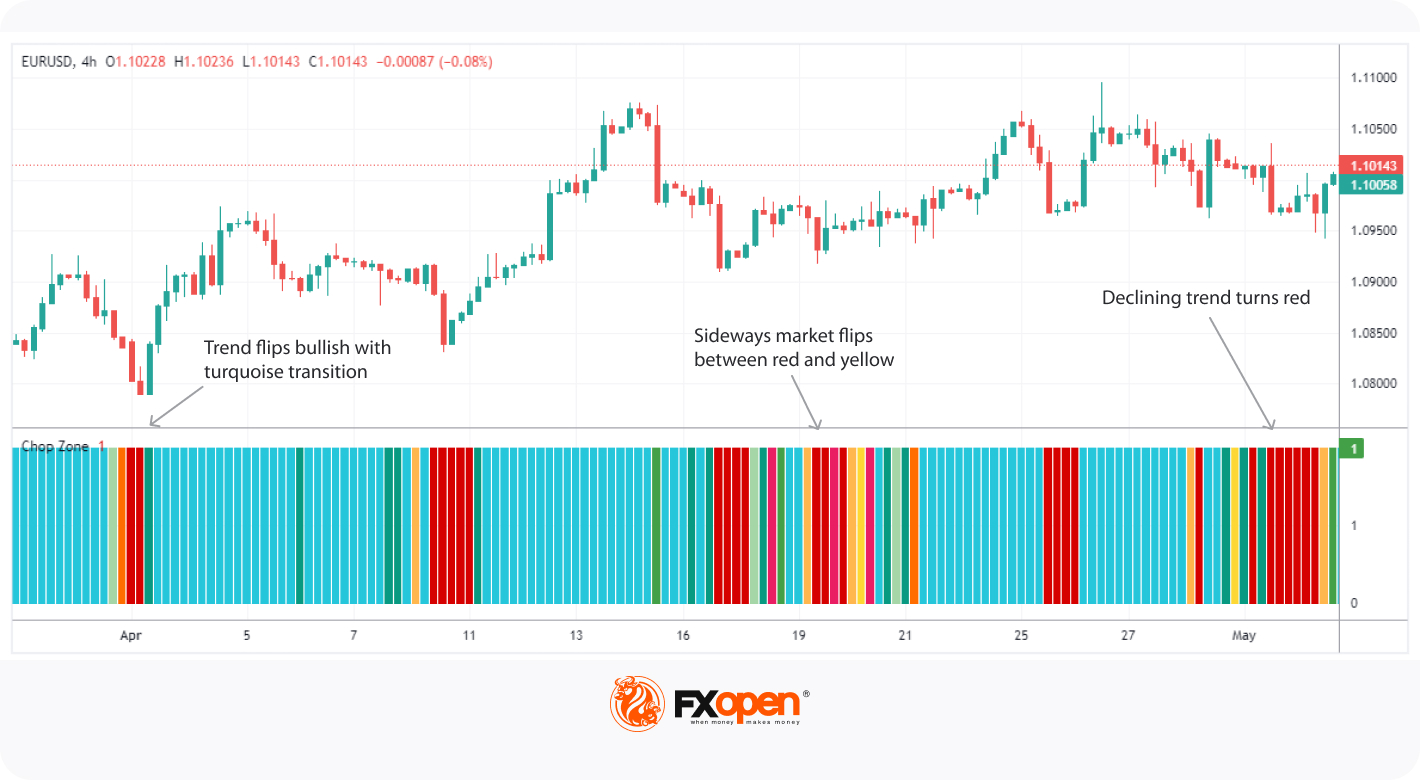
- Bullish Trend: Notice a transition from shades of green or yellow to turquoise? This indicates the possibility of an upward momentum or bullish trend, suggesting that traders may consider entering a long position or holding onto current assets expecting price growth.
- Bearish Trend: In contrast, the presence of red, especially deepening shades, signals a potential downward movement or bearish trend. Traders might view this as a signal to sell or short-sell their assets.
- Consolidation Phase: If the indicator shows a yellow/orange colour, it suggests the asset is moving sideways or consolidating, indicating a lack of a clear directional trend. In this phase, traders may choose to wait for a clearer signal before making a decision.
Combination with Other Indicators
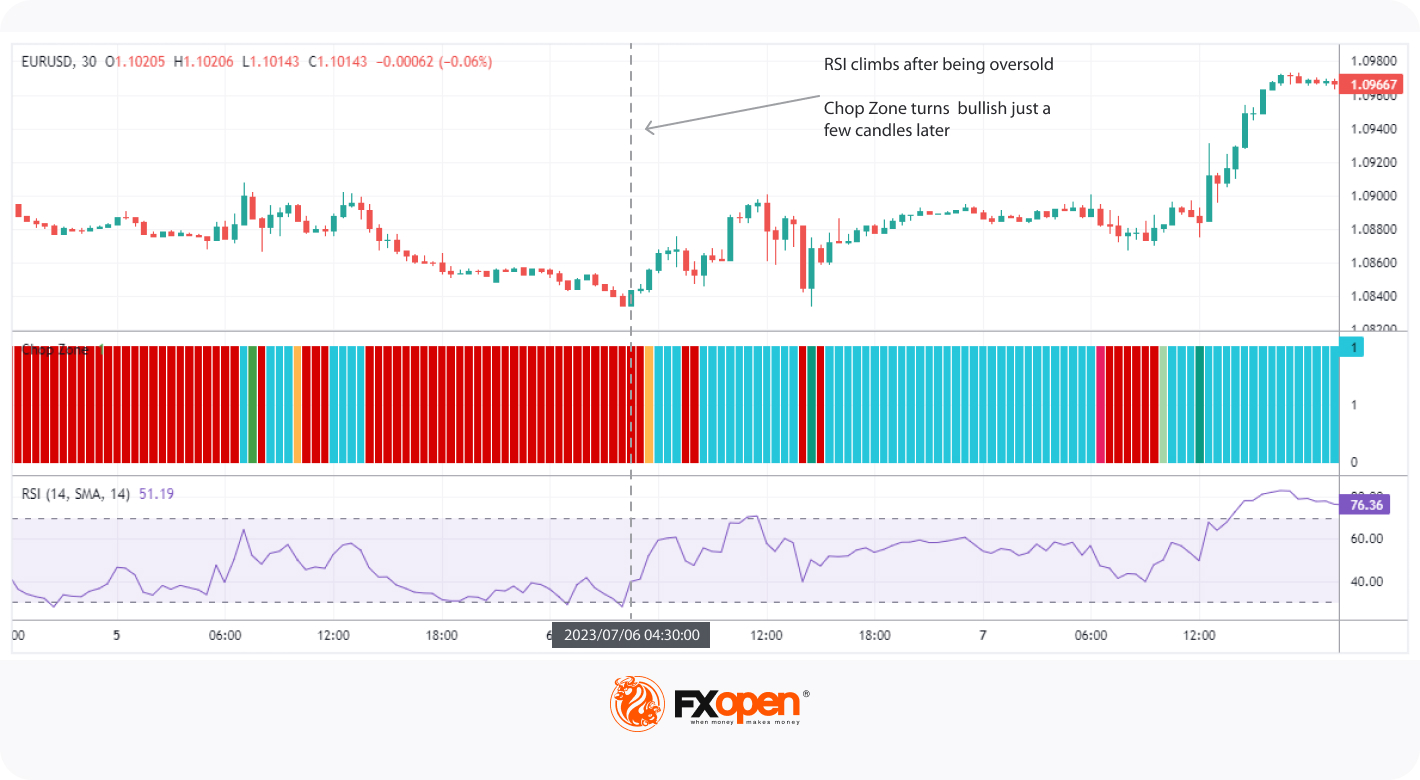
Given that trading strategies should not rely solely on one tool, combining the Chop Zone with other technical analysis tools can provide more comprehensive insights. For example, adding trend lines or moving averages can help add confluence to a trend, while oscillators like the Relative Strength Index (RSI) can help identify overbought or oversold conditions, with the Chop Zone acting as a confirmation tool.
Chop Zone vs Choppiness Index
The trading world boasts a plethora of technical tools, and while some may sound similar, they can serve different purposes or offer varying insights. Such is the case with the Chop Zone and the Choppiness Index.
Choppiness Index Overview
The Choppiness Index, unlike its name might suggest, does not indicate the direction of the market trend but rather the strength of it. It quantifies the market's "choppiness,” or the degree to which the market is trading sideways (or in a non-trending mode). Values range between 0 and 100, where a higher value indicates a more "choppy" market and values below 38.2 often signify a trending market.
Comparison
- Nature and Presentation: The most glaring difference lies in their presentation. The Chop Zone employs a colour-coded system, offering a visual cue about market momentum and direction. In contrast, the Choppiness Index is presented as an oscillator, providing a numeric value that quantifies the market's choppiness.
- Functionality: While both indicators give insights into market conditions, their focus varies. The Chop Zone provides immediate visual cues on market sentiment (bullish, bearish, or neutral). The Choppiness Index, on the other hand, emphasises the market's lack of direction or trend strength.
Cons of Using the Chop Zone Indicator
While the Chop Zone indicator can be a valuable tool for gauging market momentum, it's not without its limitations:
- False Signals: Like most technical indicators, the Chop Zone can produce false signals. A change in colour might suggest a new trend, but it could merely be a short-lived fluctuation, leading traders to premature decisions.
- Lagging Nature: Being primarily based on historical price action, the Chop Zone lags, indicating a change in market momentum after it has already commenced.
- Ambiguity in Sideways Markets: In a ranging or sideways market, it might oscillate between colours frequently, causing confusion or indecision for traders.
Final Thoughts
In summary, the Chop Zone indicator is a powerful tool for understanding market momentum using a clear colour-coded system. While it offers real-time insights and complements other indicators, traders should be aware of potential pitfalls to avoid confusion. Keen on integrating it into your own trading strategy? You can open an FXOpen account to explore its potential across a broad range of markets. Happy trading!
This article represents the opinion of the Companies operating under the FXOpen brand only. It is not to be construed as an offer, solicitation, or recommendation with respect to products and services provided by the Companies operating under the FXOpen brand, nor is it to be considered financial advice.
Stay ahead of the market!
Subscribe now to our mailing list and receive the latest market news and insights delivered directly to your inbox.


Latest articles

Ethereum: Market Assesses the Strength of the Corrective Recovery
Following a period of heightened volatility in early June, investor attention in Ethereum has once again shifted towards institutional demand and the development of the spot ETF market in the United States. The funds launched last year continue to serve

Ripple: Letter to Congress Stirs the Crypto Market
At the beginning of June, more than 200 crypto companies and industry groups — including Coinbase, Andreessen Horowitz and Ripple Labs — sent a letter to Senate Majority and Minority Leaders John Thune and Chuck Schumer, urging them to bring the Digital

GBP/JPY: Ascending Triangle Under Pressure
The GBP/JPY pair has come under pressure after the Bank of Japan raised its policy rate to 1.0% on 16 June. The Bank of England is following the opposite path: at its 30 April meeting, the Monetary Policy