


Liquidity Sweep in Trading: Basics, Components, and Application
FXOpen
Liquidity is one of the cornerstones of trading. There are many concepts around liquidity, such as liquidity zones, liquidity grabs, and liquidity sweeps. Being a part of the Smart Money Concept (SMC) framework, liquidity sweeps allow retail traders to track the footprint of institutional traders and analyse potential price movements.
In this article, we discuss the liquidity sweep concept and its components, analyse how market participants use it in trading, and consider real-market examples.
Key Takeaways
- A liquidity sweep is a market move in which price deliberately extends beyond a well-defined high or low to trigger clustered stop losses and pending orders, allowing large participants to access liquidity. It is typically followed by rejection or reversal, revealing the true directional intent of institutional order flow.
- Sweeps often resemble false breakouts and are used as a signal when followed by rejection and a reversal, rather than as standalone entries.
- Differentiating between a broader liquidity sweep and a targeted liquidity grab may help traders interpret market structure and anticipated price flow.
- Liquidity sweeps typically occur around obvious technical levels—such as swing highs, swing lows, and established support or resistance—where liquidity accumulates, and can be confirmed with subsequent price behaviour.
Understanding Liquidity in Trading
According to Encyclopaedia Britannica, “liquidity is the ease with which a non-cash asset (such as a stock, bond, home, collectible, or business) can be converted into cash to pay for goods and services” (Britannica, Liquidity).
This concept determines the ease with which transactions can be completed. High liquidity means that there are sufficient buyers and sellers at any given time, which results in tighter spreads between the bid and ask prices.
Liquidity is often visualised as the market's bloodstream, vital for its smooth operation. Financial assets rely on this seamless flow to ensure that trades can be executed rapidly and at particular prices. Various participants, including retail investors, institutions, and market makers, contribute to this ecosystem by providing the necessary volume of trades.
Liquidity is also dynamic and influenced by factors such as notable news and economic events, which can all affect how quickly assets can be bought or sold. For traders, understanding it is important because it affects trading strategies, particularly in terms of entry and exit points in the markets.
What Is a Liquidity Sweep in Trading?
A liquidity sweep is a market event, commonly described within the Smart Money Concept (SMC), in which large institutional participants intentionally drive prices towards liquidity zones where stop losses and pending orders are concentrated. By triggering these clustered orders, they may enter or exit sizable positions with minimal slippage, often causing sharp and rapid price movements.
Understanding Liquidity Zones
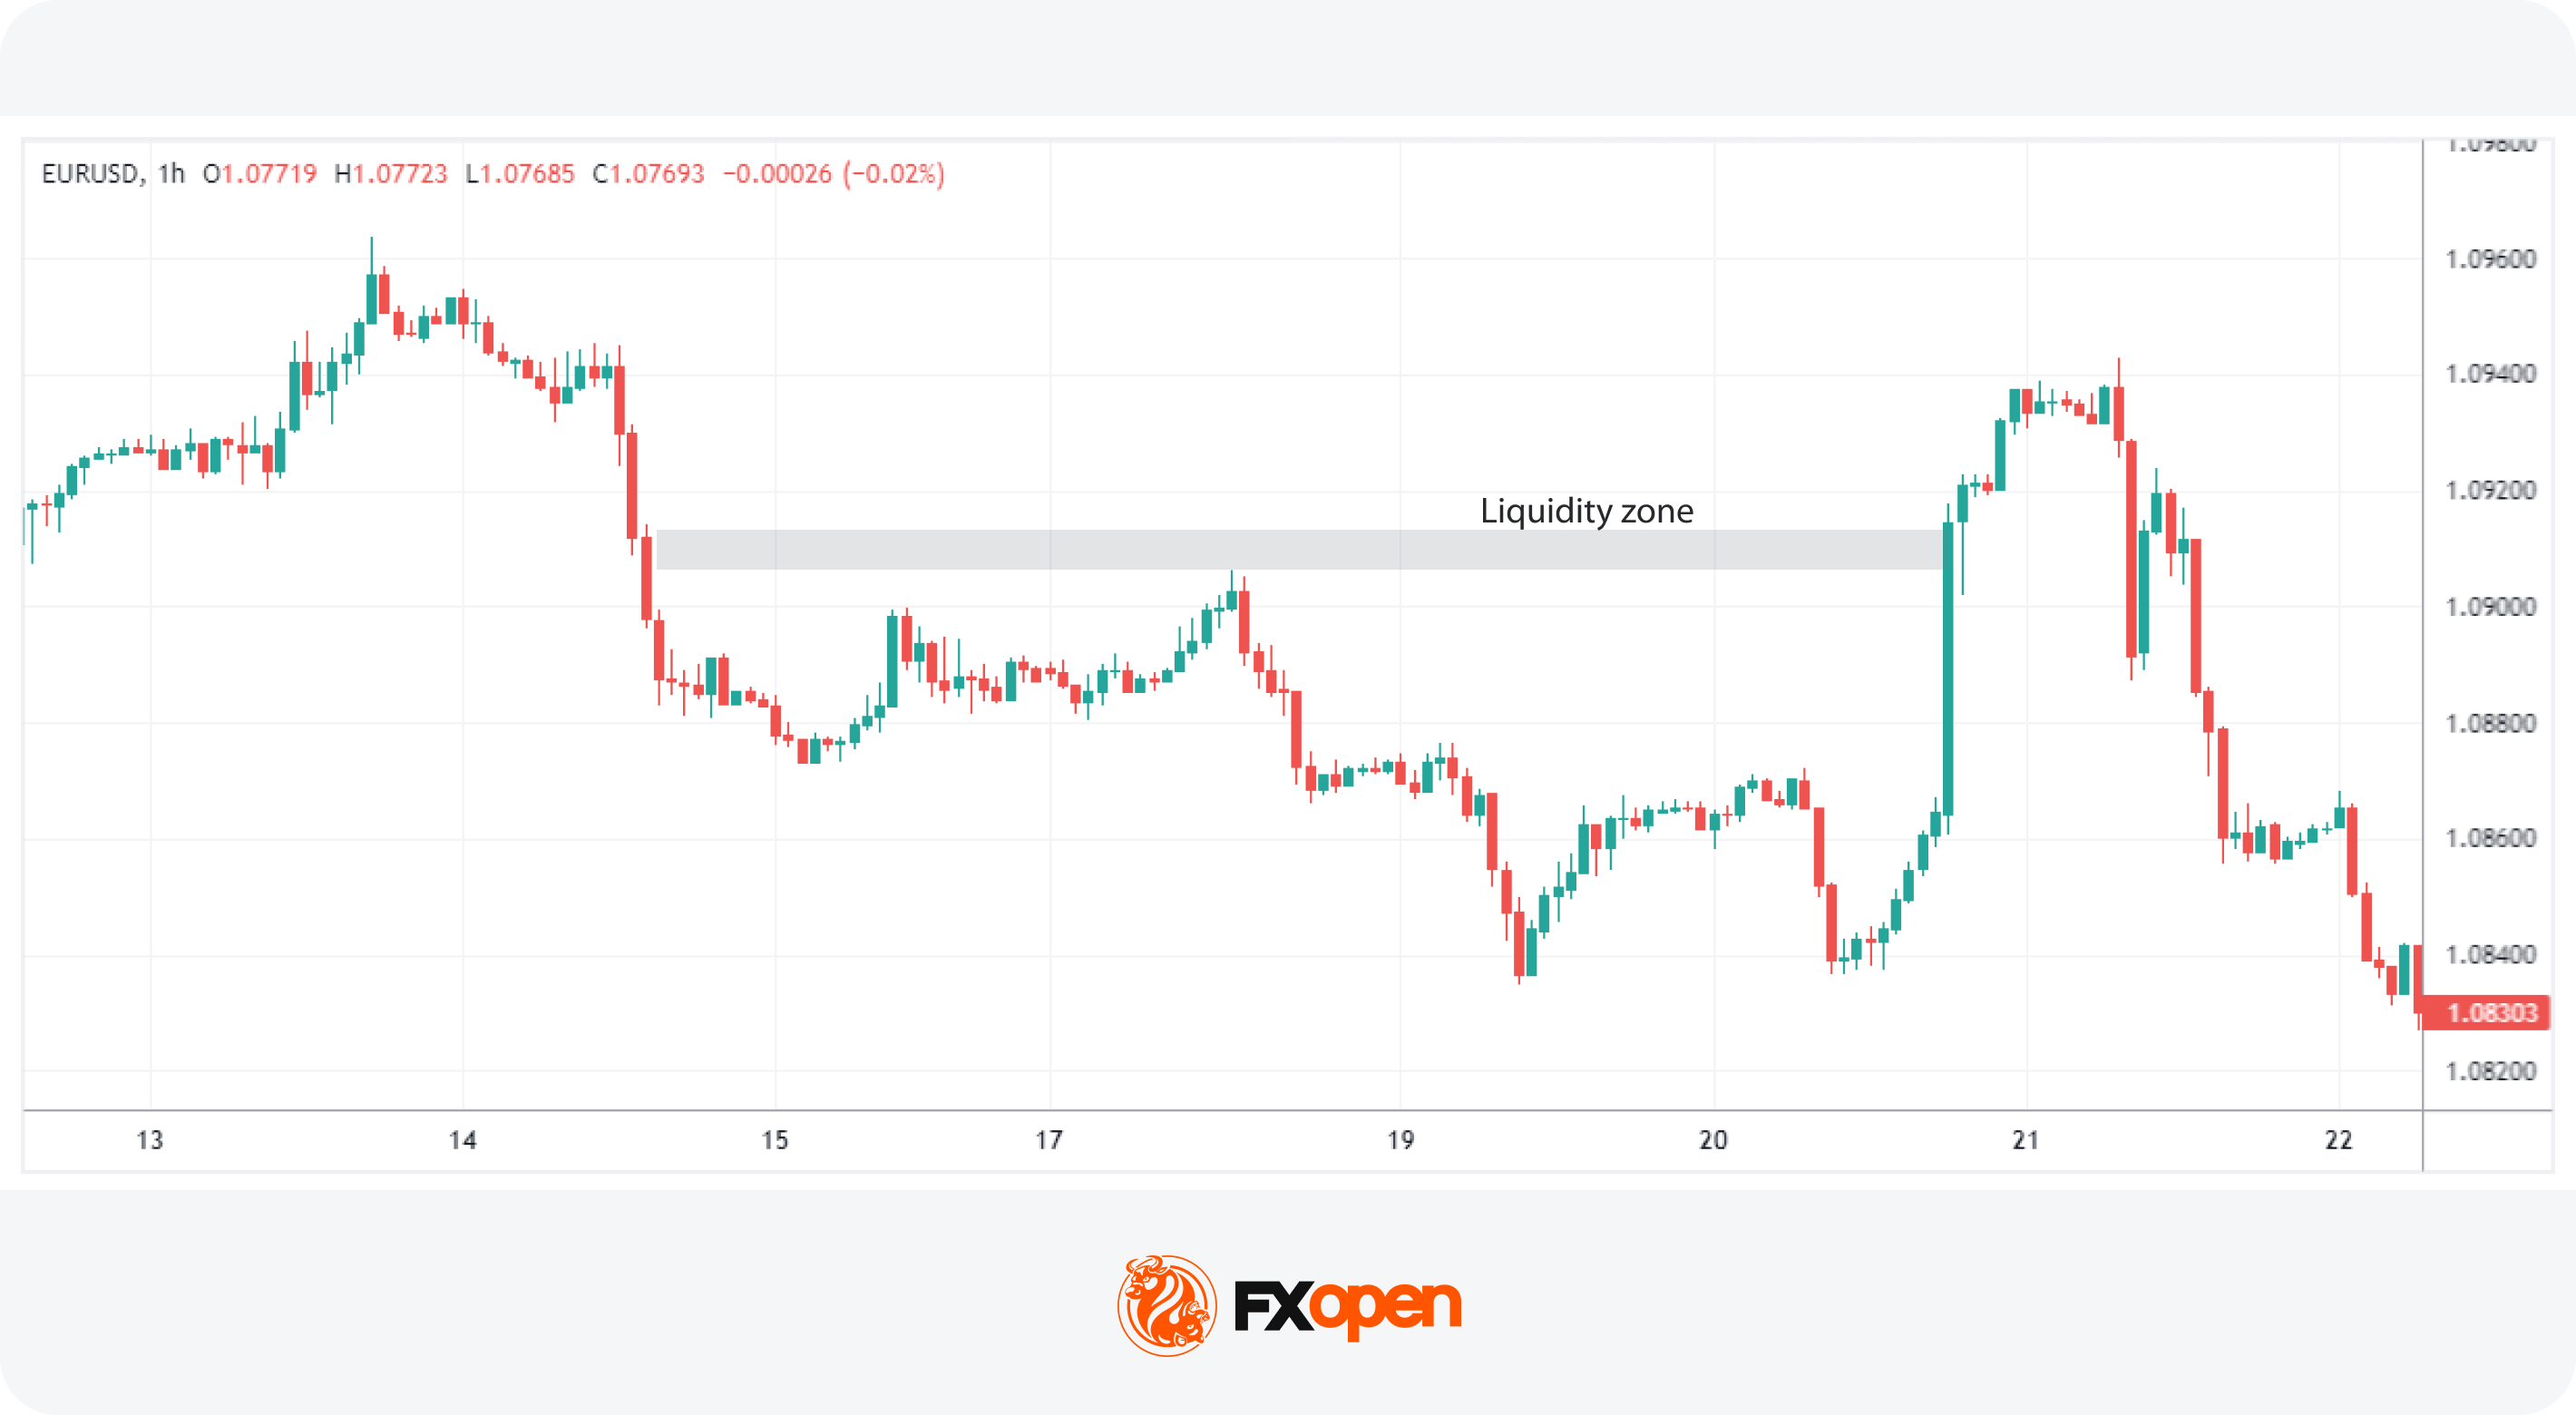
Liquidity zones are specific areas on a trading chart where there is a high concentration of orders, including stop losses and pending orders. These zones are pivotal because they represent the levels at which substantial buying or selling interest is anticipated once activated. When the price reaches these zones, the accumulated orders are executed, which can cause sudden and sharp price movements.
How Liquidity Sweeps Function
The process begins when market participants, especially institutional traders or large-scale speculators, identify these zones. By pushing the market to these levels, they trigger other orders clustered in the zone. The activation of these orders adds to the initial momentum, often causing the price to move even more sharply in the intended direction. This strategy can be utilised to enter a position favourably or to exit one by pushing the price to a level where a reversal is likely.
Liquidity Sweep vs Liquidity Grab
Within the liquidity sweep process, it is necessary to distinguish between a sweep and a grab:
- Liquidity Sweep: This is typically a broader movement where the price action moves through a liquidity zone, activating a large volume of orders and thereby affecting a significant range of prices.
- Liquidity Grab: Often a more targeted and shorter-duration manoeuvre, this involves the price quickly hitting a specific level to trigger orders before reversing direction. This is typically used to 'grab' liquidity by activating stops or pending positions before the price continues to move in the same direction.
In short, a grab may just move slightly beyond a peak or low before reversing, while a sweep can see a sustained movement beyond these points prior to a reversal. There is a subtle difference, but the outcome—a reversal—is usually the same.
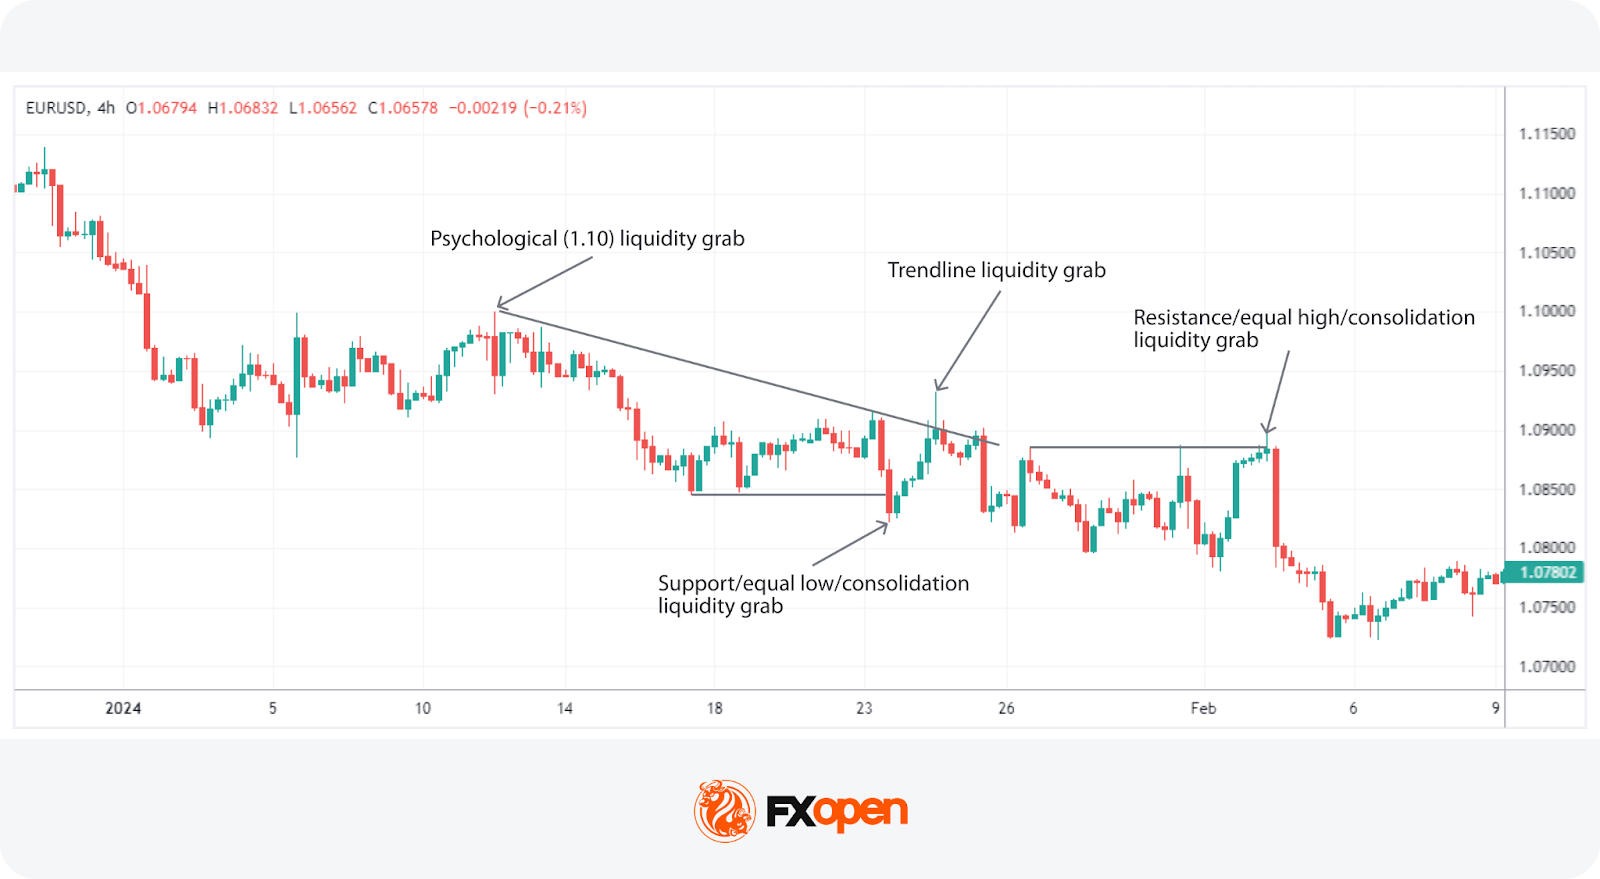
Spotting a Liquidity Sweep in the Market
Identifying a sweep involves recognising where orders are accumulating and monitoring how the price interacts with these zones. It typically accumulates at key levels where traders have placed significant numbers of stop-loss orders or pending buy and sell positions.
These areas include:
- Swing Highs and Swing Lows: These are peaks and troughs in the market where traders expect resistance or support, leading to the accumulation of orders.
- Support and Resistance Levels: Historical areas that have repeatedly influenced price movements are watched closely for potential order accumulation.
- Fibonacci Levels: Common tools in technical analysis; these levels often see a concentration of orders due to their popularity among traders.
The strategy for spotting a sweep involves observing when the price approaches and breaks through these levels. Traders look for a decisive move that extends beyond the identified zones and watch how the asset behaves as it enters adjacent points of interest, such as order blocks. Traders monitor for a subsequent reversal or deceleration in price movement, which can signal that the sweep has occurred and the market is absorbing the liquidity.
This approach may help traders discern whether a significant movement is likely a result of a sweep, allowing them to make more comprehensive decisions about entering or exiting positions based on the anticipated reversal or continuation of the price movement.
You can consider heading over to FXOpen’s TickTrader platform to have a go at identifying your own liquidity sweep examples on real-time charts.
How Traders Use Liquidity Sweeps in Trading
Traders often leverage liquidity sweeps in forex as strategic indicators within a broader Smart Money Concept framework, particularly in conjunction with order blocks and fair value gaps. Understanding how these elements interact provides traders with a robust method for anticipating and reacting to potential price movements.
Understanding Order Blocks and Fair Value Gaps
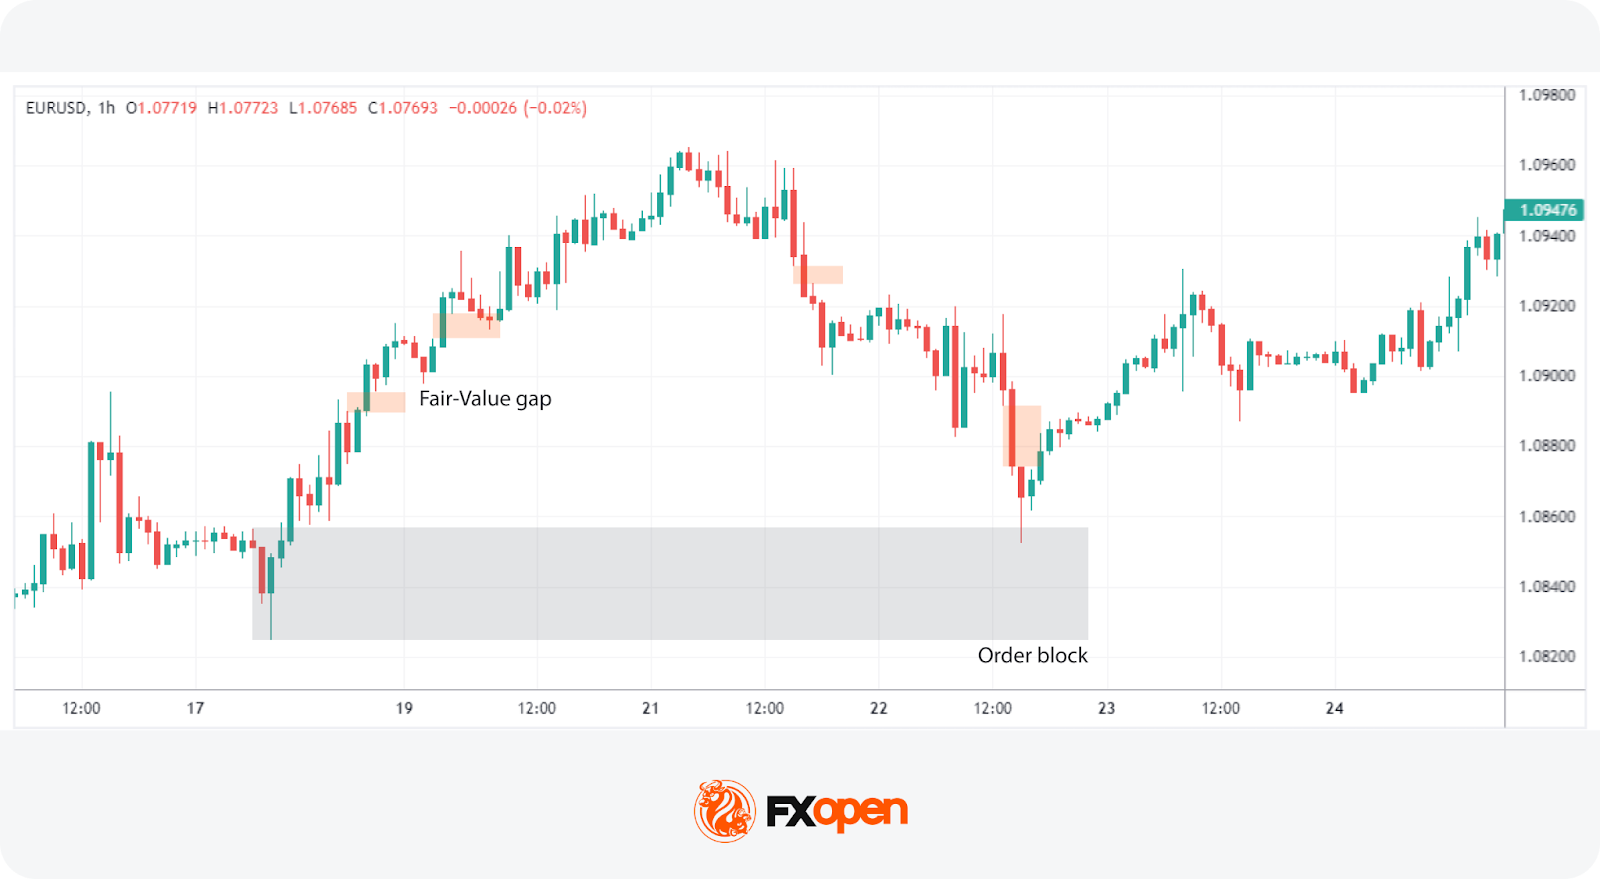
Order blocks are levels or areas where “smart money”, such as banks or institutional traders, have placed large buy/sell orders. These blocks can act as future points of interest where the price might react due to leftover or renewed interest from market participants.
Fair value gaps are areas on a chart that were quickly overlooked in previous movements. These gaps often attract price back to them, as the market seeks to 'fill' these areas by finding the fair value that was previously skipped.
Liquidity Sweep Trading Examples
Let’s take a look at liquidity sweeps in forex.
Identifying the Trend Direction
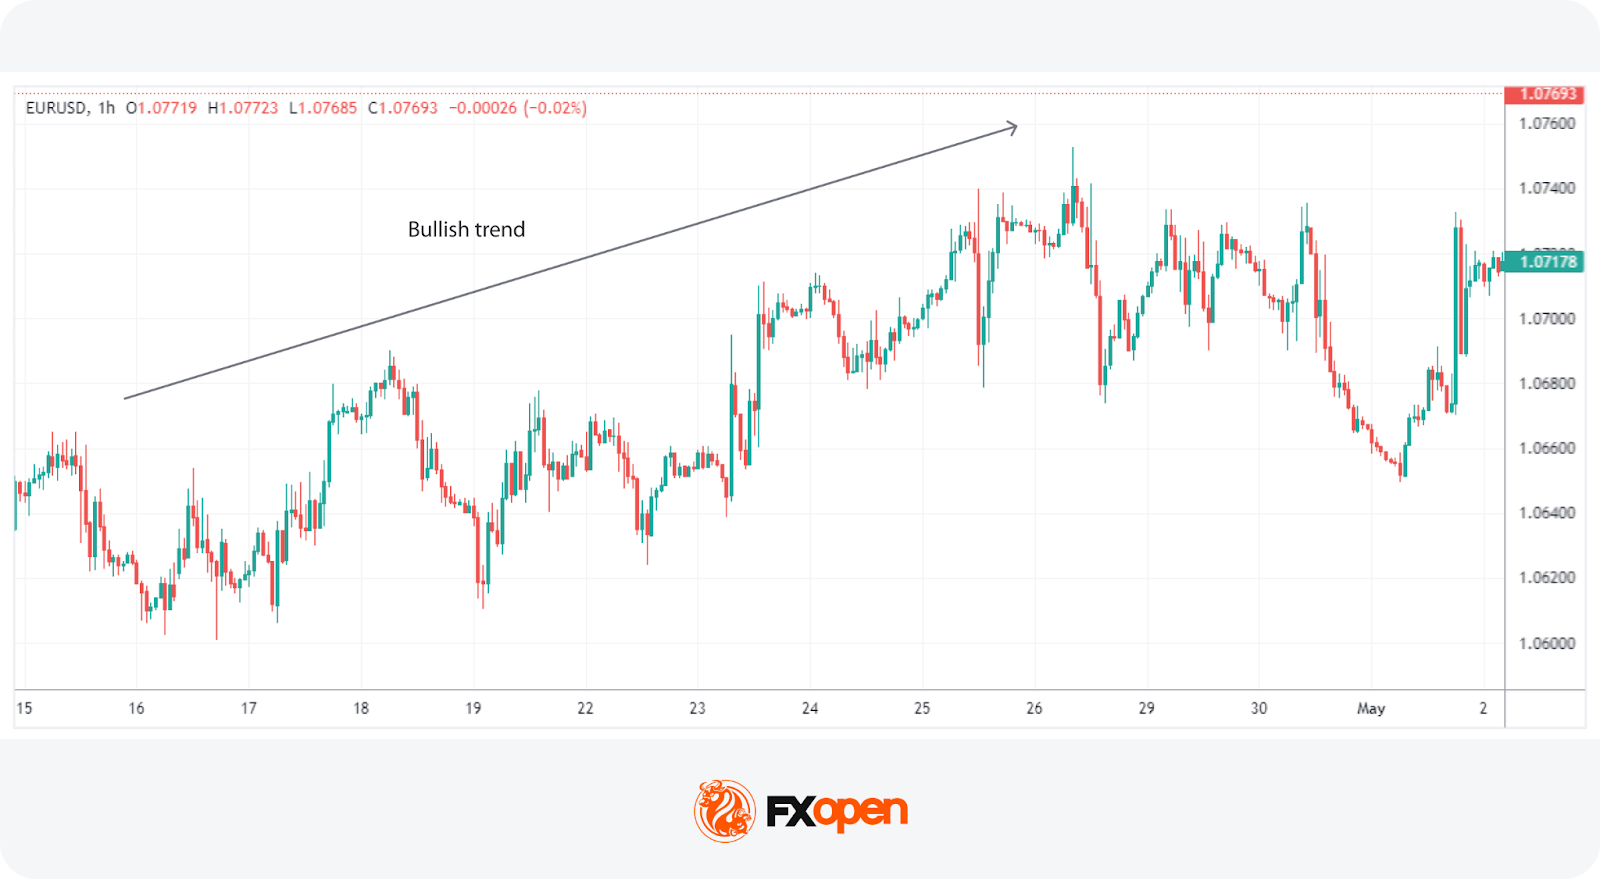
In trading, any analysis starts with understanding the current trend, which can be discerned through the market structure—the series of highs and lows that dictate the direction of the market movement.
Locating Liquidity Zones
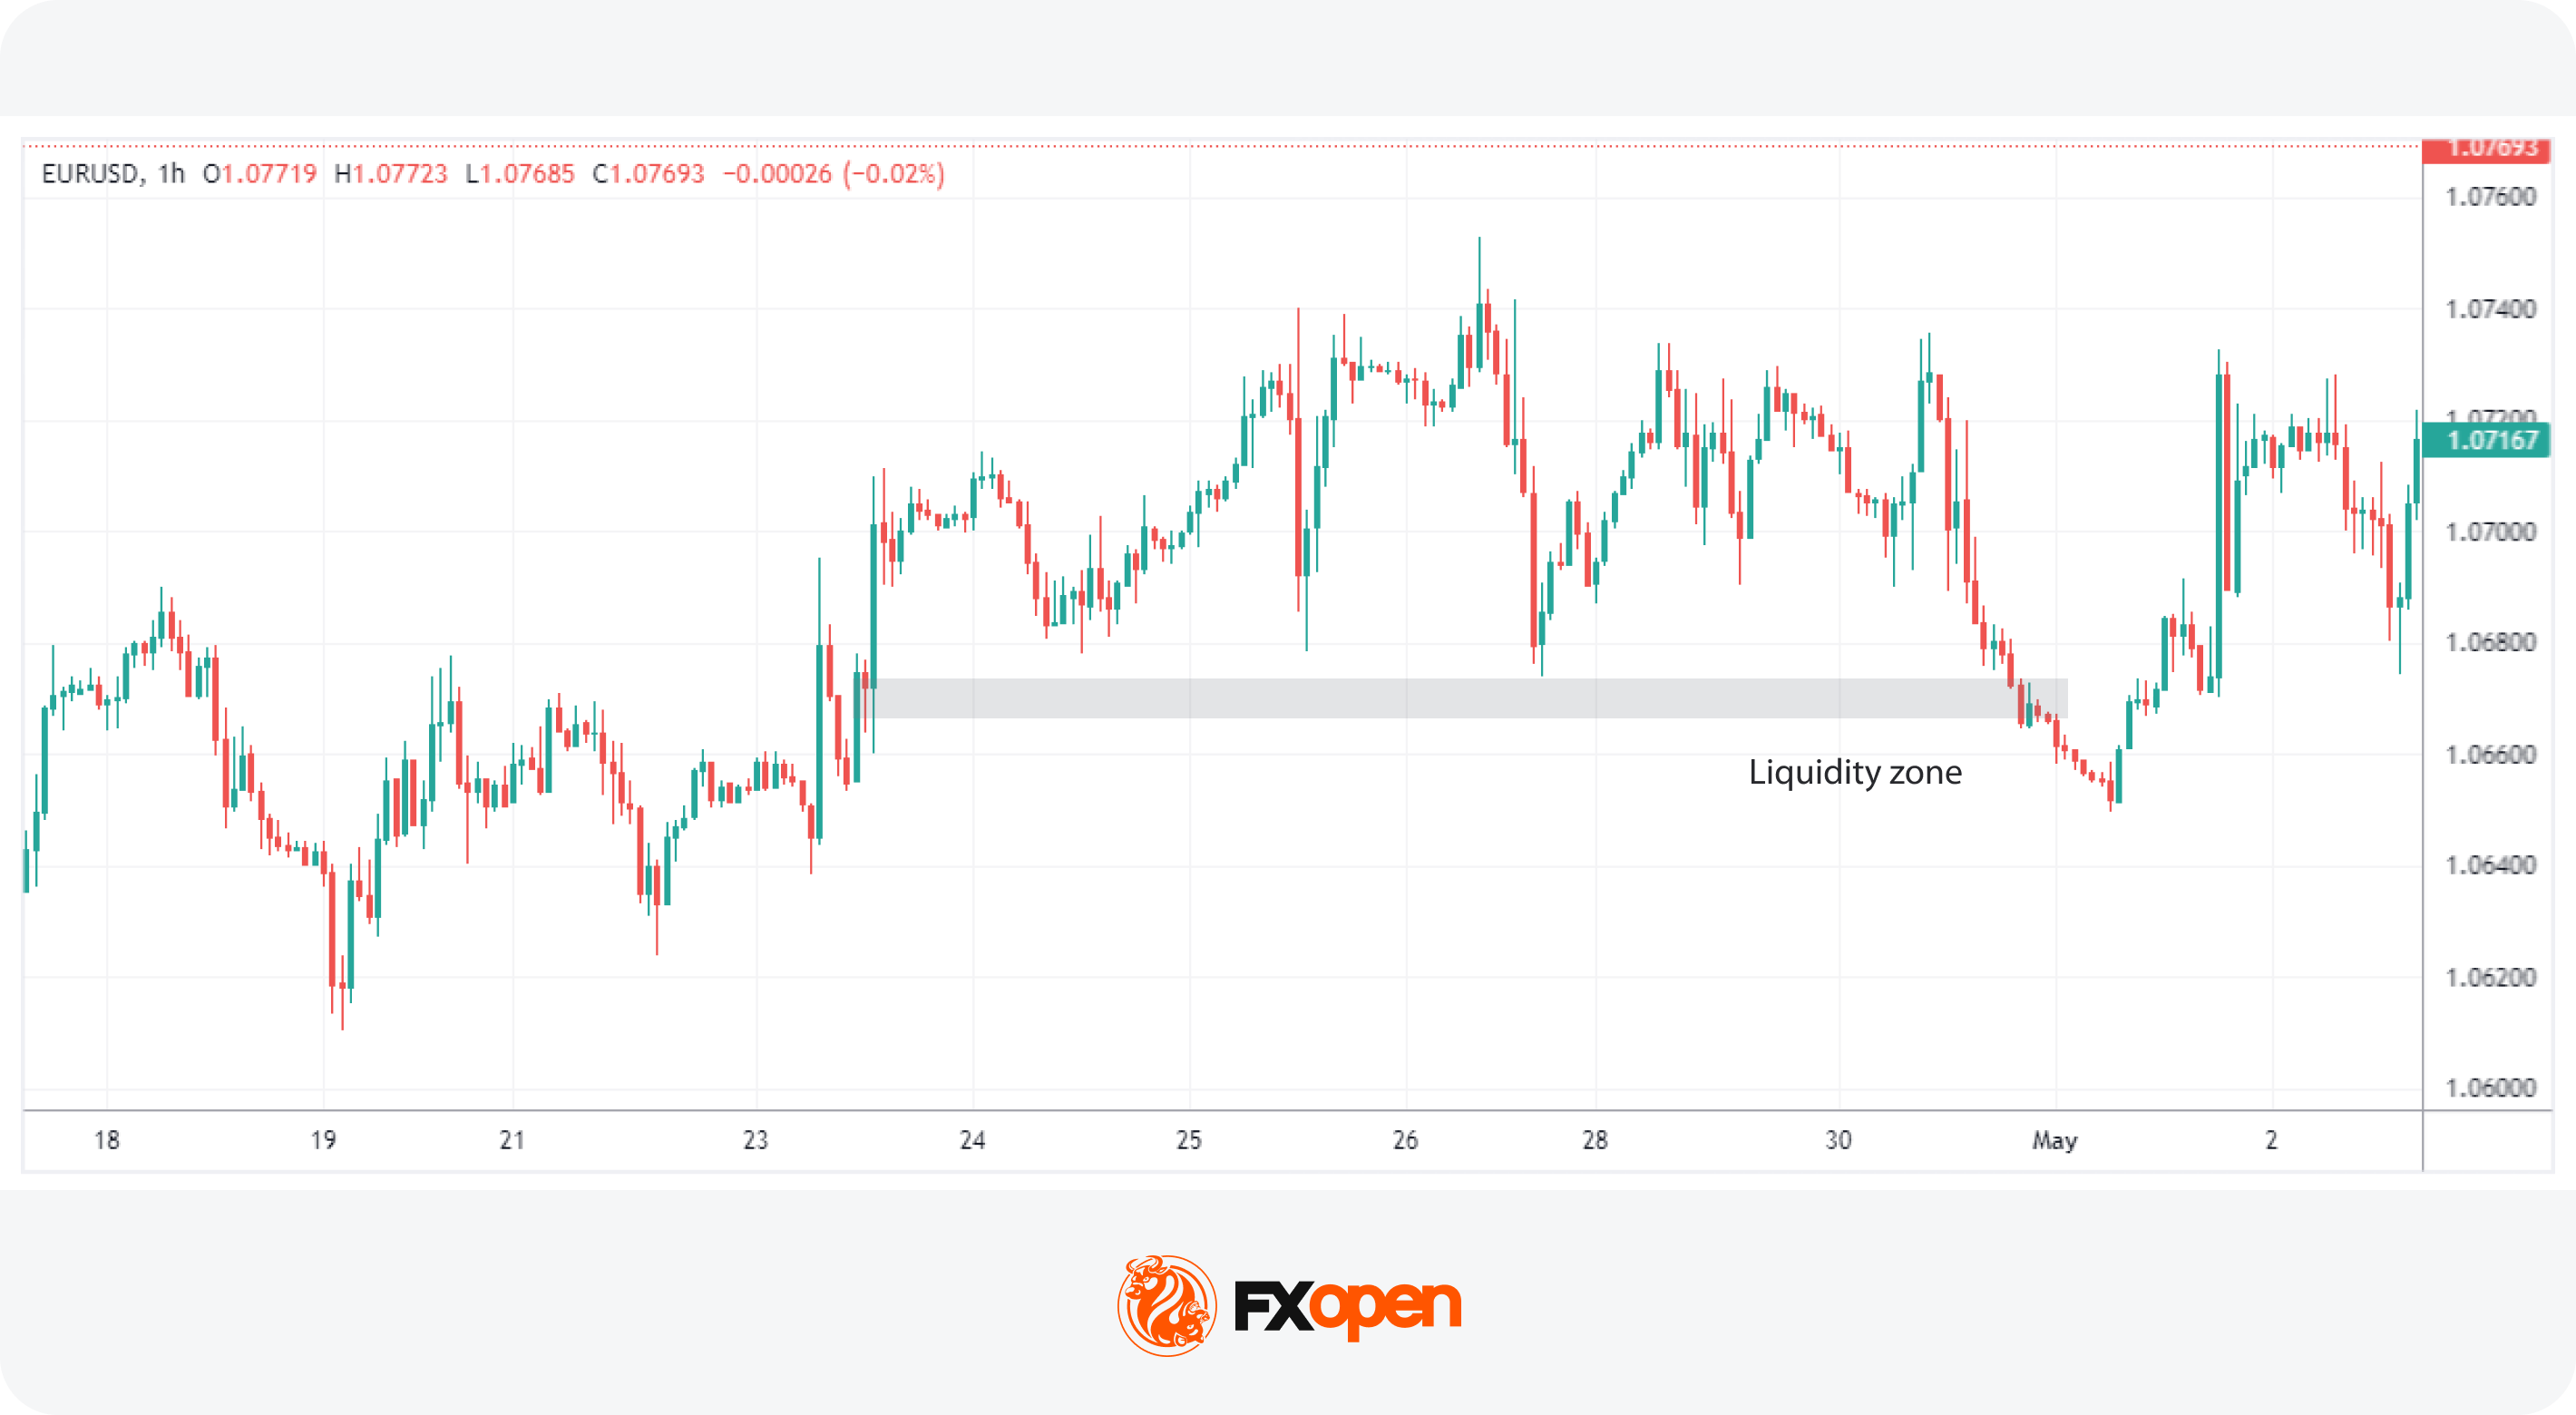
Within the identified trend, traders pinpoint liquidity zones, which could be significant recent swing highs or lows or areas marked by repeated equal highs/lows or strong support/resistance levels.
Observing Order Blocks and Fair Value Gaps
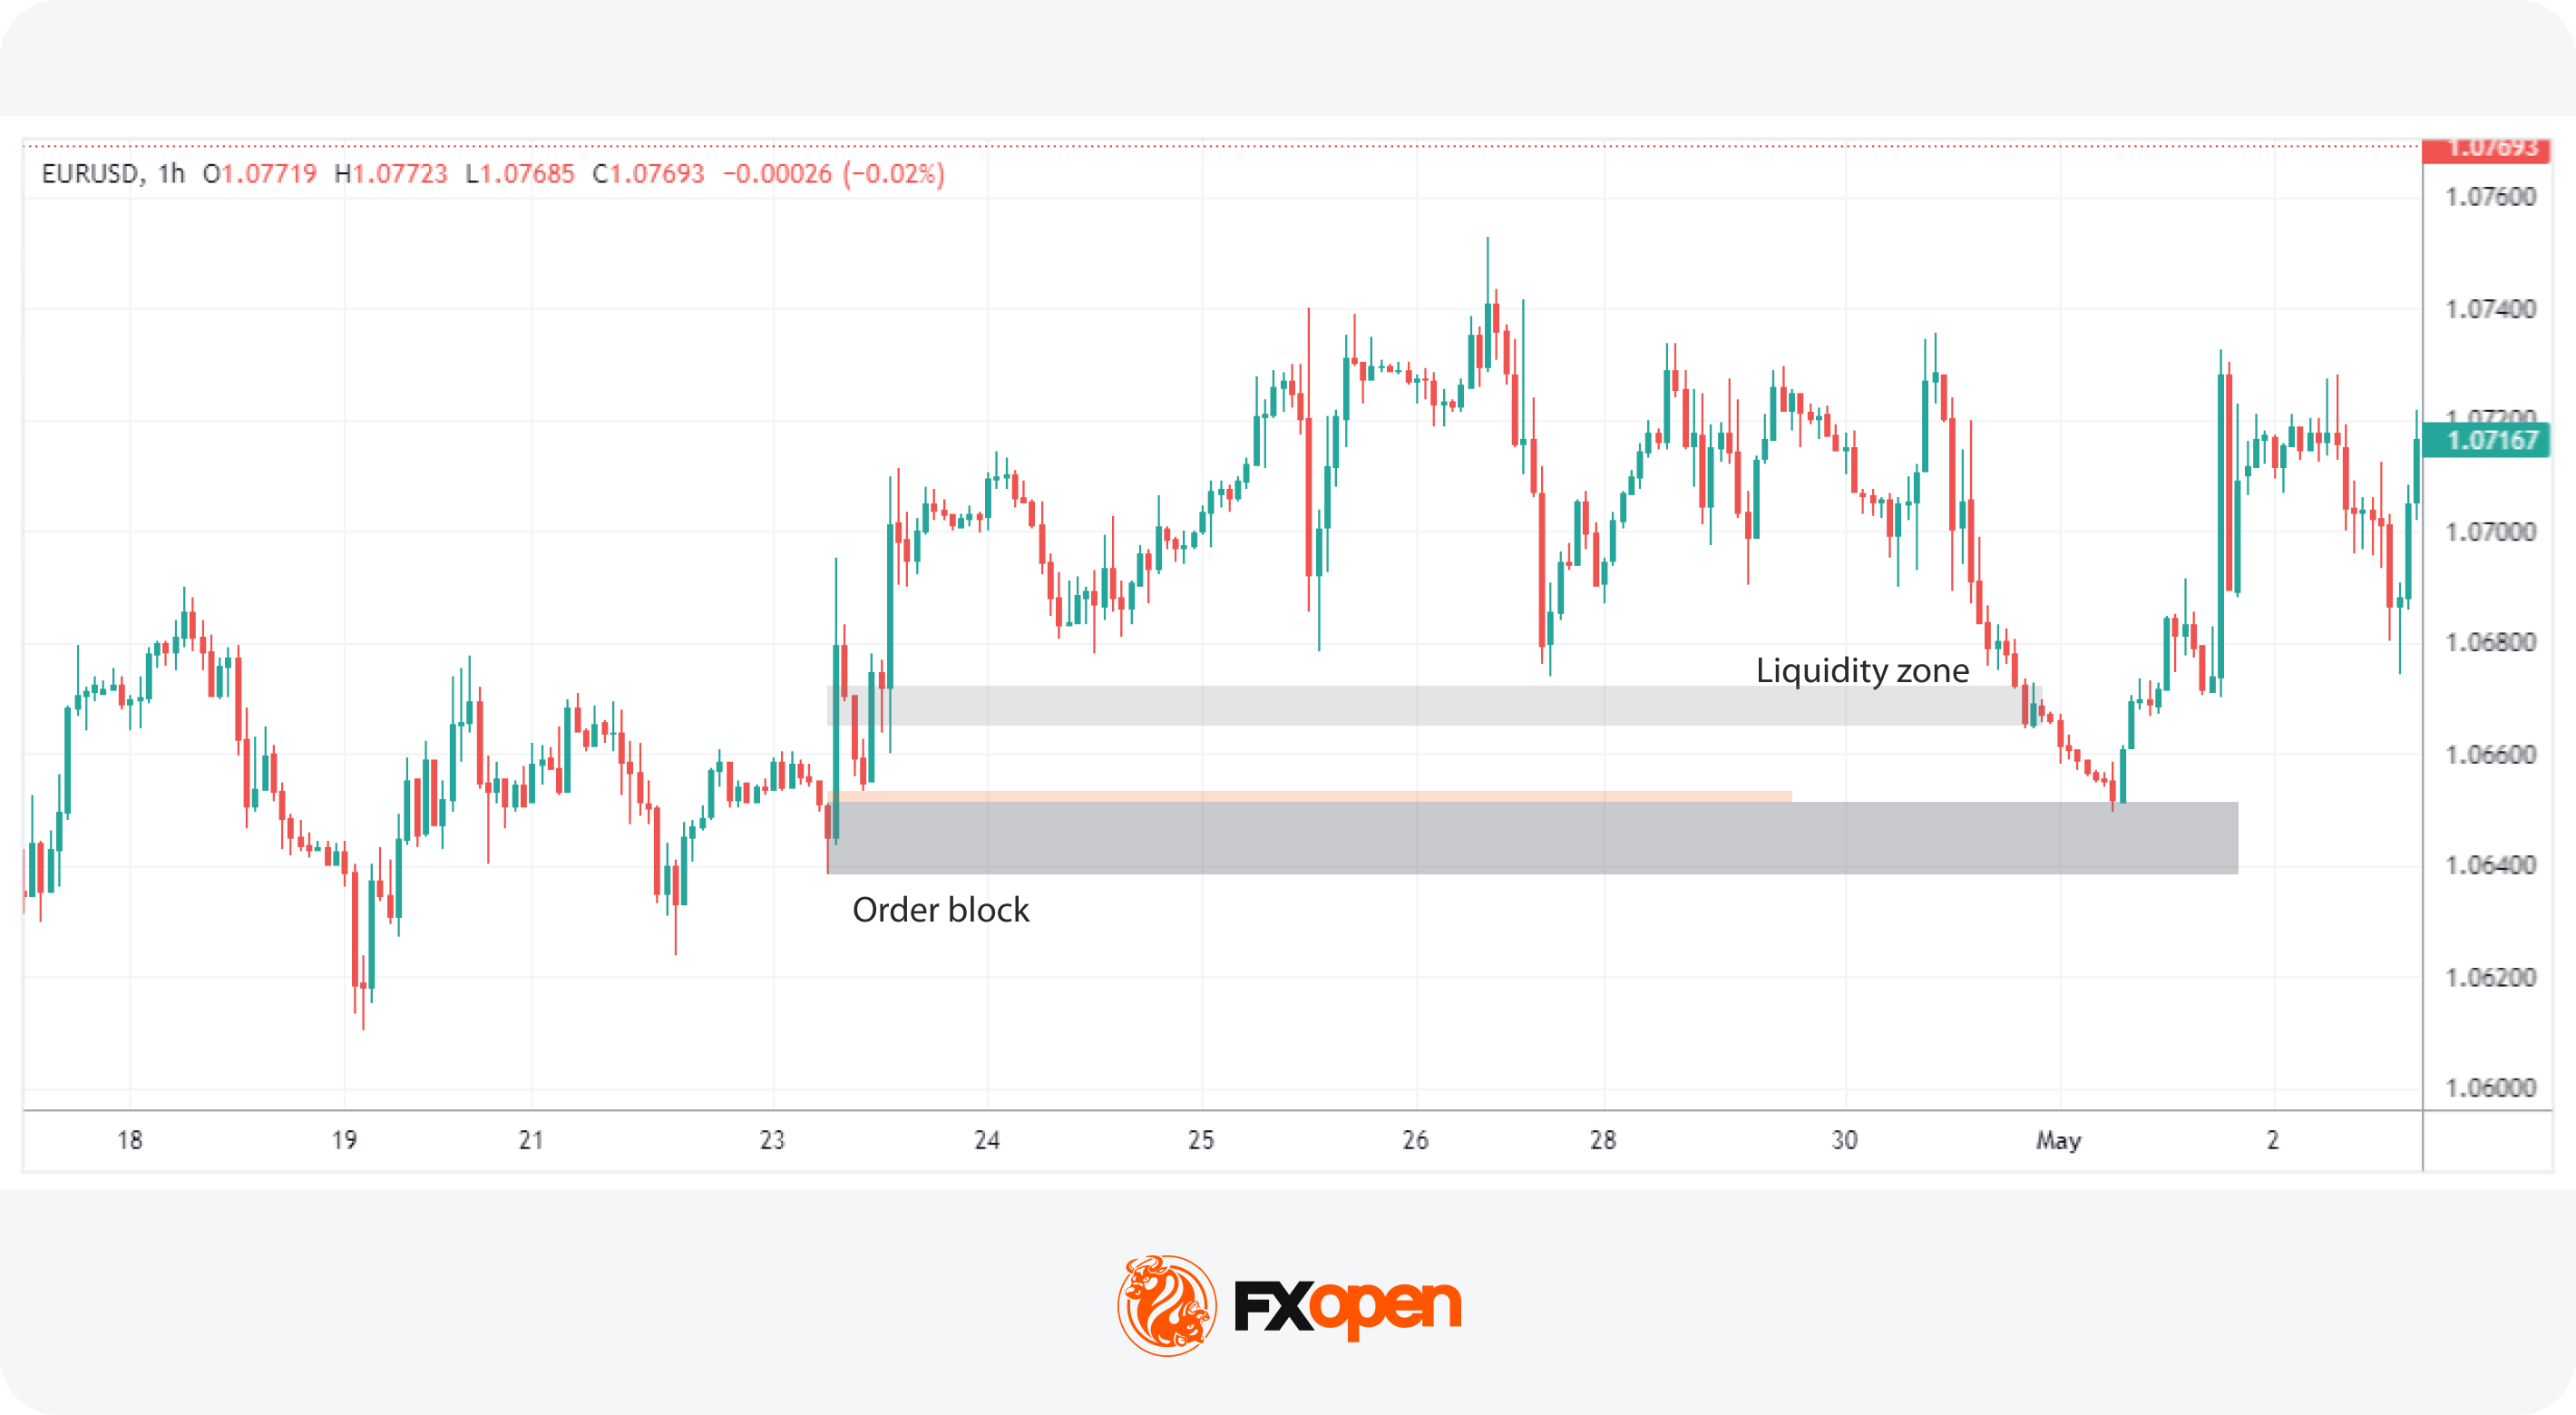
After identifying a liquidity zone, traders then look for an order block beyond this zone. The presence of a fair value gap near the block is supposed to increase the likelihood of the block being reached, as these gaps are frequently filled.
Trade Execution
When the price moves into the order block, sweeping liquidity, traders might place limit orders at the block with a stop loss just beyond it. This action is often based on the expectation that the order block will trigger a reversal.
Utilising Liquidity Sweeps for Entry Confidence
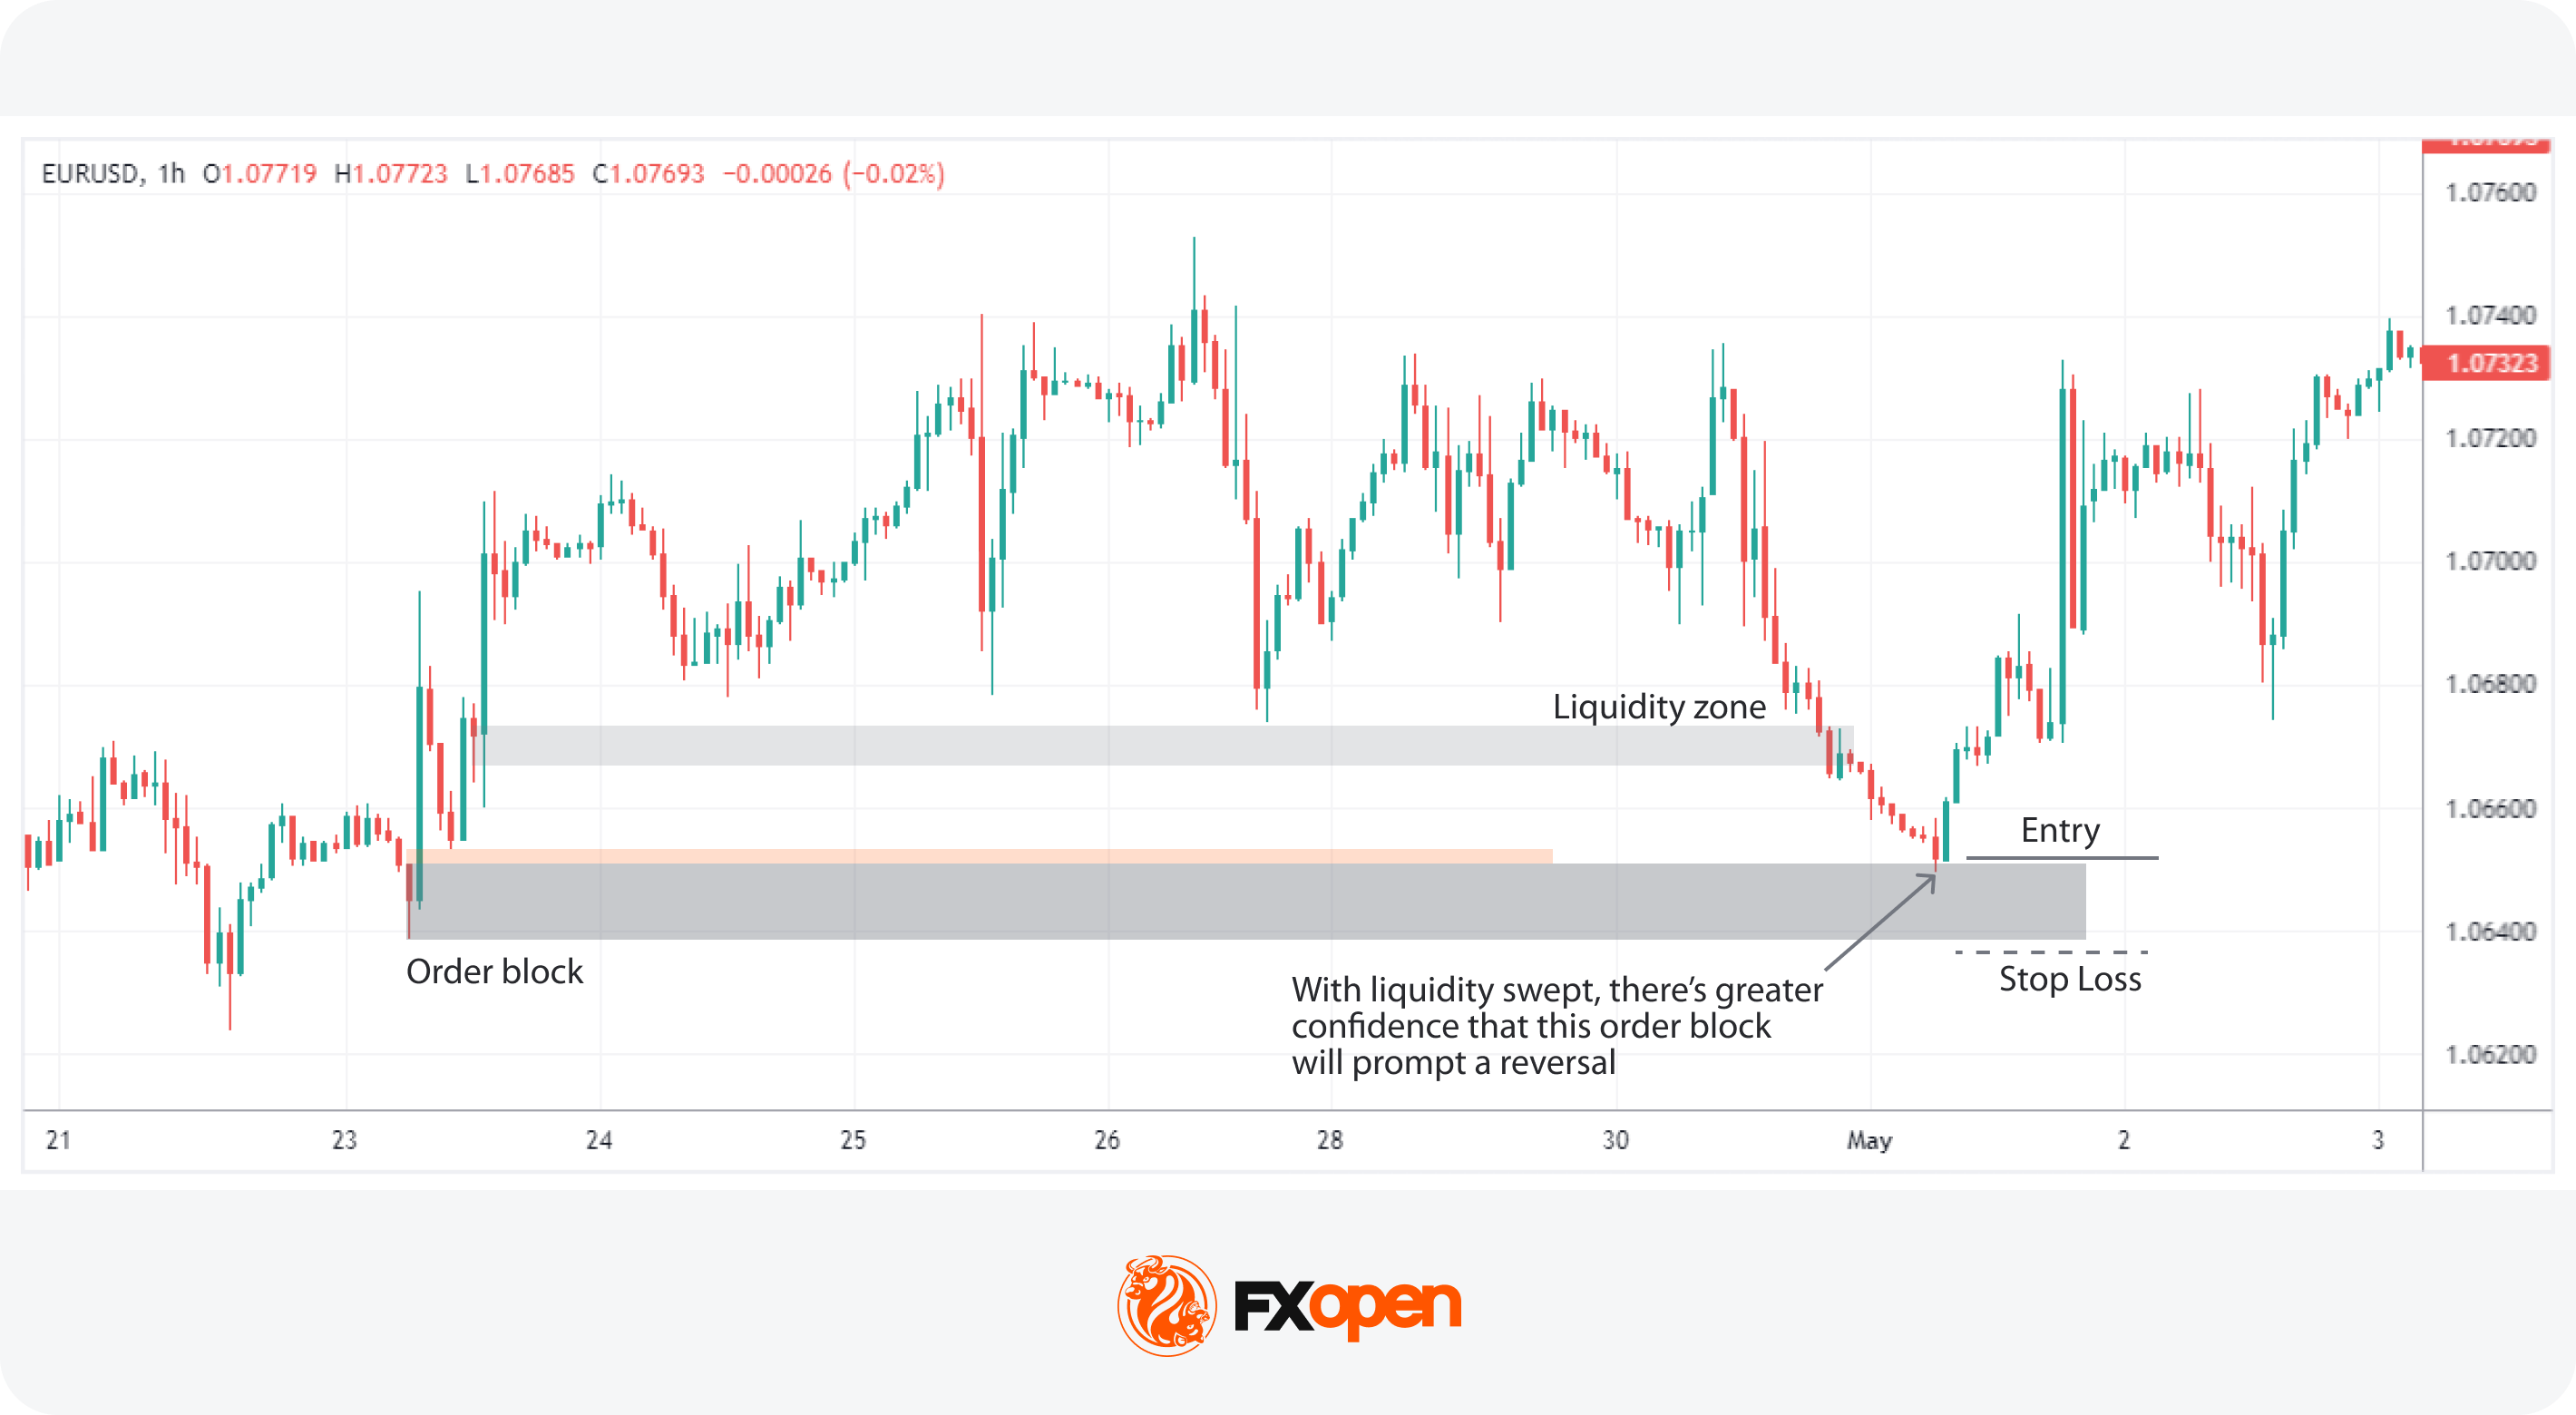
A sweep into an order block signals the potential for a reversal and provides traders with an additional contextual basis for assessing a position. This is based on the observation that the price movement towards, and reaction at, the block has been accompanied by a liquidity sweep.
By combining these elements—trend analysis, liquidity zone identification, and strategic use of order blocks and fair value gaps—traders can create a cohesive strategy that utilises sweeps to support their decision-making.
The Bottom Line
Understanding liquidity sweeps offers traders a critical lens through which to view market dynamics, revealing deeper insights into potential price movements. By incorporating liquidity sweep analysis into a broader trading framework, market participants can distinguish between genuine breakouts and deceptive moves driven by institutional order flow.
If you are looking to apply these insights practically, you can consider opening an FXOpen account and leveraging professional-grade tools to navigate liquidity phenomena.
FAQs
What Is a Liquidity Sweep?
A liquidity sweep is a Smart Money Concept (SMC) pattern when large market participants deliberately push the price into liquidity zones where stop losses and pending buy or sell orders are concentrated. By triggering these orders, they access sufficient liquidity to execute large positions, often resulting in sharp and short-term price movements.
What Is a Sweep Trade?
A sweep trade is a large order executed through multiple different areas on a chart and venues to optimise execution. This is common in both equities and derivatives trading to minimise market impact.
How May Traders Spot a Liquidity Sweep?
Liquidity sweeps can be identified by sudden, sharp movements towards areas dense with orders, such as previous swing highs or lows or known support and resistance levels, followed often by a rapid reversal.
What Is the Difference Between Liquidity Sweeps and Grabs?
A liquidity sweep is a broader market move activating a large volume of orders across a range of prices. In contrast, a grab is a quick, targeted action to hit specific order levels before the price reverses direction.
This article represents the opinion of the Companies operating under the FXOpen brand only. It is not to be construed as an offer, solicitation, or recommendation with respect to products and services provided by the Companies operating under the FXOpen brand, nor is it to be considered financial advice.
Stay ahead of the market!
Subscribe now to our mailing list and receive the latest market news and insights delivered directly to your inbox.


Latest articles

Amazon Earnings: Does the Chart Already Know Something the Numbers Don't?
All eyes are on July 30, when Amazon reports Q2 2026 earnings, with Wall Street increasingly convinced the bar has been set too low. Consensus sees EPS near $1.82-$2.26 on roughly $197 billion in revenue, but the

WTI Analysis: Gap Breaks Short-Term Trend as Price Remains Trapped Between the POC and Profile Boundary
WTI crude oil plunged by more than 7% on 27 July 2026 after the US suspended a series of strikes against Iran over the weekend, raising hopes of a diplomatic solution and the reopening of shipping through the Strait of

US Dollar Index: A Defining Week for the King of the Markets
The dollar heads into a pivotal week trading near 101.80, just off a 15-month high, with the Fed's July 29 meeting standing as the clear focal point. Markets currently price roughly a 65% chance of a hold, though renewed