


What Is a Moving Average Convergence Divergence?
FXOpen
The Moving Average Convergence Divergence is a popular and versatile technical indicator used by traders to analyse and gauge the momentum and direction of asset prices. It offers valuable insights into trends, entry and exit points, and market strength.
However, despite its popularity, traders often find themselves facing certain challenges when it comes to understanding its signals and learning how to complement it with other technical tools. Let’s explore its fundamental concepts and see its significance in the world of financial analysis.
What Is an MACD Indicator?
The Moving Average Convergence Divergence is a technical tool used by traders to analyse the momentum and trend of different financial assets. In commodities, cryptocurrencies*, forex, and stocks, Moving Average Convergence Divergence helps traders identify potential trend changes and precise entry and exit points.
At its core, the MACD compares two moving average lines – typically a short-term and a long-term one – to assess the convergence or divergence of these averages over time. The result is a visual representation that offers valuable insights into price momentum, trends, and overall market strength.
The MACD is made up of several components:
MACD
This is the heart of the MACD tool. It's derived by subtracting a longer-term Exponential Moving Average (EMA) from a shorter-term EMA. The most common EMA periods used are 12 for the short-term and 26 for the long-term.
The EMA is a moving average that puts additional weight on the most recent prices. It helps smooth out the indicator's fluctuations and hints at potential trend changes faster.
Signal Line
This is a 9-period exponential MA of the MACD line. It's used to generate trading opportunities.
Histogram
This helps traders see the strength of a trend. When the histogram is above the zero level and increasing, it's a sign of a strong bullish trend. When it's below the zero level and decreasing, it indicates a strong bearish trend.
Zero Level
The zero level on the histogram represents the point at which the MACD and the signal line are equal. Crossovers of the histogram above or below the zero level can be a significant indication of potential trend changes.
How to Calculate the MACD Indicator
Calculating the Moving Average Convergence Divergence indicator involves three straightforward steps:
Step #1 Calculate the Short-Term EMA:
Choose a short-term time frame, commonly 12 periods. Calculate the EMA for this period by using the closing prices of the asset. You can use the formula below:
EMA(12) = [Closing Price * K] + [Previous EMA * 1-K]
K = 2 / (N+1)
N - number of EMA periods
The first EMA(12) is typically calculated using a simple moving average for the first 12 periods.
Step #2 Calculate the Long-Term EMA:
Choose a longer-term time frame, often 26 periods. Calculate the EMA for this period in the same way as the short-term EMA.
Step #3 Find the MACD:
Subtract the long-term EMA from the short-term EMA. That's it! You've now calculated the MACD line.
How to Use the MACD Indicator
The Moving Average Convergence Divergence provides several signals that can help traders identify market changes. Here, we will explain the key alerts the indicator provides, along with simplified charts to illustrate them.
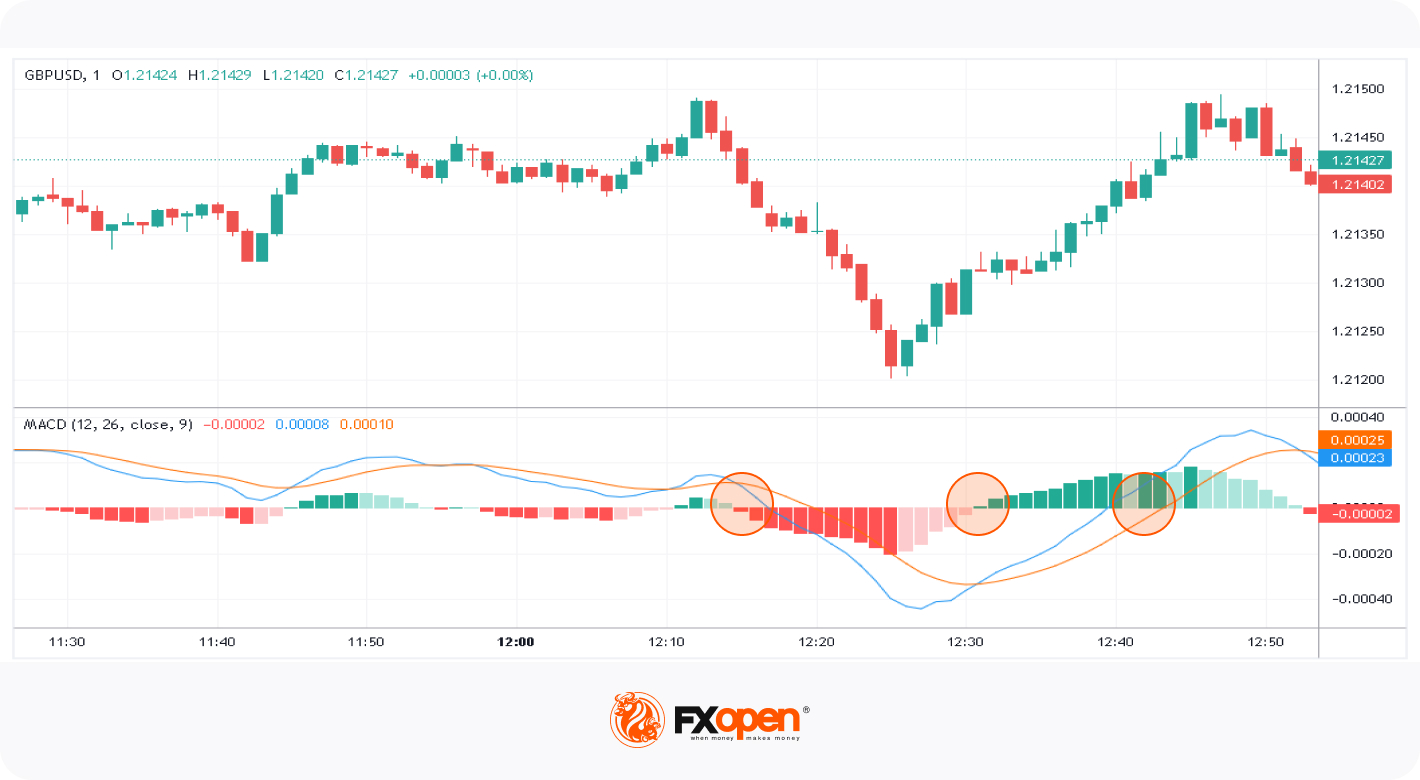
1. MACD and Signal Line Crossover
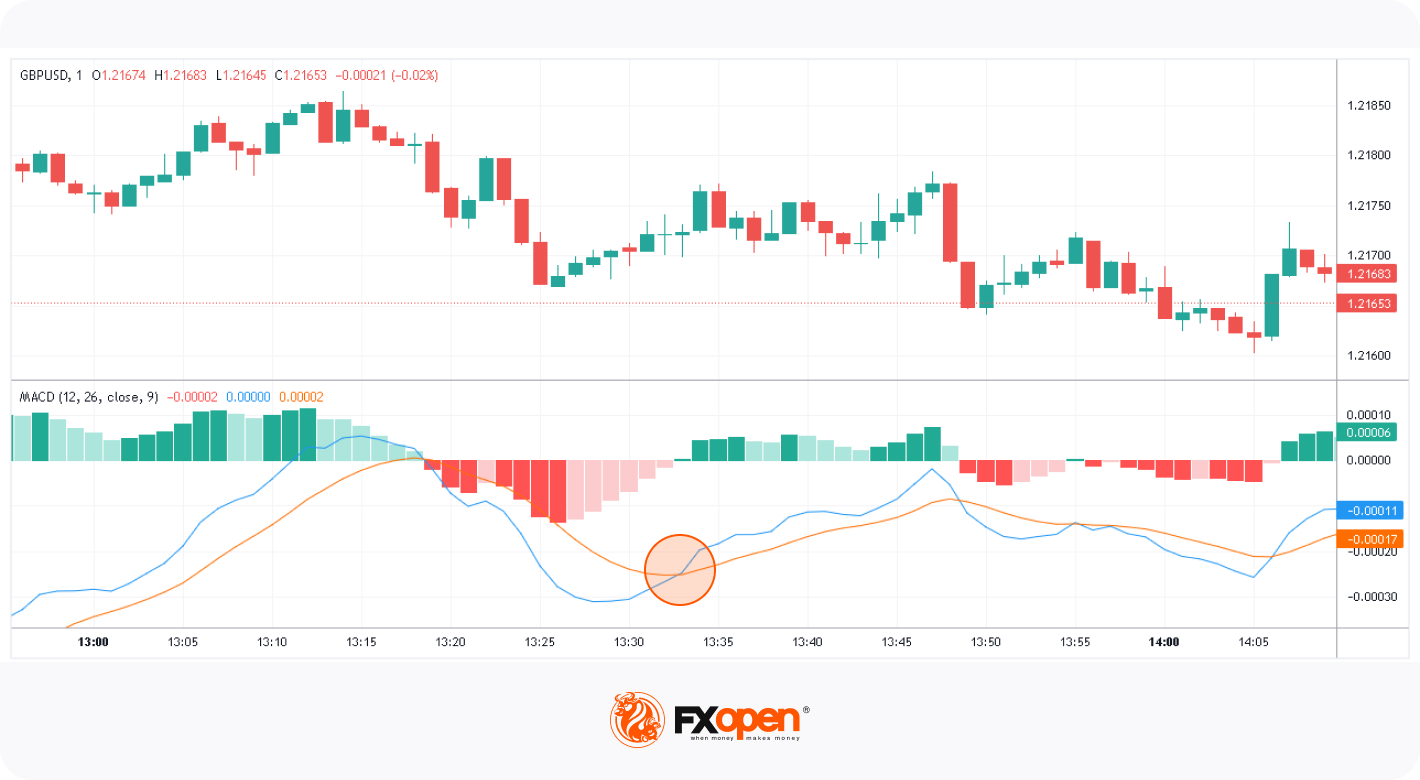
When the MACD crosses above the signal line from below, it generates a bullish cue. This suggests that the asset's momentum may be shifting upward, and it could be a good time to consider buying. The further the cross is above the zero level, the stronger the bullish momentum.
When the MACD crosses below the signal line from above, it generates a bearish alert. This indicates that the asset's momentum might be turning downward, and it could be a good time to consider selling or closing buy trades. The further the cross is below the zero slash, the stronger the bearish momentum.
2. Divergence (Potential Trend Reversal):
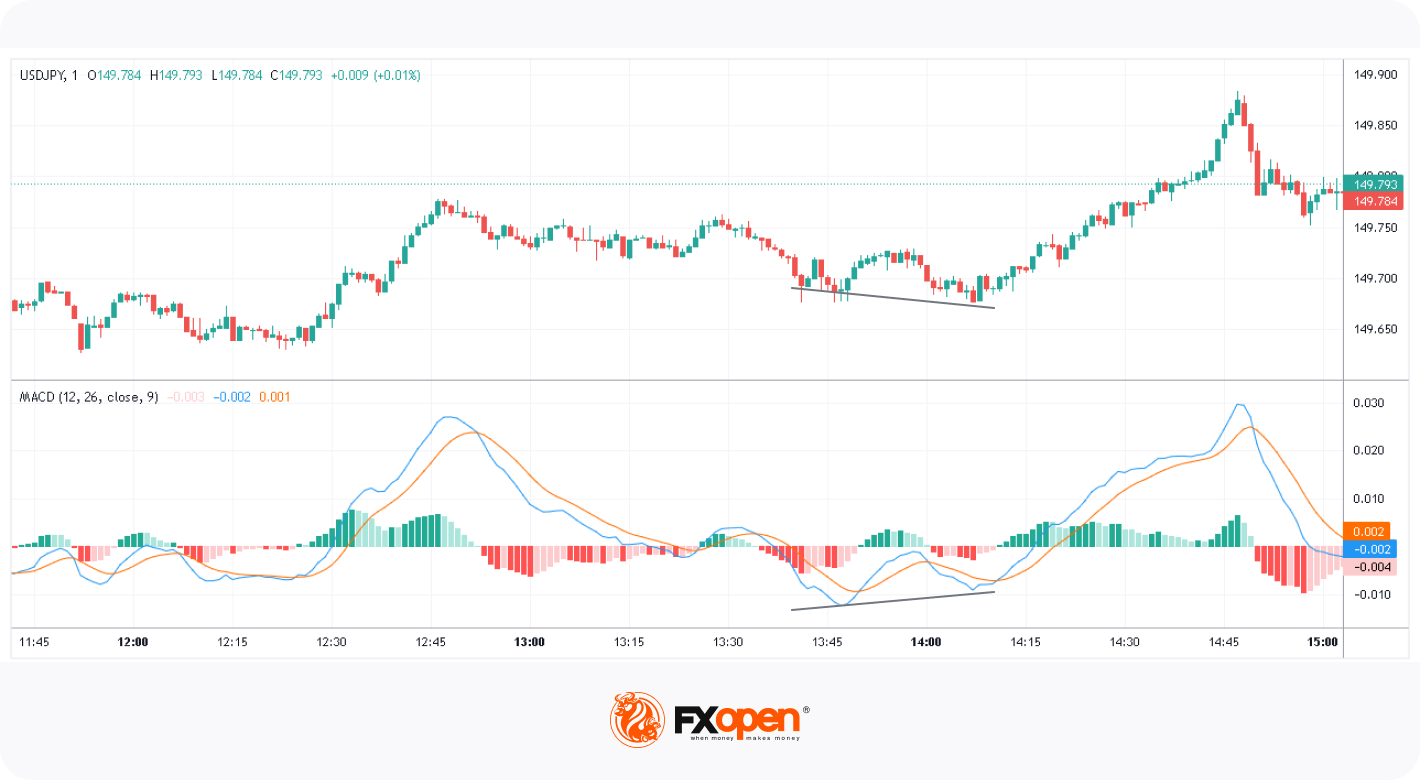
Divergence occurs when the price of the asset and the Moving Average Convergence Divergence move in opposite directions. If the price is making higher highs, but the indicator (lines or histogram) is making lower highs (bearish divergence), or if the price is making lower lows, but the indicator (lines or histogram) is making higher lows (bullish divergence), it can signal a potential trend reversal. Divergence trading can be used in various markets, including stocks and cryptocurrencies*.
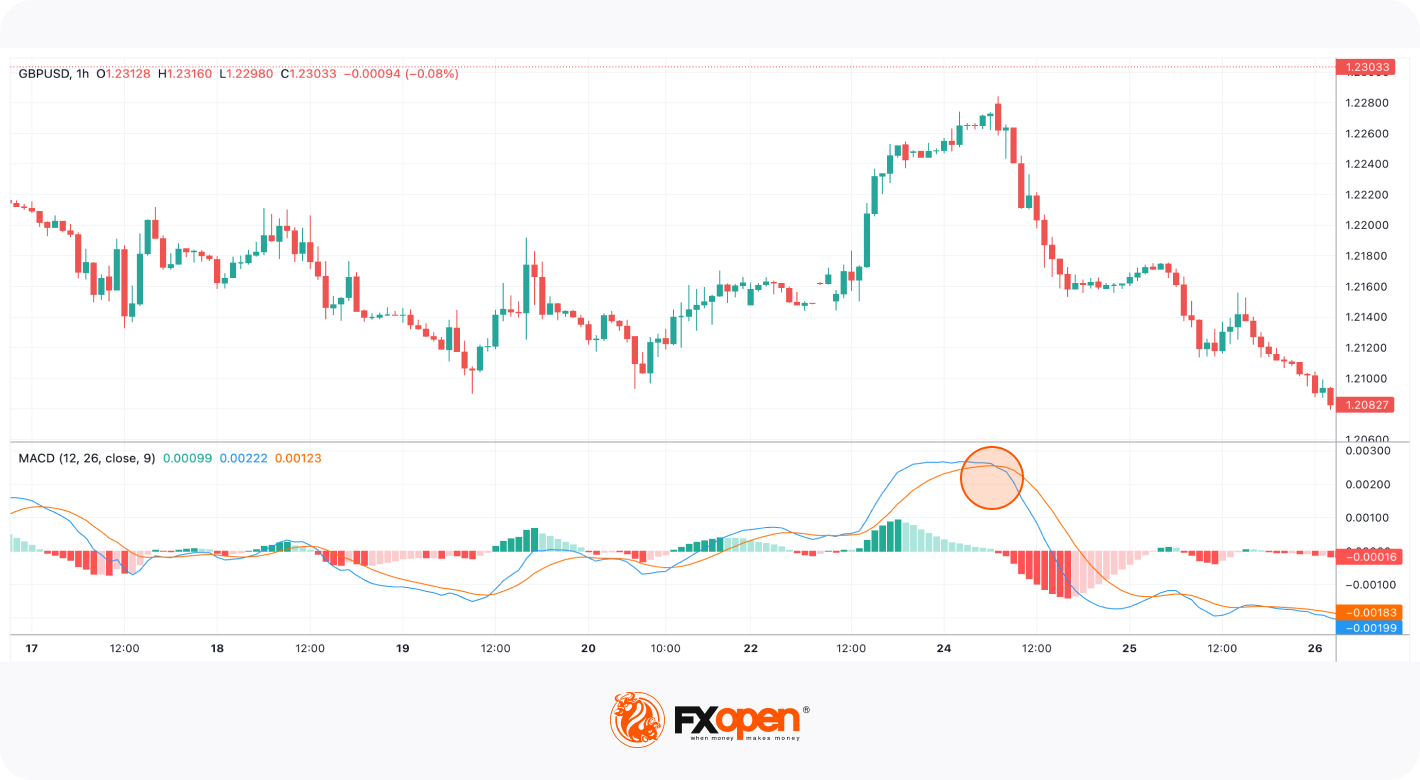
3. Zero Line Crossover
The zero line serves as a reference point and is used to identify bullish and bearish signals. The zero-line crossover occurs when the MACD line crosses the zero line.
Bullish Zero-Line Crossover
This occurs when the MACD line crosses above the zero line from below. It is considered a bullish signal and suggests that the short-term EMA is moving above the long-term EMA, indicating potential upward momentum in the price. Traders often interpret this as an entry to buy or enter a long position.
Bearish Zero-Line Crossover
This occurs when the MACD line crosses below the zero line from above. It is considered a bearish signal and suggests that the short-term EMA is moving below the long-term EMA, indicating potential downward momentum in the price. Traders often interpret this as an entry to sell or enter a short position.
It's essential to note that the Moving Average Convergence Divergence is most effective when used in conjunction with other technical analysis tools.
How to Combine the MACD with Other Technical Analysis Tools
Combining the Moving Average Convergence Divergence with other technical analysis tools can help traders gain a comprehensive view of market trends and potential entry or exit points. Here are popular indicators that fit the description stated:
Relative Strength Index (RSI)
When the MACD shows a divergence with price and the RSI is also in overbought or oversold territory, it can signal a potential reversal. For example, if the histogram is making lower highs while the price is making higher highs, and the RSI is in overbought territory, it might be a signal that the current trend is losing momentum.
Bollinger Bands
When the Moving Average Convergence Divergence generates a signal, look at the Bollinger Bands. If the bands are narrowing (indicating low volatility) and the moving average generates a crossover signal, it may suggest an imminent price breakout or strong trend.
When the price touches or exceeds the upper Bollinger Band and the MACD histogram sets significant peaks (diverging from the price), it may suggest that the security is overbought. Conversely, when the price touches or falls below the lower Bollinger Band and the MACD histogram sets dramatic lows, it may indicate an oversold condition.
Moving Averages (MA)
A moving average is a trend-following lagging indicator that is used by traders to define market trends and their reversals. You can use a longer-term moving average (e.g., 200-period SMA). If the MACD crossover aligns with the direction of the long-term moving average, it can provide a stronger confirmation signal for traders. Moving average trading is common in stock and forex markets.
Remember that no single indicator is foolproof. You can always try out FXOpen’s TickTrader to practise combination with other technical tools, like support and resistance levels, to make more informed trading decisions.
Conclusion
So that's it! The MACD indicator plays a vital role in identifying price momentum and trend direction. Traders with experience often use it to spot divergences for more informed decision-making in financial markets. When integrated into a broader technical analysis toolkit, this indicator can enhance one's ability to navigate the complexities of trading.
To put your knowledge into practice, you can open an FXOpen account today and enhance your trading strategy. Your path to successful trading begins here.
*At FXOpen UK and FXOpen AU, Cryptocurrency CFDs are only available for trading by those clients categorised as Professional clients under FCA Rules and Professional clients under ASIC Rules, respectively. They are not available for trading by Retail clients.
This article represents the opinion of the Companies operating under the FXOpen brand only. It is not to be construed as an offer, solicitation, or recommendation with respect to products and services provided by the Companies operating under the FXOpen brand, nor is it to be considered financial advice.
Stay ahead of the market!
Subscribe now to our mailing list and receive the latest market news and insights delivered directly to your inbox.


Latest articles

Intel at a Crossroads: Earnings Beat Meets Technical Resistance
Intel has just delivered its strongest quarter in over fifteen years, and the market reaction says it all. Q2 2026 revenue surged 25% year-over-year to $16.1 billion, crushing the consensus estimate of $14.42 billion, while adjusted EPS of

Tesla: Complex Range Structure Breaks Down Following Quarterly Earnings
Tesla released its Q2 2026 results after the market closed on 22 July. Revenue increased 26% year-on-year to $28.24 billion, while vehicle deliveries reached a record 480,126 units. However, operating margin fell sharply to 1.4%, down from

Pound Weakens After Soft UK Inflation Data as Euro Awaits Fresh Market Signals
The pound remains under pressure following the release of weaker-than-expected UK inflation data. The slowdown in inflation has strengthened expectations that the Bank of England could adopt a more accommodative policy stance in the coming months, weighing on sterling. Meanwhile,