


What Is a Volume-Weighted Moving Average (VWMA)?
FXOpen
Moving averages (MAs) are among the most used indicators in technical analysis by new and experienced traders alike, as they allow us to smooth out data and identify potential trading opportunities.
The volume-weighted moving average (VWMA) is a type of MA that puts more weight on particular prices. But what is a VWMA indicator? In this FXOpen article, we will explore the topic and look at some examples of how you can interpret and use it in your trading.
What Is a Volume-Weighted Moving Average?
Unlike the simple moving average (SMA) and exponential moving average (EMA), which only take pricing data into account, the volume-weighted moving average incorporates data on the volume of the trades into an MA calculation. It calculates the average pricing of an asset over a specified period, weighting each data point by its corresponding trading volume, which means that periods with higher trading activity have a greater influence on the MA value. For instance, if the volume on the third day of a period is higher than on the other days, the closing value will have more of an influence on the average value.
This is designed to provide a more accurate picture of market trends, as periods with higher volumes are seen as more significant in terms of market sentiment.
How Is the VWMA Calculated?
The VWMA formula is as follows:
VWMA = Sum of (Closing Price x Volume) / Sum of Volume
As shown in the formula above, the calculation involves multiplying the asset price for each period by its volume. The values are then added together to find the cumulative total. That total is then divided by the total volume.
Trading platforms like TickTrader provide an automatically calculated indicator that you can apply to charts without having to do the calculation manually.
VWMA vs VWAP vs SMA
The SMA is a basic indicator calculated as an average of the prices over a specific period that gives the same weight to each data point. The VWMA adds volume to the formula, making it easier to determine the market’s momentum. Therefore, in periods when there is heavy trading activity, the VWMA follows the price more closely than the SMA; however, on days when volumes are lower, it acts similarly to the SMA.
The volume-weighted moving average is often confused with the volume-weighted average price (VWAP), but they are two separate indicators that are created and used differently. The main difference between the volume-weighted moving average and the VWAP is that the VWAP is best suited to intraday trading as it is based on the average price for the day (high, low, and close) multiplied by the volume from the beginning of a new day. At the same time, the VWMA focuses only on closing prices and the volume for each period. Traders usually use the VWAP to determine whether an asset is trading above or below its average price.
How to Use the VWMA in Trading
You can use the indicator in various ways to help develop your trading strategies, including tracking the relationship between pricing and volume, determining weighted volumes in relation to market trends, and highlighting signals based on volumes.
Once you have identified trends, you can develop a VWMA strategy to inform you how to manage your trading positions.
Trend Trading with VWMA
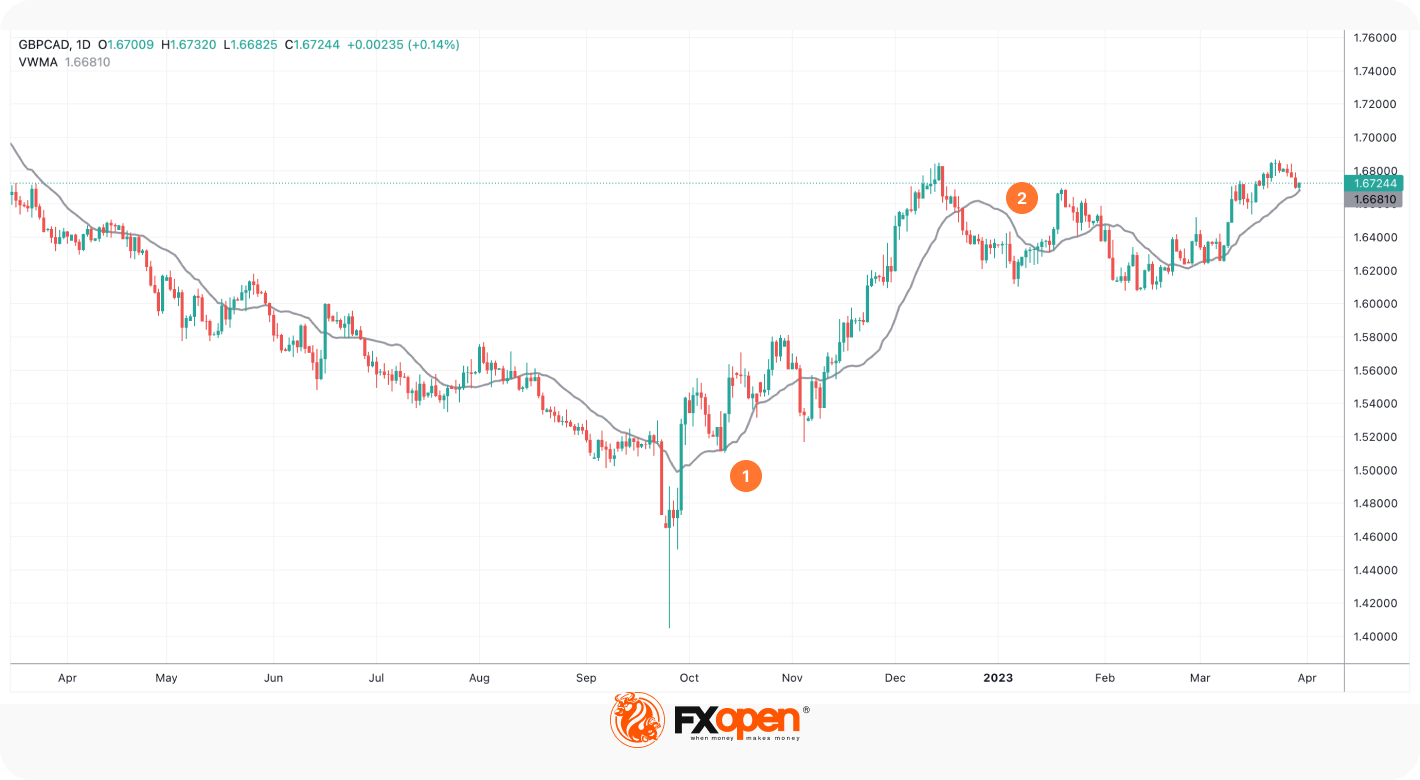
Like with other moving averages, the VWMA moves below the price in an uptrend and above the price in a downtrend.
For instance, if you identify a bullish trend (1), you might use the VWMA to open and manage a long position, placing a stop loss just below the line. Moreover, the VWMA can act as a trailing stop loss. If the price drops and the indicator moves above the price (2), it suggests that the momentum is weakening, and you might consider exiting the trade. However, it’s vital to confirm each signal as VWMA crosses the price frequently.
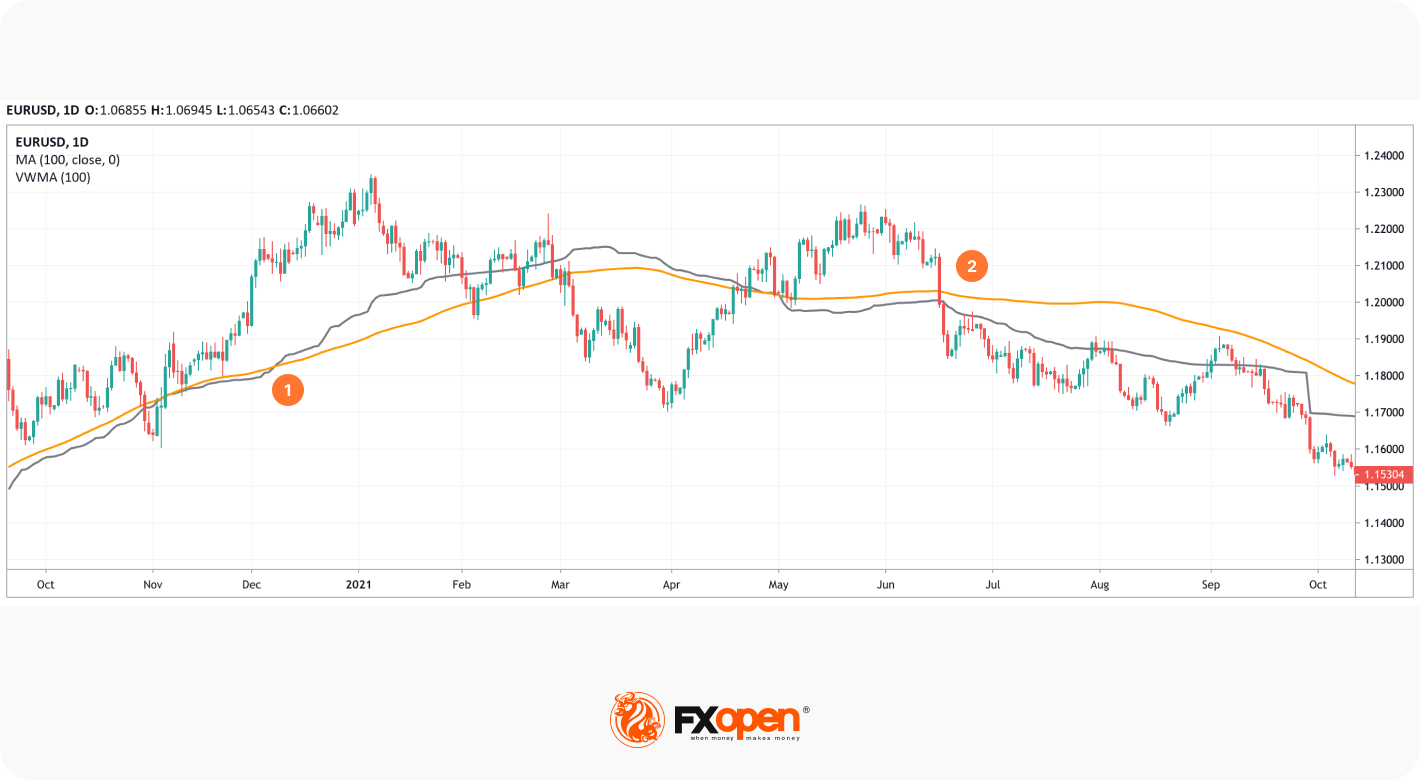
Another option is to combine the VWMA and SMA of the same period. If the SMA (grey) breaks above the VWMA (orange) and both MAs are below the price, it’s a sign the strength of bulls is high (1), and it’s more likely the price will rise. Conversely, if the SMA falls below the VWMA, while both lines are above the price, the strength of bears is higher, and the price is expected to fall (2).
Special Consideration
Sometimes the SMA and VWMA move too close to each other and constantly cross each other, making it impossible to identify the trend.
It’s important never to use a single indicator to make a trading decision but instead to compare different tools for confirmation of trends and trade signals. For instance, if you observe the VWMA trending higher, you could look for candlestick continuation patterns, such as a hammer or bullish engulfing pattern, to confirm the sentiment. If the indicator turns downwards, you could look for reversal chart patterns, such as head and shoulders or a bearish engulfing pattern, for confirmation.

In the chart above, the price formed a bearish head and shoulders pattern, which confirmed a trend reversal.
Find Weakening Trends
The VWMA can identify when trends weaken. To get the most out of the VWMA, you can use it together with the SMA for the same period to highlight trading signals. As the SMA does not include weighting, by comparing the two, you can see the impact of different trading volumes.
The SMA will provide a baseline, with the VWMA acting as a more sensitive indicator that highlights changes in market sentiment. The gap between the two lines highlights the weighting effect.
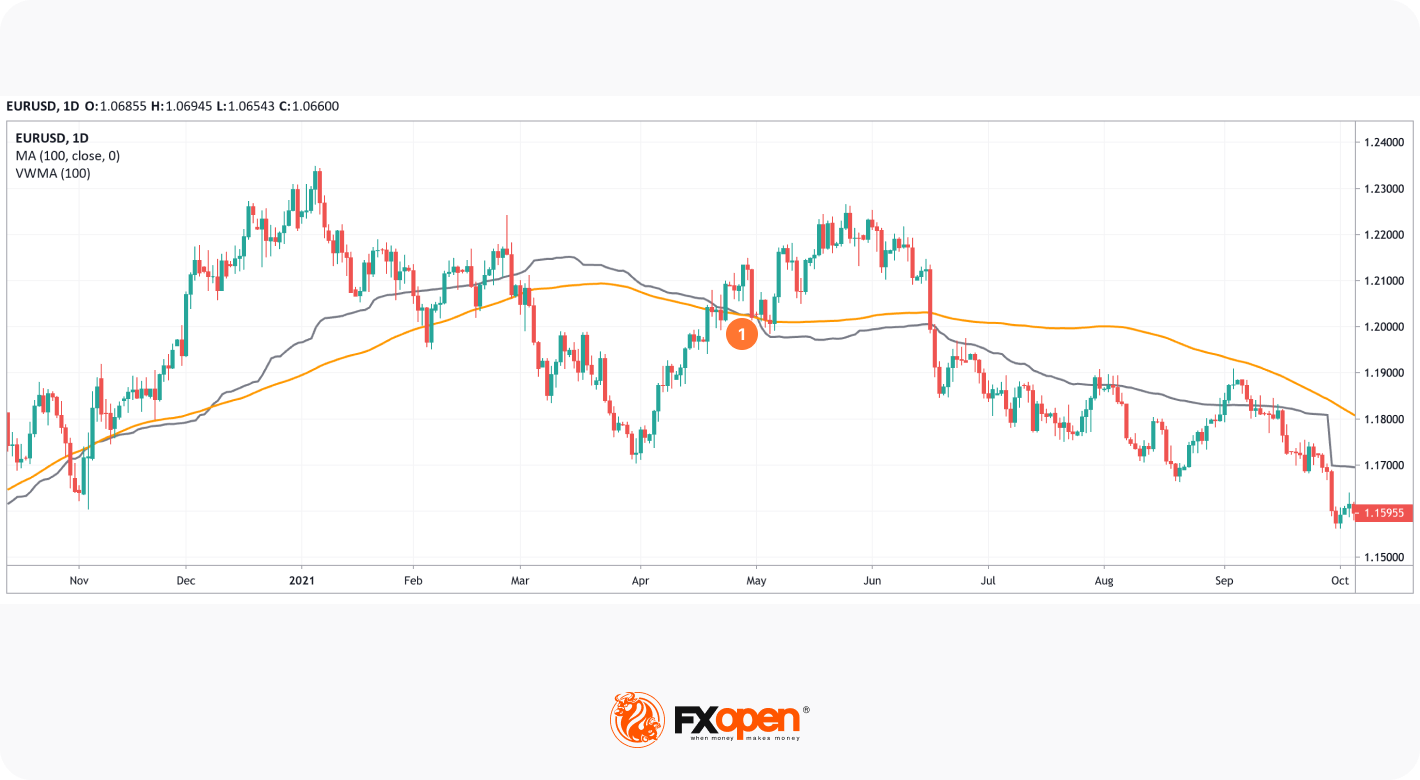
This can be analysed with simple and volume-weighted MAs of the same period. When the VWMA is below the SMA in an uptrend, it’s a sign that bulls are strong. Therefore, when the VWMA rises above the SMA, but the price continues to rise, there is a high possibility the price will either consolidate for a while or change the overall direction as the VWMA indicates that the bulls lack support from the trading volume (1). Conversely, if it moves below the SMA in the downtrend, it’s a sign bears lack support, and the price may either consolidate or rise soon.
Note: moving averages, regardless of their types, are lagging indicators, so they provide delayed signals and can’t be used solely to identify a price movement.
Takeaway
The volume-weighted moving average (VWMA) is a powerful technical analysis indicator that incorporates trading volumes into pricing data to give traders a clear view of the momentum behind market trends. Traders can use the indicator to various ends, including to confirm trends, find support and resistance, and spot trade divergences.
By combining the average with other indicators and price action signals, traders can develop strategies that help them navigate volatile markets. You can open an FXOpen account to learn how to trade with the VWMA indicator on our live charts.
This article represents the opinion of the Companies operating under the FXOpen brand only. It is not to be construed as an offer, solicitation, or recommendation with respect to products and services provided by the Companies operating under the FXOpen brand, nor is it to be considered financial advice.
Stay ahead of the market!
Subscribe now to our mailing list and receive the latest market news and insights delivered directly to your inbox.


Latest articles

Pound Weakens After Soft UK Inflation Data as Euro Awaits Fresh Market Signals
The pound remains under pressure following the release of weaker-than-expected UK inflation data. The slowdown in inflation has strengthened expectations that the Bank of England could adopt a more accommodative policy stance in the coming months, weighing on sterling. Meanwhile,

Alphabet: Record Profit as Markets Await Their Verdict
On 22 July, Alphabet reported its Q2 2026 results, with revenue rising 24% year-on-year to $119.8 billion. Google Cloud revenue surged 82% to $24.77 billion, comfortably exceeding analysts' expectations. Search advertising generated $63.3 billion in revenue (+17%

NZD/USD Analysis: A Tug-of-War at the Critical Level
The kiwi has strengthened meaningfully against most peers this month. However, against the US dollar specifically, NZD/USD remains well below its 2026 highs, trading in the mid-0.58 area versus January's peak near 0.6075.
New Zealand's Q2 inflation