


What Is a Weighted Moving Average and How Do You Calculate it?
FXOpen
Moving averages (MAs) are technical analysis indicators that traders use to filter out the noise of price movements and identify trends. The weighted moving average (WMA) is one form of the MA indicator that traders often prefer to a simple moving average (SMA).
What is a weighted moving average? How does it differ from a simple MA? In this FXOpen guide, we provide a weighted moving average definition, explain how to calculate a weighted moving average, and set out how you can use it in your trading.
What Is the Weighted Moving Average (WMA)?
The weighted moving average is an MA that assigns a weighting to the latest price data so that the most recent prices have a stronger influence over the value than older ones. By giving greater emphasis to recent prices, it tends to be more accurate than a simple MA, which gives equal weight to each data point.
The indicator is designed to smooth out the way in which volatile price action is displayed on a chart to make it easier to identify the market direction.
The WMA indicator is displayed on a price chart, with each data point creating a line that shows you how the asset has moved on average over a specified period. As it is based on past pricing data, the MA is a lagging indicator that shows the trend with a delay compared with the underlying movement.
How to Calculate the Weighted Moving Average
Most trading platforms, such as TickTrader, provide automatic calculations to allow you to apply the indicator to the price chart, so you don’t need to use the weighted moving average formula manually. Still, it is useful to understand how to calculate the WMA so that you can adjust it as needed and use it to develop your trading strategies for different assets.
WMA formula is:

N – number of periods.
Most WMAs give greater weighting to the most recent prices because they are the most relevant to current market activity, but the WMA formula can also be customised to give past data greater weighting if you are analysing long-term trends or want to minimise the effect of recent volatility.
Calculating the Weighted Moving Average: Example
As an example, a 3-period weighted moving average would give a weighting of 3 to the most recent closing value on the third day and 1 to the first day’s closing value.
If a stock closed at $100, $98, and $102 over a period of three days, the calculation would be based on a weighting of 3 for the close at $102 on the most recent day, 2 for the $98 close on the second most recent day and 1 for the first close at $100. The calculation would be:
- [(3 x 10²) + (2 x 98) + (1 x 100)] = 602.
- 3 * (3+1)/2 = 6
- 602/6 = 100.33.
The 3-period WMA = 100.33
Weighted Moving Average vs Simple Moving Average
The WMA and SMA are both commonly used in technical analysis. The main difference between the two is that the SMA applies equal weighting to all price points, while the WMA assigns specific weights to each point.
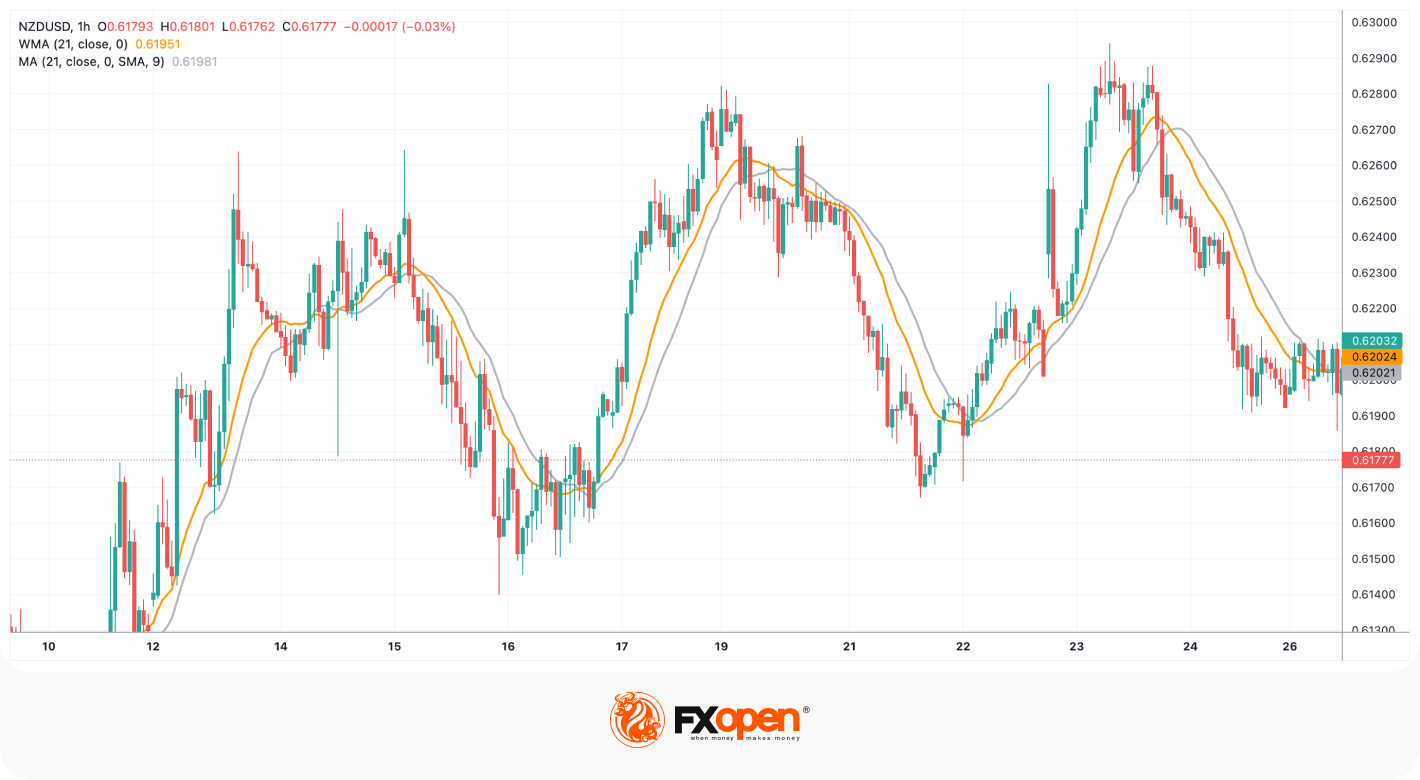
While both averages are useful for identifying a market’s direction, as shown in the chart, the WMA (orange) tends to be more sensitive to price movement and closer to the underlying asset than the SMA (grey). As the WMA value reflects the importance of each data point, it is more descriptive of the trend than the SMA. This can help you to identify prevailing trends and changes in direction sooner than with the SMA; however, it is possible for the WMA to experience more whipsaws than the SMA.
Weighted Moving Average vs Exponential Moving Average
Weighted and exponential moving averages are often confused as both add more weight to the most recent price data. The difference is that the WMA reduces the weighting in a linear fashion, while the EMA reduces it exponentially. For example, in the WMA, every preceding weight is 0.5 smaller than the following, while in the EMA, the difference between weighting may vary significantly so that there may be a difference of 0.5 followed by a difference of 0.8.
As the latest price has the greatest impact on the EMA value, this moving average is considered more responsive to price changes (grey). However, you should remember that high sensitivity can be damaging in terms of your trading decisions when used in highly volatile markets.

More about simple, exponential, and weighted moving averages can be found here.
How to Use the WMA Indicator
You can use this indicator to identify price trends and generate trade signals, helping you to develop trading strategies and decide when to enter and exit positions. Keep in mind, however, that since it is based on past data, the weighted moving average is not used in forecasting new trends.
Determine Trend Direction

The same rules that apply to the simple MA apply to the weighted MA. But the weighted moving average is typically more sensitive to price movements than the SMA, which some traders find more relevant in fast-moving markets.
MAs are not designed to identify the exact top or bottom of a trend to enter and exit a trade. Rather, the aim is to validate the general direction of the movement. If the WMA line on a chart is rising and the price is above it, it indicates the asset is in an upward trend. If the line is falling and the price is below it, it indicates the asset is in a downward trend.
You might take the line as an indication to buy when the price rises above the line (1) and then sell when prices move below the line (2).
You might take a long-term WMA, such as a 50-day or a 200-day to identify a long-term trend and a short-term WMA, such as a 10-day or 20-day, to identify short-term price swings.
The limitation of the WMA is that because it tends to be choppier than the SMA, it can make it more difficult to separate a genuine trend from a random fluctuation, resulting in a false trade signal. To avoid this, you could place both indicators on the same chart to give you a clearer view.
Find Support and Resistance Areas
MAs can help you identify support and resistance areas to suggest when a trend might reverse direction.
A rising weighted MA tends to act as dynamic support to the asset’s value, whereas a falling one tends to act as a form of dynamic resistance. Therefore, you could use the indicator as a signal to buy when the price is approaching a rising line and sell near a falling line. You might opt to set a limit order at the WMA level or wait until the price touches the level and moves back to confirm the trend.

Takeaway
The weighted MA indicator is important in technical analysis as it helps traders identify the direction of trends and gives them potential buy and sell signals. It is useful alongside the simple MA as a way to confirm trends, as it is more responsive to recent price action. You can open an FXOpen account to practise using the indicator on live price charts.
This article represents the opinion of the Companies operating under the FXOpen brand only. It is not to be construed as an offer, solicitation, or recommendation with respect to products and services provided by the Companies operating under the FXOpen brand, nor is it to be considered financial advice.
Stay ahead of the market!
Subscribe now to our mailing list and receive the latest market news and insights delivered directly to your inbox.


Latest articles

Nasdaq 100: 48 Hours of Chaos, One Trendline Standing in the Way
Wall Street just lived through one of its wildest 48 hours of the year. On Wednesday, the Fed held rates steady at 3.50%-3.75%, but three FOMC members broke ranks to demand a hike—an unusually hawkish dissent

Amazon Analysis: Strong Earnings Coincide with a Breakout from the Correction
On 30 July, Amazon.com reported its financial results for the second quarter of 2026, significantly exceeding market expectations. Revenue rose 20% year-on-year to $200.6 billion, compared with the consensus forecast of around $196.5 billion. The main growth

GBP/USD and EUR/GBP Await Key Bank of England Decision
The pound strengthened following the outcome of the US Federal Reserve meeting, where the central bank, as expected, kept interest rates unchanged. However, the Fed did not provide the market with clear signals of an imminent shift towards rate cuts,