


FXOpen
One of the most used technical indicators in trading is the moving average (MA). An MA is a dynamic indicator that traders use to identify price trends and potential trading opportunities in the financial markets. One type of moving average is the EMA. What does EMA stand for? The acronym refers to an exponential moving average.
In this FXOpen article, we'll explore how it differs from a standard moving average, how to calculate the exponential moving average, and how you can use it in trading.
EMA: The Basics
The EMA is a moving average, which gives exponentially more weight to the most recent price data. It helps traders to tune out the noise of market fluctuations to provide a clear view of prevailing trends. This happens because, as with any moving average, when new values are added to the calculation, the oldest values are dropped. Moreover, the exponential moving average responds quickly to sudden changes in direction, as it adds more weight to recent prices.
As with other moving averages, the EMA is represented by a line plotted on the price chart that interacts with prices. You can use different time periods for the EMA, such as 10, 50, and 200. This will depend on your trading approach and the asset you are analysing. Long-term investors tend to look at longer-period EMAs, such as 50- and 200, while short-term traders tend to focus on the 9, 12, and 21 periods.
It’s interesting that the 12- and 26-day exponential moving averages are used to create other indicators, such as the moving average convergence divergence (MACD) and the percentage price oscillator (PPO).
EMA Formula
Trading platforms like TickTrader have an exponential moving average indicator that you can automatically apply to your charts. However, it is useful to know how to calculate an EMA to understand how to read its signals.
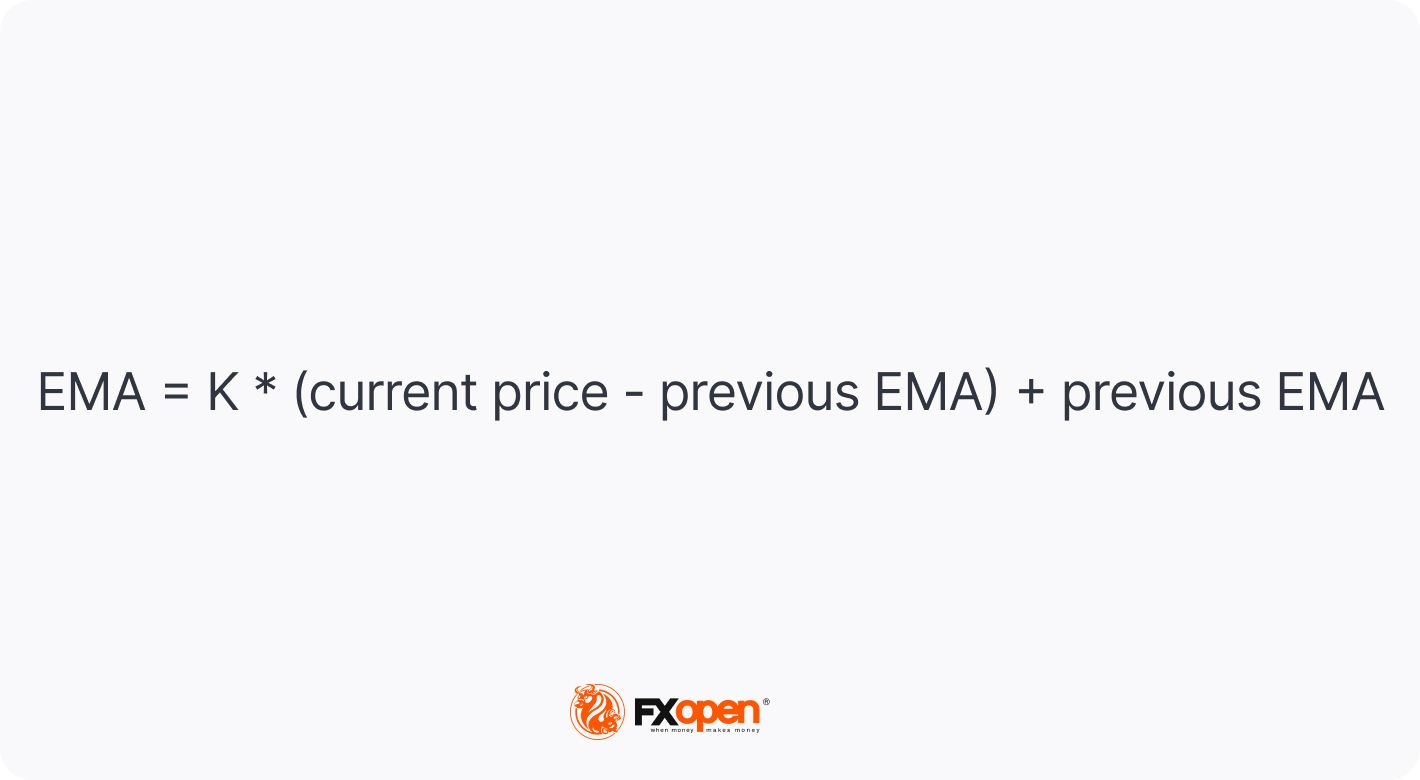
You can find EMA calculators on the internet or use an excel document to do this manually. The exponential moving average formula is the following:
- Calculate the weighting multiplier (K) by taking 2 divided by the number of periods plus 1.
- Calculate the EMA by subtracting the previous period’s EMA from the closing price, multiplying it by K, and then adding the previous EMA.
Simple vs Exponential Moving Averages
The main difference between a simple moving average (SMA) and an exponential MA is how the average price is calculated. The simple moving average is calculated by taking the arithmetic mean of a set of prices. For instance, to calculate the 10-day SMA for a stock, you add up the closing prices of a stock over the last 10 days and divide the total by 10.
Although this is easy to calculate and understand, the SMA has its limitations in that each data point is given equal weight, regardless of how old it is. This means that the SMA tends to be slow to react to sharp trend reversals, which can put traders at a disadvantage in volatile markets.
In contrast, by adding a weighting multiplier, EMA technical analysis is more responsive and may be better suited to trading in volatile markets or on short-term timeframes. The EMA is very popular among traders who favour short-term strategies, such as day trading.
As the exponential MA line on a chart follows an asset price more closely, it reduces the lag seen in the SMA and helps traders to capitalise on trading opportunities as quickly as possible.
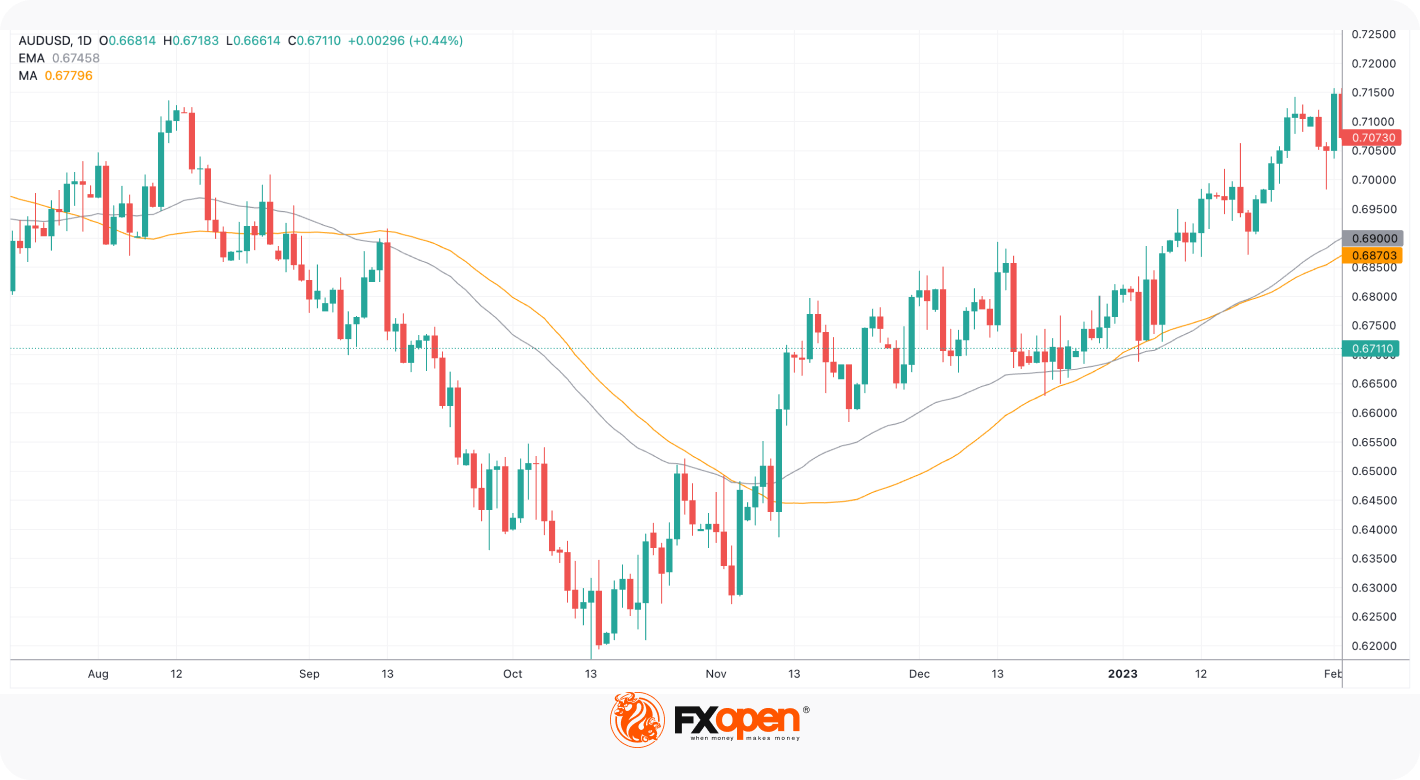
Below you can see how SMA and EMA interact with prices.
How to Read the EMA Indicator
Charting the exponential MA can help you to develop your trading strategies. The indicator tells you whether the value of an asset is rising or falling and highlights recent swings.
When the price is above the EMA line, it is considered to be in a bullish trend, whereas when it is below the line, it's considered to be in a bearish trend. As the indicator is based on historical data, it does not predict future movements but can still provide buy and sell signals.
How to Use the EMA In Trading
What is the EMA used for in practice? You can apply the indicator to all financial markets, including forex, stocks, commodities, and cryptocurrencies*.
Identify the Direction of a Trend
This greater weight given to recent data is useful when analysing volatile markets, where there may be abrupt changes in the price. This is particularly useful if you are trading intraday or highly volatile assets.
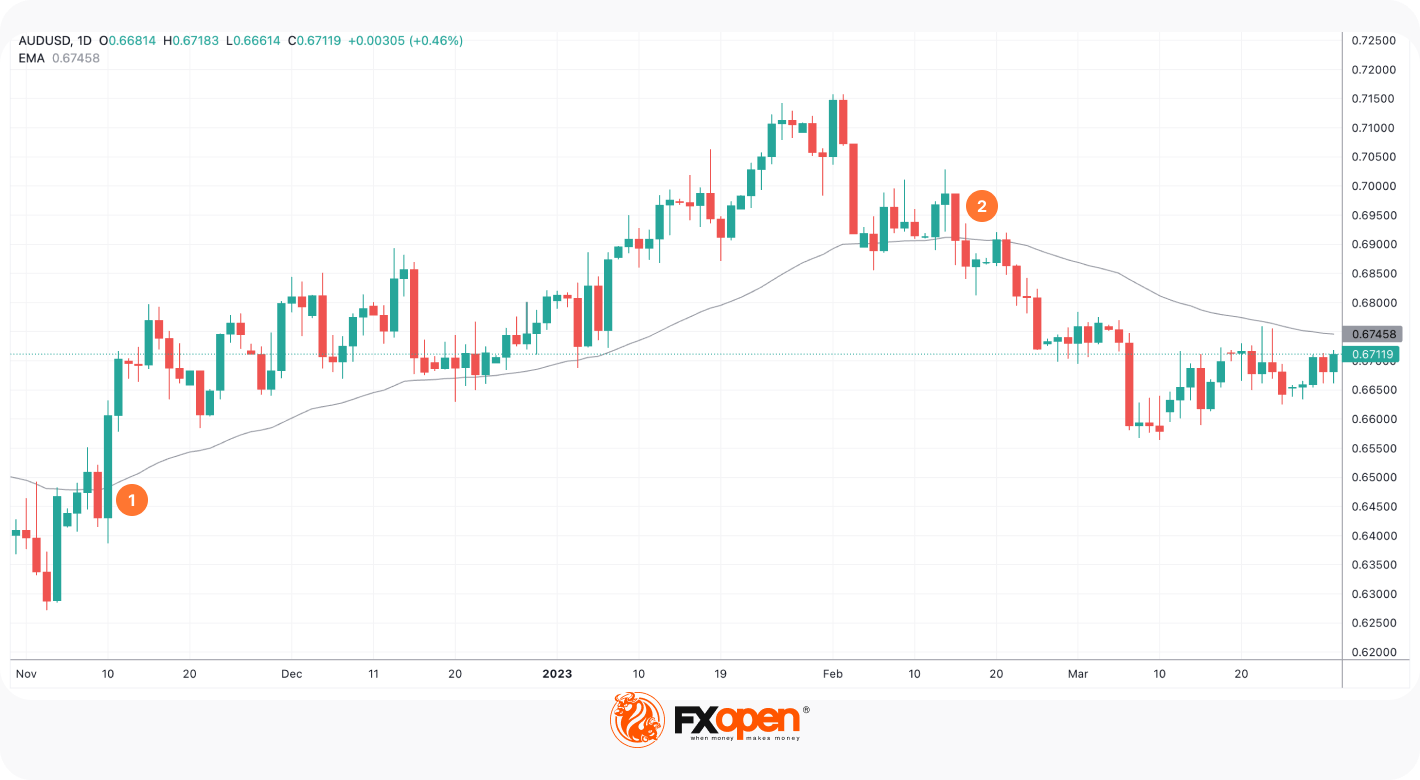
If the exponential MA is sloping higher, it suggests that the asset is in an upward trend. When the value on a chart crosses above the EMA line (1), it is considered a bullish signal, indicating that the asset could continue rising.
If the EMA slopes downward, it indicates the price is falling. When the price moves below the line (2), it is a bearish signal indicating that the asset could fall further, and you might use this as an indicator to sell.
Place Potential Support and Resistance Levels
The exponential MA can help you identify support and resistance levels. When the line is below the price in an upward trend, it serves as support, and when it is above the price in a downward trend, it serves as resistance.
If it has been acting as support for the price, you could buy when it reaches the line in the expectation that it will rebound and move higher. Conversely, if the EMA acts as resistance, you can sell the asset when it reaches the line expecting the price to bounce off the EMA.

The chart shows a price initially rebounding off the EMA as resistance. This is followed by the point at which the price rises above the resistance level, with the line becoming a support level at which the price bounces off.
Determine Potential Buy and Sell Signals
Crossovers in the exponential MA lines from different periods also give buy and sell signals. For instance, if a shorter-term EMA line for a stock crosses above a longer-term line, this is considered a bullish signal, and you might consider opening a long position (1). This is a so-called golden cross. Conversely, a shorter-term average crossing below the longer-term is considered a bearish signal, and you might consider selling (2). This is a death cross.

Example of EMA Trading
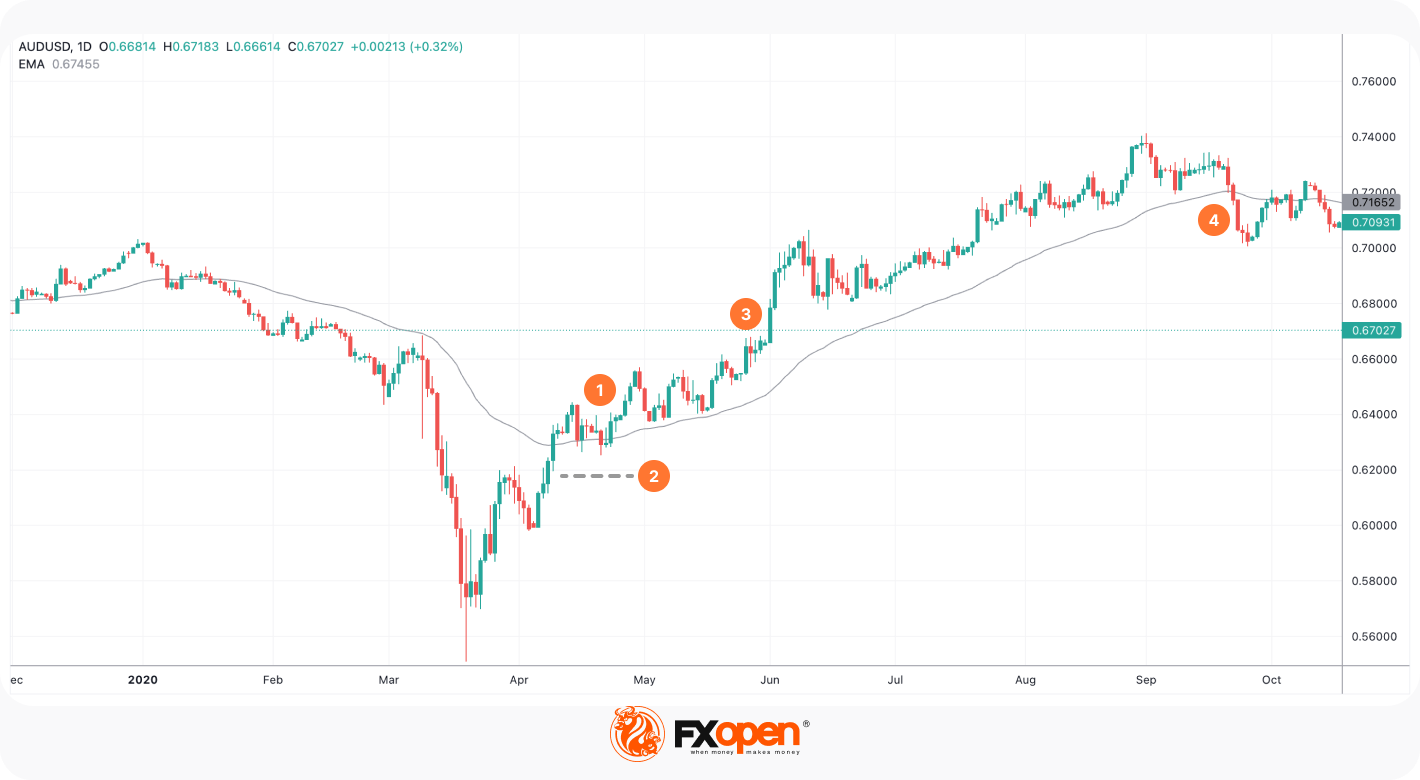
If you have been tracking an asset for a potential trade and want to use the EMA stock indicator to identify potential entry and exit points, look at the chart to see whether it is in an upward or downward trend.
If, for example, the asset is in an uptrend, you could wait for a pullback before opening a long position (1). If there is a crossover, it is a bullish signal to buy. You could set a stop-loss just below the recent low (2) and a profit target based on your risk-reward ratio or at the nearest highs (3). If the price continues to rise and the EMA also rises, the trend remains intact. You could hold the position open until the price crosses below the EMA, meaning that the trend has ended (4). You could then sell and take profit on the trade.
Limitations of the EMA
While the exponential MA is a useful indicator for traders, it is not without its limitations. While some traders view the weighting to more recent data as a better reflection of the current trend, others argue that it creates a recency bias that can give false price signals, particularly in volatile markets.
The exponential MA is a lagging indicator, so it can not account for unexpected events that could cause the price to change direction suddenly.
Remember: Trading indicators don’t work solely. The exponential MA is just one indicator that traders use. They combine it with other tools and consider other factors, such as news events and broader market trends, before making any trading decisions.
Takeaway
The exponential moving average is a technical indicator that is more responsive to sudden price changes than the simple moving average. You can use it to identify trends, trading opportunities, and buy or sell signals. As with any other technical indicator, it can be more effective to analyse it in combination with other indicators before taking a trading position. Now you can open an FXOpen account to practise using the indicator on live charts.
*At FXOpen UK and FXOpen AU, Cryptocurrency CFDs are only available for trading by those clients categorised as Professional clients under FCA Rules and Professional clients under ASIC Rules, respectively. They are not available for trading by Retail clients.
This article represents the opinion of the Companies operating under the FXOpen brand only. It is not to be construed as an offer, solicitation, or recommendation with respect to products and services provided by the Companies operating under the FXOpen brand, nor is it to be considered financial advice.
Stay ahead of the market!
Subscribe now to our mailing list and receive the latest market news and insights delivered directly to your inbox.

Latest from Trader’s Tools
Latest articles

Weekly Market Wrap With Gary Thomson: Nasdaq, EUR/USD, USD/CHF, Brent Crude Oil, Googl Shares
Get the latest scoop on the week's hottest headlines, all in one convenient video. Join Gary Thomson, the COO of FXOpen UK, as he breaks down the most significant news reports and shares his expert insights.
- Nasdaq Composite: Worst Session

Analysis of AUD/USD: Exchange Rate Falls to Early May Low
As indicated by the 4-hour AUD/USD chart today:
→ the rate fell below 0.652, a level last seen on May 2;
→ the RSI indicator dropped below 15, a level last seen during the panic over the spread of COVID-19

Analysis of AMZN Stock: Price at 1.5-Month Low
As shown in the AMZN chart, the stock price dropped below:
→ the psychological level of $180;
→ the mid-June interim low.
The last time AMZN traded below $180 was in early June.
Thus, AMZN has faced sell-offs, similar to other tech