


What Are Inverse Fair Value Gaps (IFVGs) in Trading?
FXOpen
Price doesn’t just move up or down — it also shows when control in the market changes. An Inverse Fair Value Gap (IFVG) appears when a previous imbalance no longer holds, signalling that buyers and sellers have switched roles, not simply paused. These zones highlight areas where the market has accepted a new price, rather than needing to return to an old one.
For traders who study momentum, market structure, and follow-through, IFVGs add useful context to price behaviour without relying on indicators. This article explains how IFVGs form, how they differ from standard Fair Value Gaps (FVGs), and how they are used in market analysis.
Takeaways
- An Inverse Fair Value Gap is a price zone that forms when a previously valid Fair Value Gap is breached, signalling a shift in price movement.
- IFVGs reflect a change in control, where former buying or selling pressure no longer holds, turning a prior imbalance into a potential reaction zone.
- An Inverted Fair Value Gap is commonly tracked after a clear break through the original Fair Value Gap, often with a close or strong wick beyond the level.
- These zones are typically analysed alongside market structure, momentum, and higher-timeframe bias to frame directional context.
- IFVGs may support market analysis by highlighting where follow-through has replaced mean reversion.
Fair Value Gaps (FVGs) – A Brief Overview
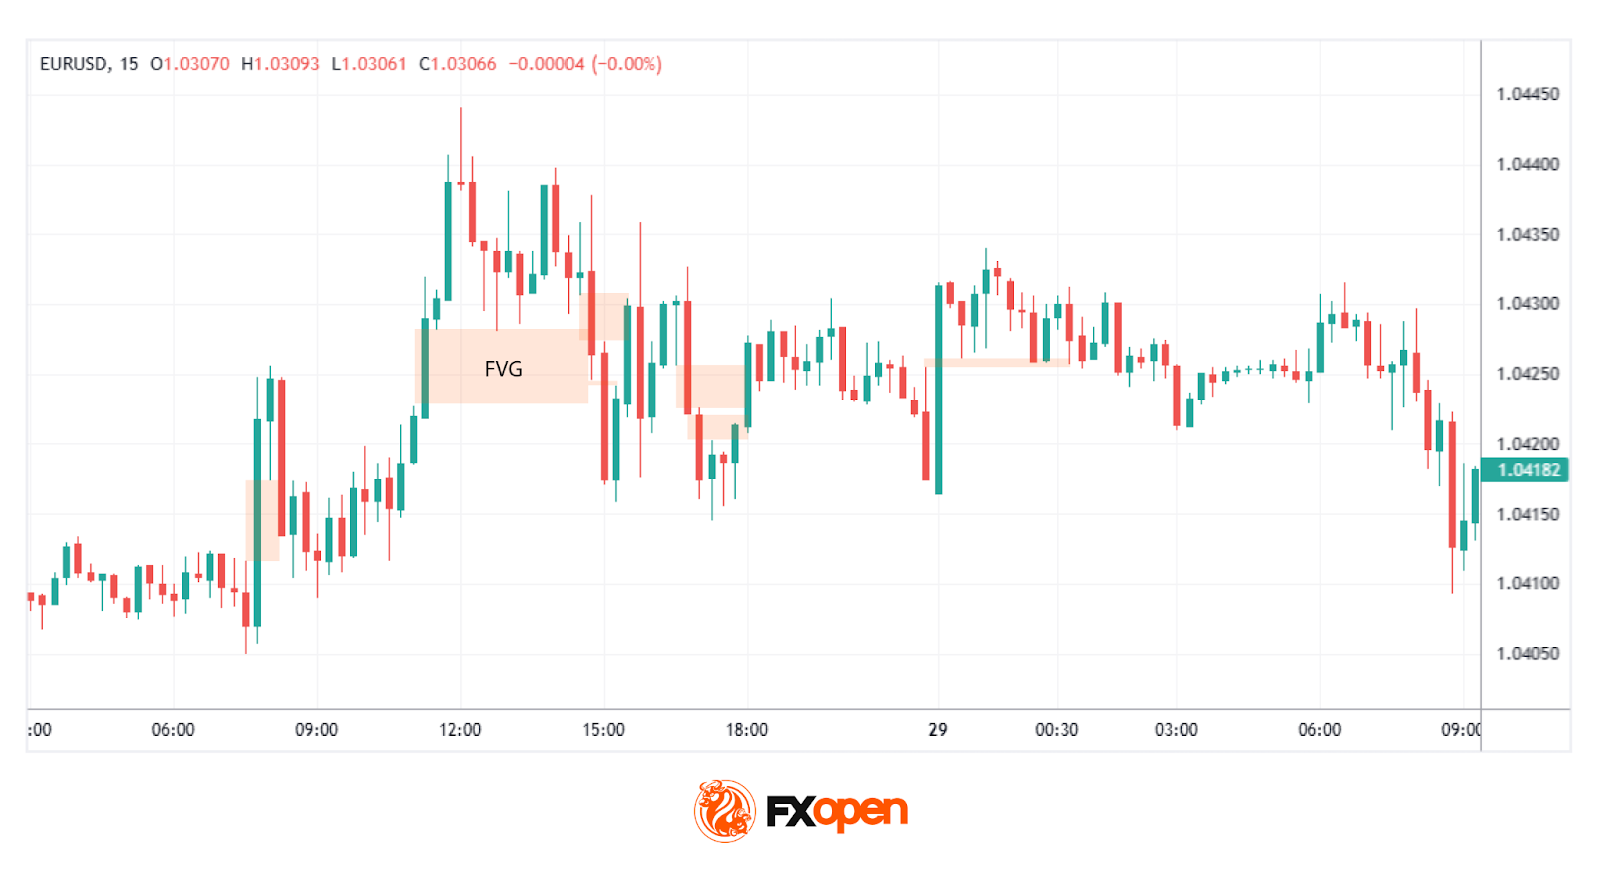
A Fair Value Gap (FVG) occurs when the market moves so rapidly in one direction that it leaves an imbalance in price action. This imbalance shows up on a chart as a gap between three consecutive candles: the wick of the first candle and the wick of the third candle fail to overlap, leaving a “gap” created by the second candle. It highlights an area where buying or selling pressure was so dominant that the market didn’t trade efficiently.
Traders view these gaps as areas of potential interest because markets often revisit these levels to "fill" the imbalance. For example, in a bullish FVG, the gap reflects aggressive buying that outpaced selling, potentially creating a future support zone. On the other hand, bearish FVGs indicate overwhelming selling pressure, which might act as resistance later.
FVGs are closely tied to the concept of fair value. The gap suggests the market may have deviated from a balanced state, making it an area traders watch for signs of price rebalancing. Recognising and understanding these gaps can provide insights into where the price might gravitate in the future, which may help traders assess key zones of interest for analysis.
Understanding Inverse Fair Value Gaps (IFVGs)
An Inverse Fair Value Gap (IFVG), or Inversion Fair Value Gap, is a price zone that forms when an existing Fair Value Gap is broken and no longer holds its original role. At first, a Fair Value Gap is an area where price is likely to react or rebalance. But when price clearly breaks through that gap, it shows the market no longer respects it.
Within the Inner Circle Trader (ICT) framework, this role reversal flips a former resistance-type FVG into potential support, or a former support-type FVG into potential resistance. In simple terms, an IFVG marks where the market has proven that the prior imbalance is no longer respected.
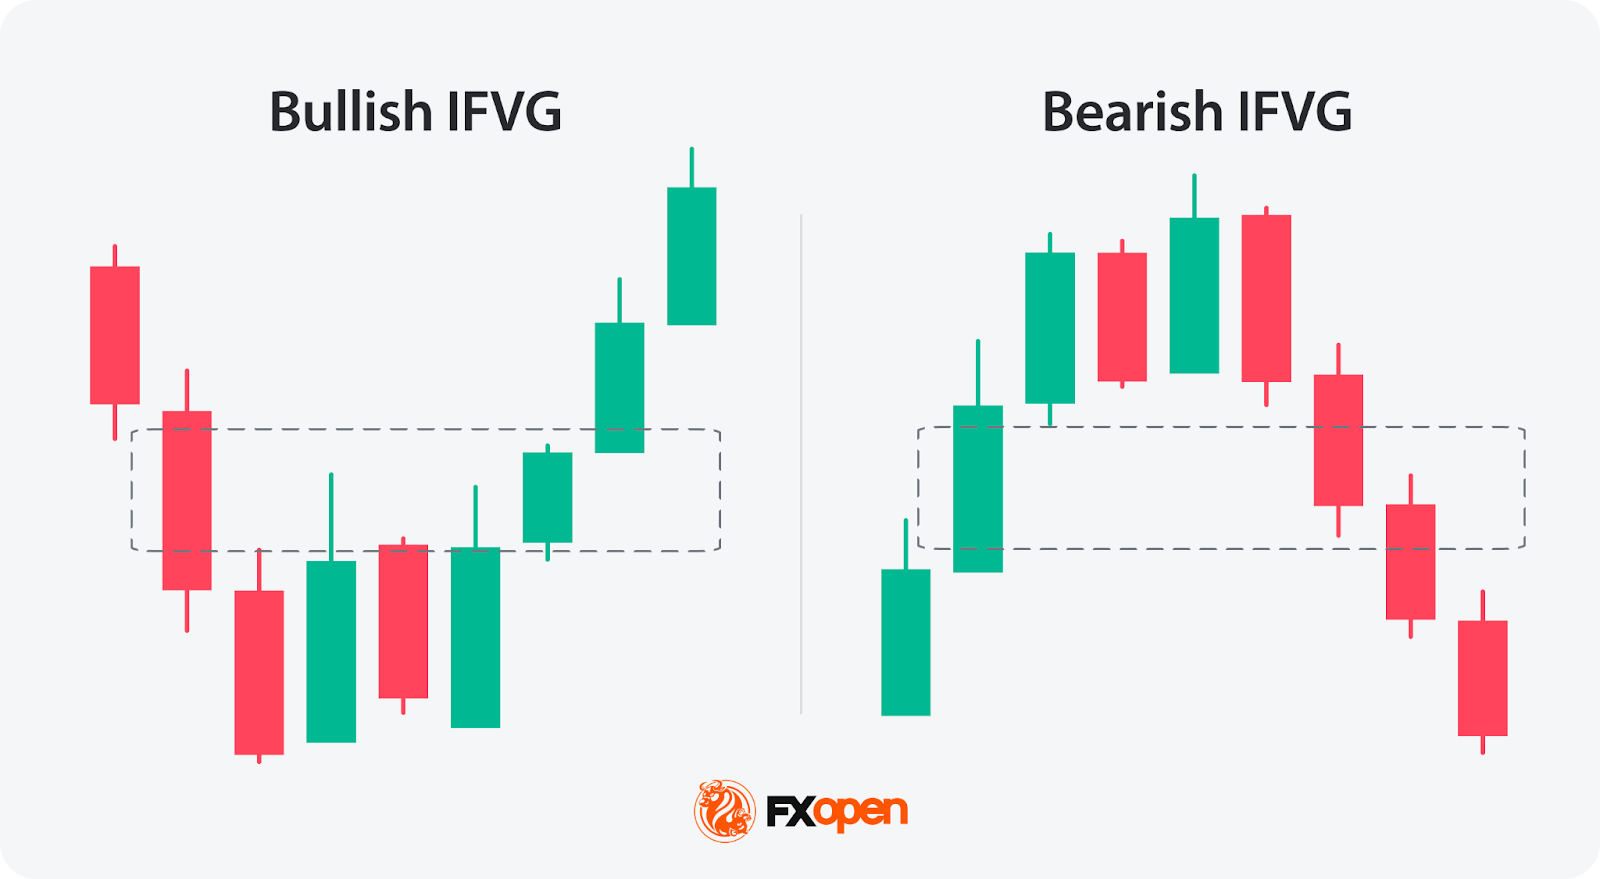
There are two types of IFVG:
- A bullish Inverse Fair Value Gap forms when a bearish Fair Value Gap (FVG) fails. The FVG appears during strong selling pressure and often acts as a resistance zone. If price later pushes through this gap—either by just a wick or closing beyond it—it shows that sellers in that area are no longer in control. Once this happens, the bearish FVG is invalidated and becomes a bullish IFVG, meaning the same zone can now act as potential support.
- A bearish Inverse Fair Value Gap forms when a bullish Fair Value Gap fails. A bullish FVG forms during strong buying pressure and typically acts as support. If the price breaks below it, this signals that buyers have lost control. The bullish FVG is then invalidated and turns into a bearish IFVG, where the zone may act as potential resistance.
In both cases, an IFVG marks a clear shift in market control, rather than a temporary pause in price movement.
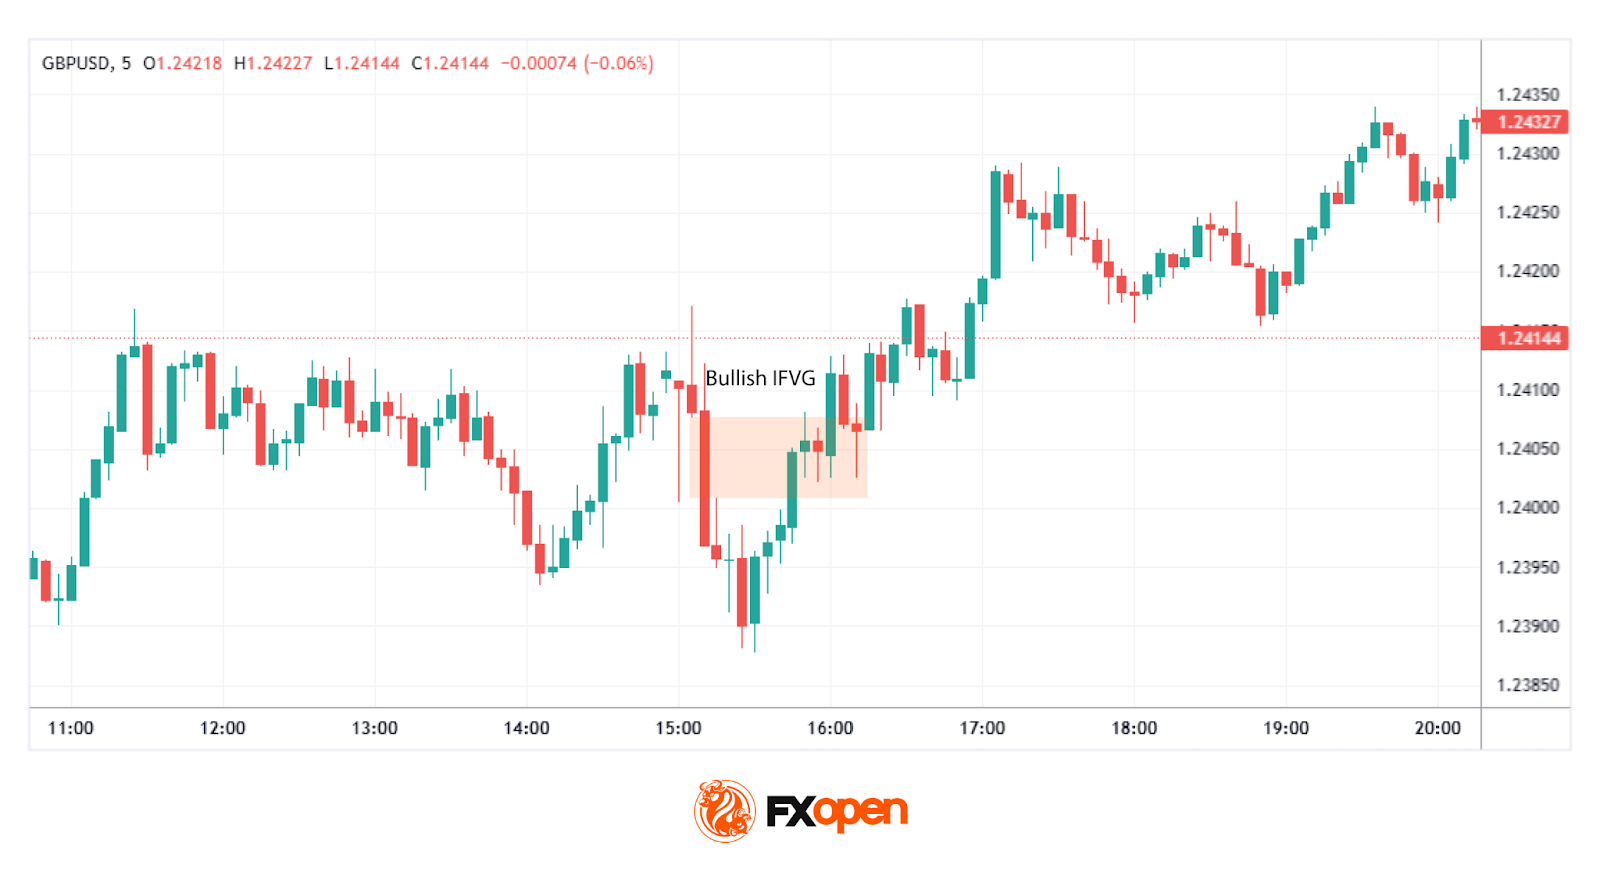
Traders use inverted Fair Value Gaps to identify zones where market sentiment has shifted significantly. For example, when the price revisits a bullish IFVG, it may serve as a zone of interest for traders looking for an entry for a buy trade. However, if the price moves past the bottom of the IFVG zone, it’s no longer valid and is typically disregarded.
What makes these reverse FVGs particularly useful is their ability to highlight moments of structural change in the market. They can act as indicators of strength, revealing areas where price has transitioned from weakness to strength (or vice versa). By integrating IFVG analysis into their broader trading framework, traders can gain deeper insights into the evolving dynamics of supply and demand.
Traders interested in applying IFVG identification techniques in real-time conditions may consider using FXOpen’s TickTrader trading platform that supports advanced charting and analysis tools.
How Traders Use IFVGs
By integrating IFVGs into their strategy, traders can refine their decision-making process and uncover potential setups aligned with their broader market outlook. Here’s how IFVGs are commonly used:
Identifying Key Zones of Interest
Traders begin by spotting FVGs on price charts—areas where rapid movements create imbalances. An inversion FVG forms when such a gap is invalidated; for instance, a bearish FVG becomes bullish if the price breaks above it. These zones are then marked as potential areas of interest, indicating where the market may experience significant activity.
Contextualising Market Sentiment
The formation of an IFVG signals a shift in market sentiment. When a bearish FVG is invalidated and turns into a bullish IFVG, it suggests that selling pressure has diminished and buying interest is gaining momentum. Traders interpret this as a potential reversal point, providing context for the current market dynamics.
Analysing Price Reactions
Once an IFVG is identified, traders monitor how the price interacts with this zone. If the price revisits a bullish IFVG and shows signs of support—such as slowing down its decline or forming bullish candlestick patterns—it may indicate a strengthening upward movement. Conversely, if the price breaches the IFVG without hesitation, the anticipated reversal might not materialise.
How May Inverse Fair Value Gaps Be Traded?
IFVGs provide traders with a structured way to identify and analyse price levels where sentiment has shifted. The process typically looks like this:
1. Establishing Market Bias
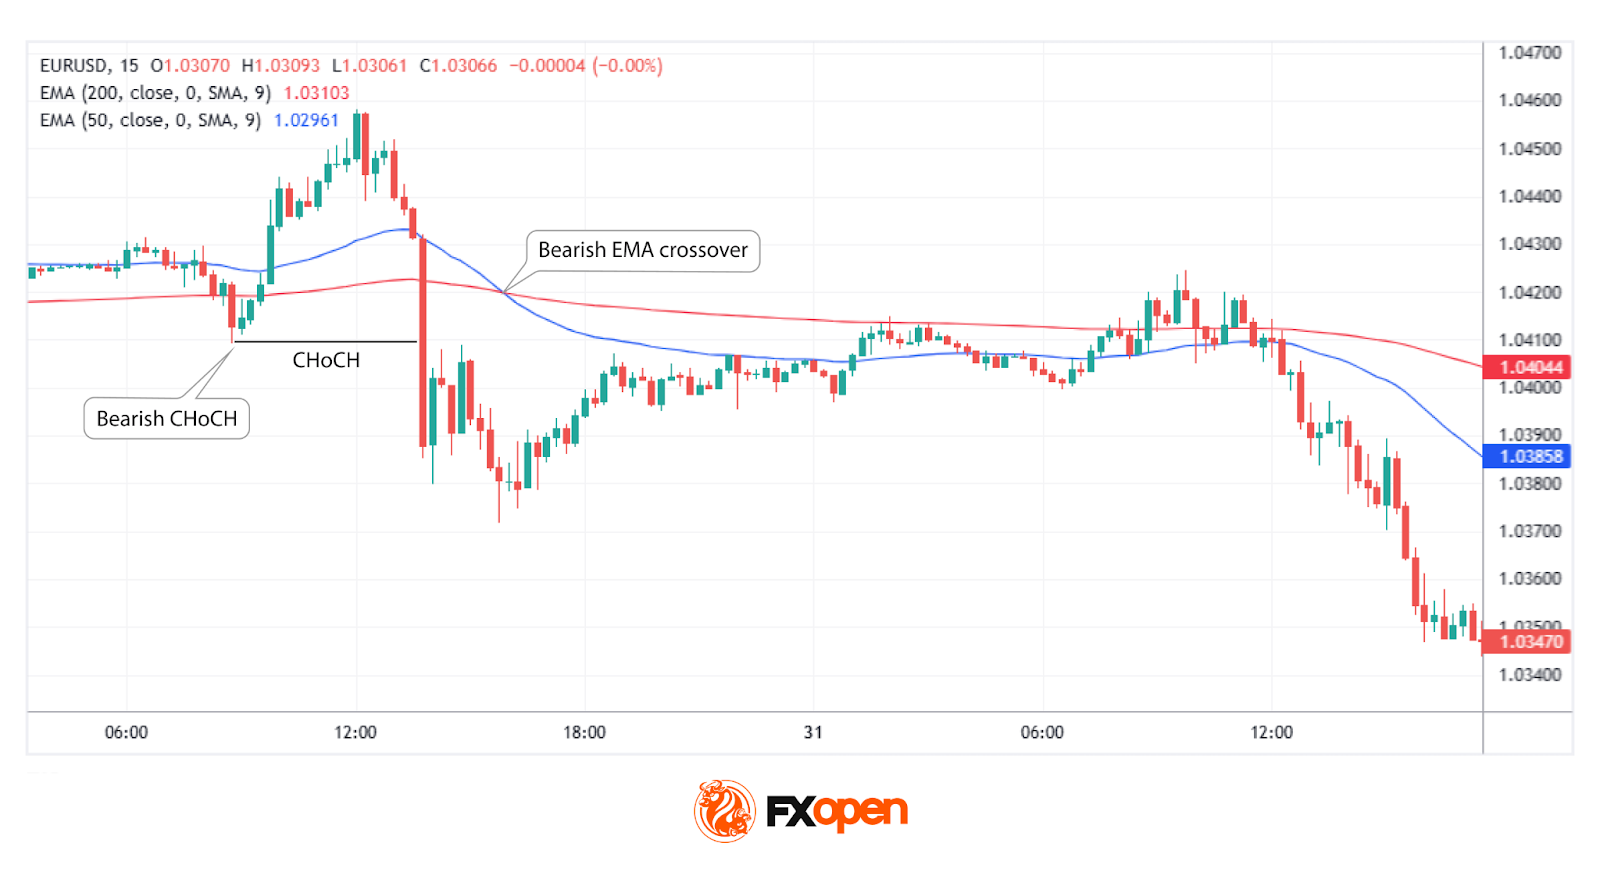
Traders typically start by analysing the broader market direction. This often involves looking at higher timeframes, such as the daily or 4-hour charts, to identify trends or reversals. Tools like Breaks of Structure (BOS) or Changes of Character (CHoCH) within the ICT framework may help clarify whether the market is leaning bullish or bearish.
Indicators, such as moving averages or momentum oscillators, can also provide additional context for confirming directional bias. A strong bias ensures the trader is aligning setups with the dominant market flow.
2. Identifying and Using IFVGs
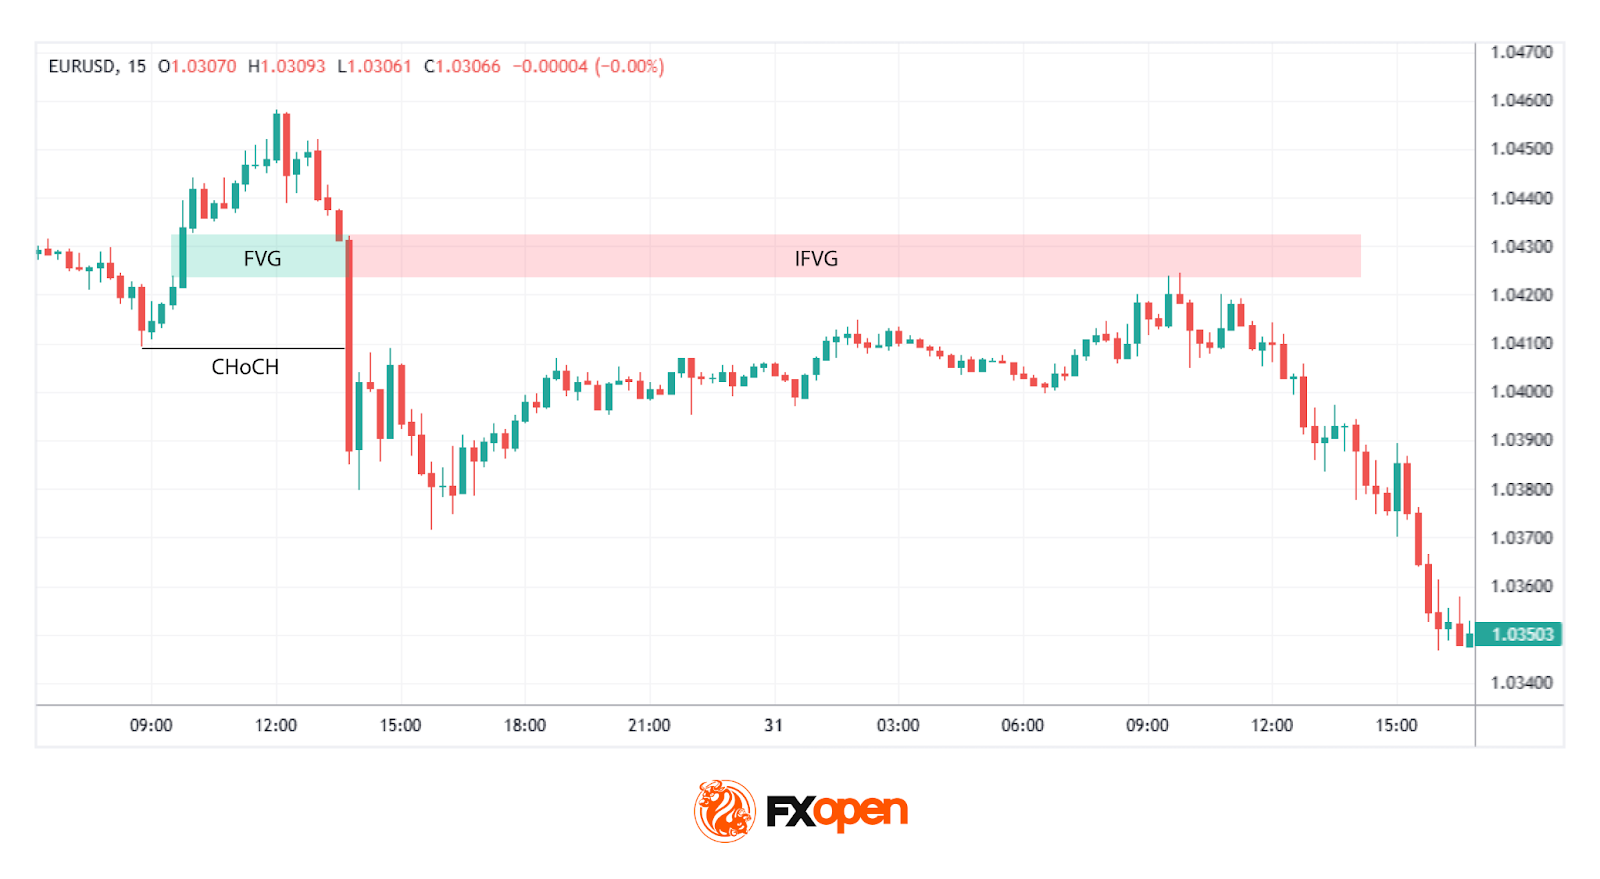
Once a Fair Value Gap (FVG) is invalidated—indicating a significant shift in sentiment—it transforms into an Inverse Fair Value Gap (IFVG). Traders mark the IFVG zone as a key area of interest. If it aligns with their broader market bias, this zone can serve as a potential entry point. For instance, in a bearish bias, traders may focus on bearish IFVGs that act as potential resistance zones.
3. Placing Orders and Risk Management
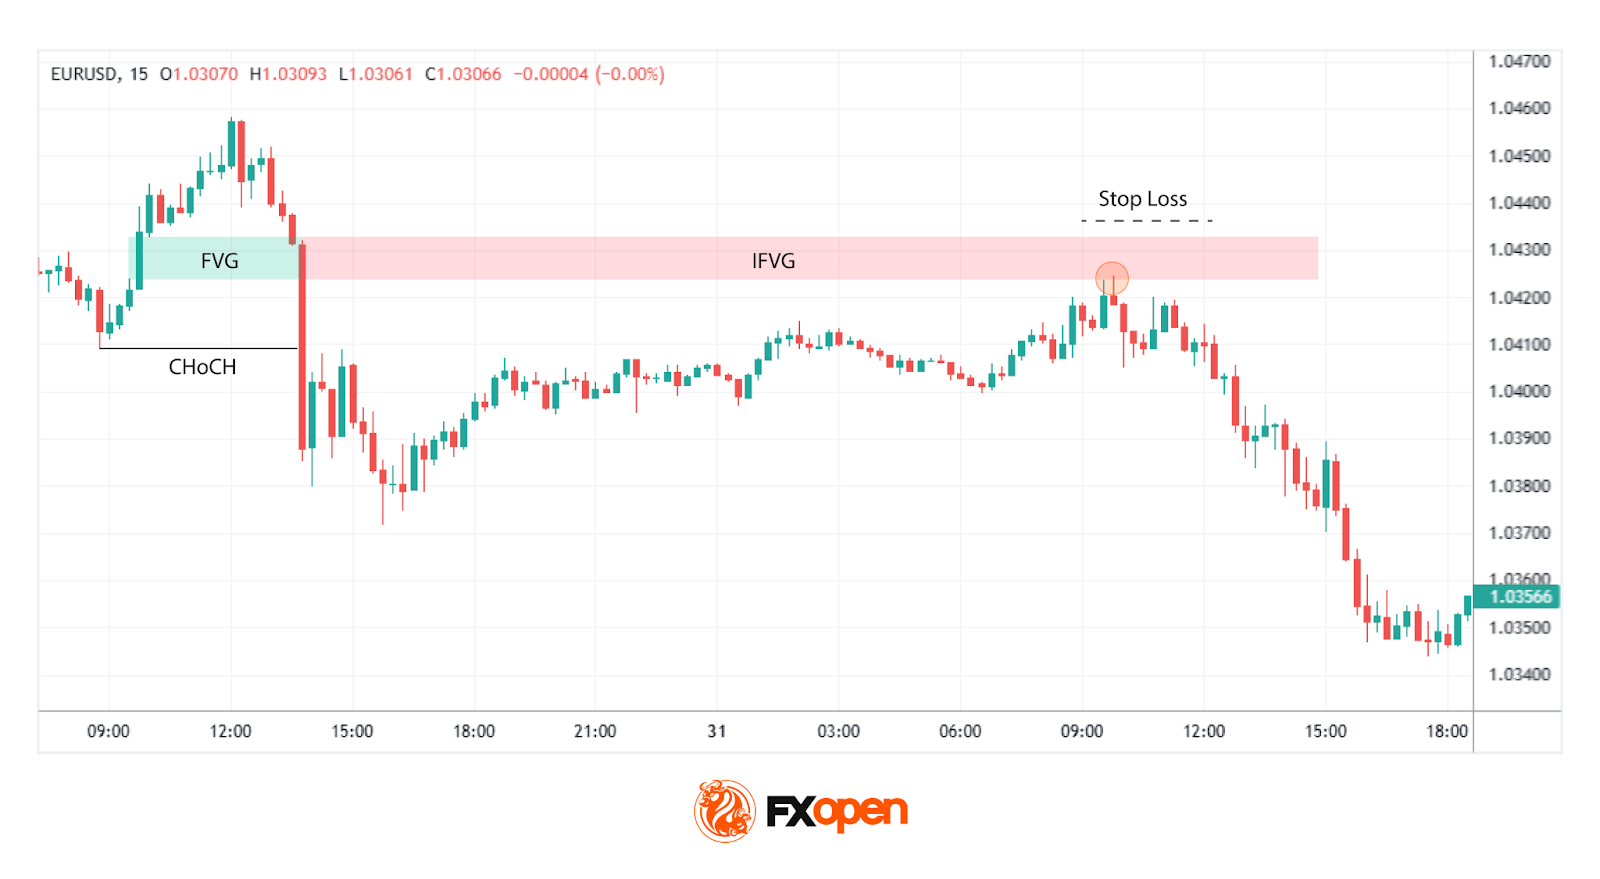
Traders often set a limit order at the IFVG boundary, anticipating a retracement and for the area to hold. A stop loss is typically placed just beyond the IFVG or a nearby swing high/low. For exits, targets might include a predefined risk/reward ratio, such as 1:3, or a significant technical level like an order block or support/resistance area. This approach ensures trades remain structured and grounded in analysis.
Advantages and Disadvantages of IFVGs
IFVGs offer traders a unique lens through which to analyse price movements, but like any tool, they come with both strengths and limitations. Understanding these may help traders incorporate IFVGs into their strategies.
Advantages
- Highlight market sentiment shifts: IFVGs pinpoint areas where sentiment has reversed, which may help traders identify key turning points.
- Refined entry zones: They provide precise areas for potential analysis, reducing guesswork and offering clear levels to watch.
- Flexibility across markets: IFVGs can be applied to any market, including forex, commodities, or indices, making them versatile.
- Complementary to other tools: They pair well with other ICT tools like BOS, CHoCH, and order blocks.
Disadvantages
- Subject to interpretation: Identifying and confirming IFVGs can vary between traders, leading to inconsistencies.
- Limited standalone reliability: IFVGs need to be used alongside broader market analysis; relying solely on them increases risk.
- Higher timeframe dependence: Their reliability can diminish on lower timeframes, where noise often obscures true sentiment shifts.
- Potential for invalidation: While IFVGs signal potential trades, they aren’t guarantees; price can break through.
The Bottom Line
Inverse Fair Value Gaps offer a systematic way to interpret price imbalances and potential turning points in the market. When used alongside other technical tools, IFVGs may help traders uncover valuable insights. Used in context with structure and momentum, IFVGs support traders when framing directional intent and managing expectations around follow-through versus failure.
Those interested in testing and refining IFVG-based strategies in real trading environments can consider opening an FXOpen account, which provides access to over 700 instruments, multiple advanced trading platforms, and competitive trading conditions.
FAQ
What Is an Inverse Fair Value Gap (IFVG)?
The IFVG meaning refers to a formation that occurs when a Fair Value Gap (FVG) is invalidated. For example, a bearish FVG becomes bullish after the price breaks above it, creating a potential support zone. Similarly, a bullish FVG can transform into a bearish IFVG if the price breaks below it, creating a potential resistance zone. IFVGs highlight shifts in market sentiment, providing traders with areas of interest for analysing possible reversals or continuation zones.
What Is the Difference Between a Fair Value Gap and an Inverse Fair Value Gap?
A Fair Value Gap (FVG) is an imbalance caused by aggressive buying or selling, creating a price gap that may act as support or resistance. An Inverse Fair Value Gap (IFVG) occurs when the original FVG is invalidated—indicating a shift in sentiment—and its role flips. For instance, a bearish FVG invalidated by a price breakout becomes a bullish IFVG.
What Is the Difference Between BPR and Inverse FVG?
A Balanced Price Range (BPR) represents the overlap of two opposing Fair Value Gaps (FVGs), creating a sensitive zone for potential price reactions. In contrast, an Inverse Fair Value Gap (IFVG) is a concept based on a single FVG that has been invalidated, flipping its role. While both could be useful, BPR reflects the equilibrium between buyers and sellers, whereas IFVG highlights sentiment reversal.
This article represents the opinion of the Companies operating under the FXOpen brand only. It is not to be construed as an offer, solicitation, or recommendation with respect to products and services provided by the Companies operating under the FXOpen brand, nor is it to be considered financial advice.
Stay ahead of the market!
Subscribe now to our mailing list and receive the latest market news and insights delivered directly to your inbox.


Latest articles

NZD/USD Analysis: A Tug-of-War at the Critical Level
The kiwi has strengthened meaningfully against most peers this month. However, against the US dollar specifically, NZD/USD remains well below its 2026 highs, trading in the mid-0.58 area versus January's peak near 0.6075.
New Zealand's Q2 inflation

AUD/USD and USD/CAD React to Rising Geopolitical Risks
Commodity-linked currencies remain under pressure as geopolitical tensions in the Middle East continue to escalate. The United States has maintained strikes on targets in Iran, while the Tehran-backed Houthis have intensified threats to shipping in the Red Sea and near

GBP/CHF: Trendline or RSI — Which One Is Lying?
Sterling enters this week on firmer footing, with political uncertainty fading fast after Andy Burnham's confirmation as Labour leader eased investor concerns over the succession to Keir Starmer. Markets reacted further to reports pointing to Shabana Mahmood as the frontrunner