


What Is the Difference Between VWMA vs VWAP?
FXOpen
When trading in the financial markets, having the right tools and indicators can make all the difference. Two popular indicators used by traders are VWMA and VWAP, both of which factor volume data into their calculations.
But what’s the difference between the two, and which one should you consider using? In this guide, we’ll break down both indicators, show how they’re calculated, and discuss the key differences.
What Is VWMA?
VWMA stands for Volume-Weighted Moving Average. It’s a lagging technical indicator that’s calculated similarly to a Simple Moving Average (SMA) but taking volume into account. In essence, a high volume will have a greater impact on the VWMA, offering traders a more accurate representation of an asset’s price trend than non-volume weighted moving averages.
We can see the similarities when comparing the calculation of the SMA to the VWMA. If you wanted an SMA over three periods, you’d use:
3-Period SMA = (Close 1 + Close 2 + Close 3) / 3
Close here refers to the closing price of an asset. Meanwhile, to calculate a VWMA, the formula is:
3-Period VWMA = ((Close 1 * Volume 1) + (Close 2 * Volume 2) + (Close 3 * Volume 3)) / (Volume 1 + Volume 2 + Volume 3)
One advantage of VWMA is that it can filter out noise from small price movements that don't have a significant impact on trading volume. It can also help traders identify the strength of a trend by showing if price movements are accompanied by increasing or decreasing trading volume.
Ultimately, traders use VWMA in much the same way as they use other moving averages. For example, they may look for the price to cross over or under the VWMA line to determine whether an asset is bullish or bearish.
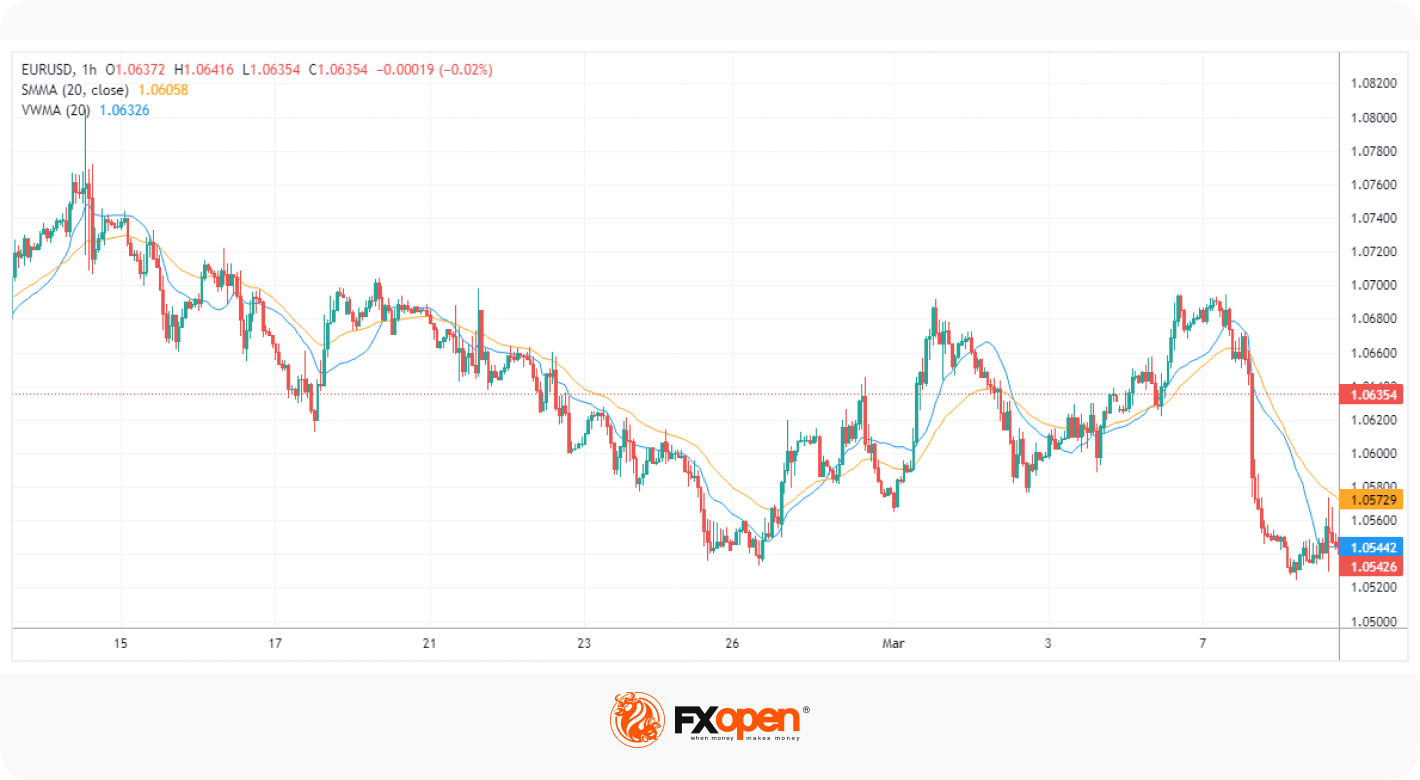
However, combining the SMA and VWMA indicators can be a powerful technique. A divergence between the two can be used to gauge the strength and direction of a trend. In the chart above, a bearish trend was signified by the VWMA (blue) sitting beneath the SMA (orange). As a result, the crossover signaled a change in market direction.
What Is VWAP?
VWAP stands for Volume-Weighted Average Price. It’s similar in principle to the VWMA, but rather than being a moving average, it shows the ratio of an asset’s price to its total trading volume in a given trading session, known as its anchor period. Consequently, it produces an average price that stays relatively static throughout a trading day, compared to a moving average, which closely follows prices.
The VWAP calculation is reset at the start of each trading day. The formula to calculate it can simply be expressed as follows:
VWAP = (Typical Price * Volume) / Volume
The actual steps involved are slightly more complicated:
- Calculate the typical price from the session's first candle, using (High + Low + Close) / 3.
- Multiply the volume of that candle by the typical price (Volume * Typical Price).
- Calculate the sum of (Volume * Typical Price) from the first candle to the current one.
- Calculate the sum of the volume from the first candle to the current one.
- Divide the sum of (Volume * Typical Price) by the sum of the volume to get the VWAP.
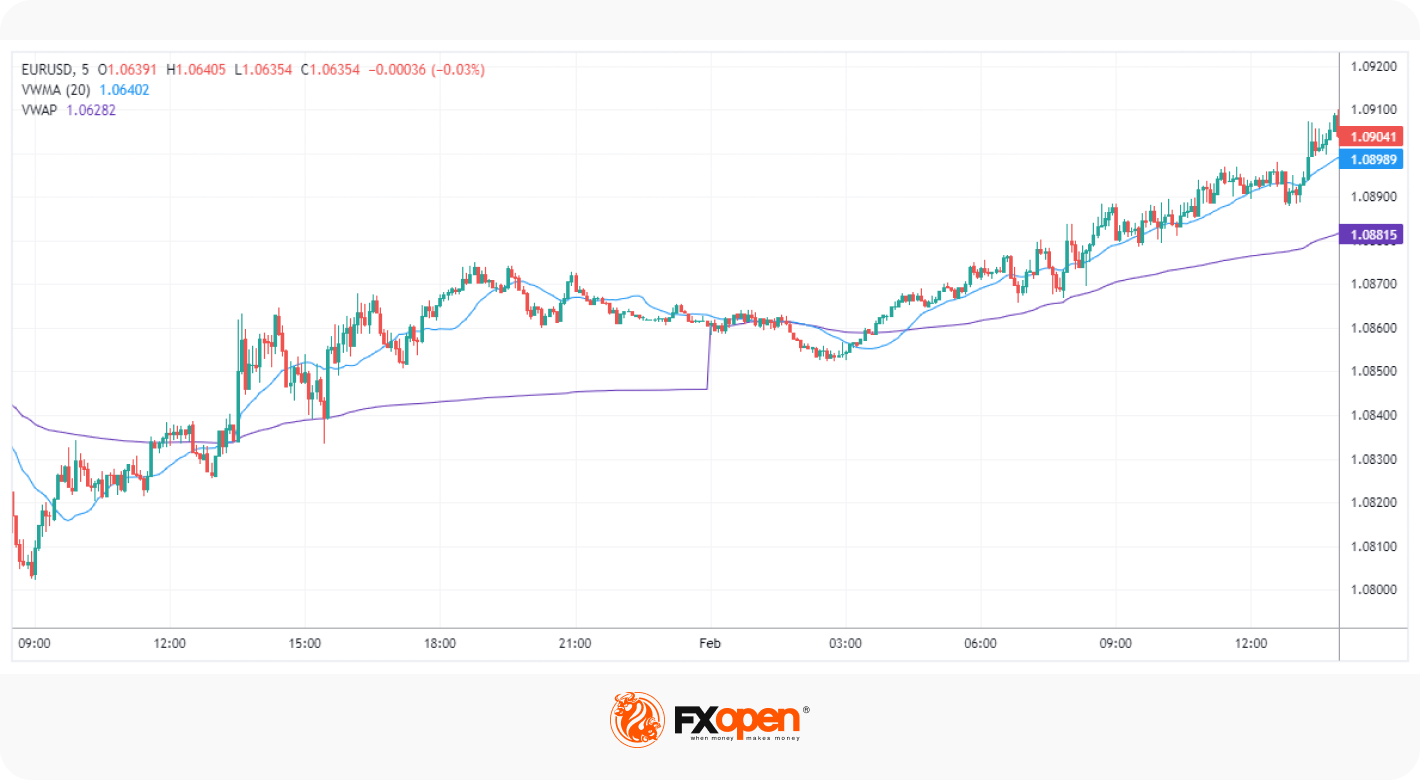
Because the VWAP is calculated using the first candle of a trading day, it’s best-used intraday on low timeframe charts, like the 1-, 5-, or 15-minute. Its value is virtually identical across all timeframes.
Thankfully, traders don’t need to perform any of these calculations themselves. In the free TickTrader platform offered by us at FXOpen, you’ll find both the VWMA and VWAP indicators ready to start using within minutes.
A key advantage of VWAP is that it can offer traders an idea of the "fair value" of an asset. This is in line with the idea of mean reversion, which states that prices tend to revert to their average over time. If an asset trades below its VWAP, it could be considered undervalued. Likewise, if an asset is trading above its VWAP, it could be considered overvalued, and traders may look for potential opportunities to sell the asset.
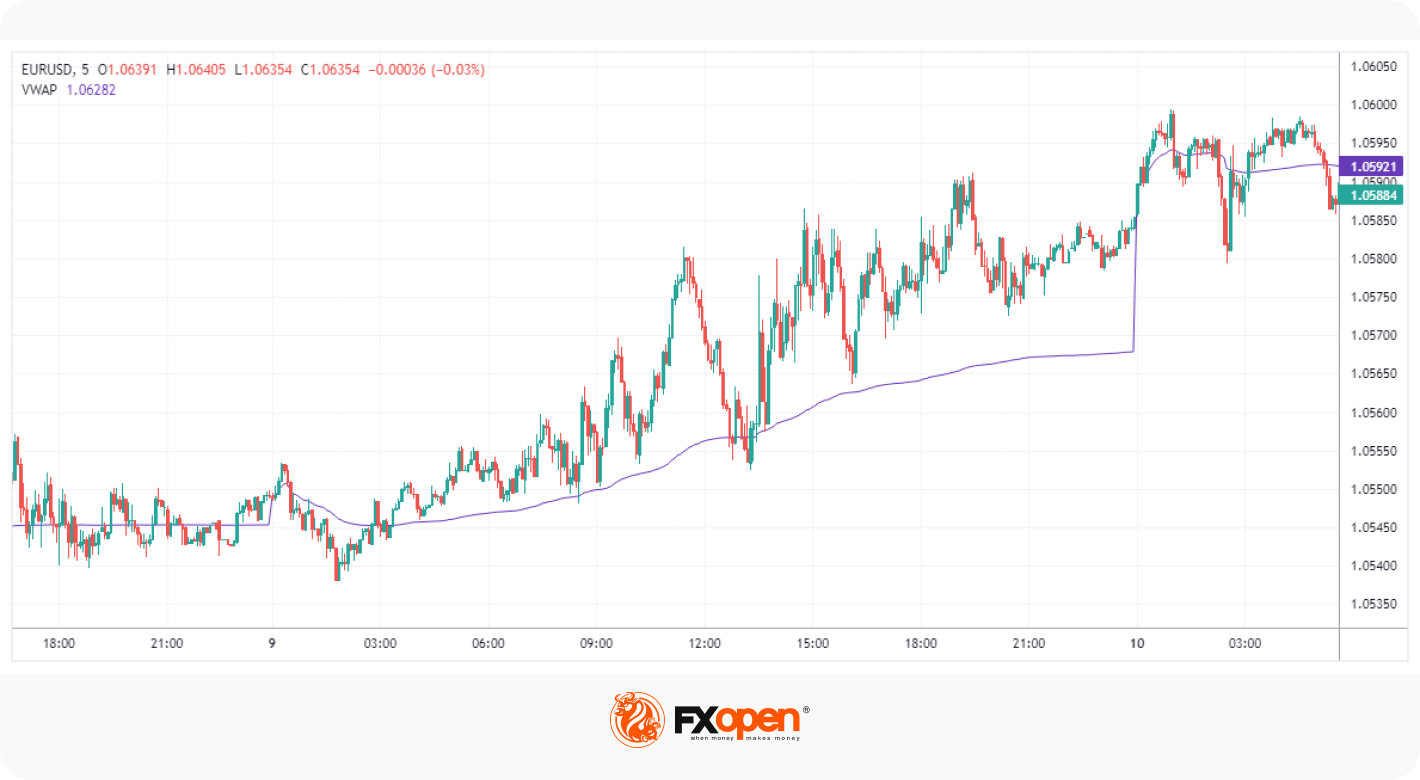
However, sustained price action above or below the VWAP may also indicate a trend. Note that mean reversions and these trends aren’t mutually exclusive; an asset may soar well above the VWAP, revert back to it, and then continue much higher in a strong bull trend, like in the chart above. In this way, the VWAP can be used to effectively trade pullbacks and identify entries that align with higher timeframe trends.
What Is the Difference Between VWAP and VWMA?
While both VWMA and VWAP use volume data to provide a more accurate representation of an asset's price trend, several differences exist between the volume-weighted average price vs volume-weighted moving average.
Calculation
The first distinction is in the calculations. VWMA is an N-period moving average of the closing price, weighted by trading volume. VWAP, on the other hand, takes into account high, low, and closing prices and is anchored to a specific session and weighted by trading volume.
Sensitivity
Due to their differing calculations, VWMA tends to follow prices closely and is more sensitive, while VWAP is less reactive to fluctuations in both price and volume. This means that the slope of the VWMA changes more frequently, making it better suited to determining trends at-a-glance, especially when combined with other moving averages.
VWAP, meanwhile, can be useful for identifying short-term deviations from the average, which may provide valuable trading opportunities based on mean reversion.
Timeframe
Another critical difference relates to the applicable timeframes. Like other moving averages, VWMA is timeframe agnostic, meaning the way it reacts to price changes is the same across all timeframes, whether monthly or 1-minute charts.
VWAP is typically calculated using a single day’s price data, so if you try to apply VWAP to daily charts or above, it won’t indicate much at all. It’s much more effective on intraday timeframes, especially 1-hour or below.
Trading Strategy
Because of the differences above, trading strategies for the volume-weighted moving average vs VWAP can be quite different. VWMA can be more effective for identifying trends and may present more trading opportunities if using a short period, like 10 or 20 candles, due to its heightened sensitivity. It also has more use for swing trading or position trading strategies.
VWAP is better suited to mean reversion strategies and gauging the fair value of an asset intraday. While it can be used in a trend-following approach, it may not be as effective at identifying long-term trends due to its focus on a single trading day. Instead, traders should look to identify a higher timeframe trend and then trade pullbacks to the VWAP in anticipation of trend continuation.
Which One to Use
Choosing between VWMA vs VWAP ultimately depends on your trading strategy and preferences. If you’re looking for a moving average that may more accurately reflect the trend of an asset, then VWMA may be a better choice. On the other hand, if you want a more static indicator that can offer mean reversion trading opportunities on intraday charts, then VWAP could be preferable.
Experimenting is the best way to determine which is right for you. You can try applying both in the TickTrader terminal to see how the price responds to each across different timeframes, noting your observations. When you feel ready to put your choice into practice, you can open an FXOpen account and evaluate your strategy in live markets. Good luck!
This article represents the opinion of the Companies operating under the FXOpen brand only. It is not to be construed as an offer, solicitation, or recommendation with respect to products and services provided by the Companies operating under the FXOpen brand, nor is it to be considered financial advice.
Stay ahead of the market!
Subscribe now to our mailing list and receive the latest market news and insights delivered directly to your inbox.


Latest articles

NVIDIA: Kyber NVL144 Dispute Weighs on the Stock
NVIDIA shares found themselves at the centre of debate over the future of the Kyber NVL144 system. On 6 July, CNBC, citing research firm SemiAnalysis, reported that the project could be delayed by more than a year—from 2027 to
EUR/GBP: Trendline Support or Breakdown to New Lows?
EUR/GBP has slid to its weakest level in a year, as the two currencies continue to follow increasingly divergent paths. The ECB's June hike—its first since 2023—was meant to signal renewed hawkishness, but the very next inflation

USD/CAD: One Trendline Away From Deciding the Next Move
After several strongly positive weeks, USD/CAD has stalled over the past few sessions, entering a phase of uncertainty.
On the dollar side, Fed Chair Kevin Warsh has struck a firm tone, reaffirming the 2% inflation target and pushing back