


What Is the Ichimoku Cloud and How Can It Be Used in Crypto Trading?
FXOpen
When non-traders think of trading, they often envision an indicator like the Ichimoku Cloud: a seemingly indecipherable mess of lines and colours. But in reality, the Ichimoku Cloud is logical, once you understand it, and quite an effective tool. In this article, we’ll take a look at what the Ichimoku Cloud is, its interpretation, and how you could use it as part of a crypto trading strategy.
What Is the Ichimoku Cloud?
While the Ichimoku Cloud may look like a complicated indicator, it's a highly versatile tool that can offer traders a quick snapshot of the market. The Ichimoku Cloud, also known as Ichimoku Kinko Hyo, was developed by Japanese trader Goichi Hosada. He spent around 40 years working on and refining it, finally publishing his findings in the 1960s.
At a glance, the Ichimoku Cloud can help traders gauge trends, forecast support and resistance levels, and determine potential entry and exit points. It combines multiple technical indicators into a package that can be incredibly effective if used correctly. While not initially built for crypto, the Ichimoku has gained popularity amongst crypto traders for its ability to adapt to the fast-paced and volatile nature of cryptocurrencies.
Understanding the Components of the Ichimoku Cloud

To get the most out of the Ichimoku Cloud, it's essential to understand its six primary components.
Conversion Line (Tenkan-Sen): This line (blue) is calculated by averaging the highest high and the lowest low over a specified period, typically 9 periods. It serves as a dynamic support and resistance level and helps identify short-term trends.
Base Line (Kijun-Sen): The Base Line (orange) is the average of the highest high and the lowest low over a set period, usually 26. It functions as a relatively stable support and resistance level and can be used to determine medium-term trends.
Leading Span A (Senkou Span A): The Leading Span A (green) is calculated by averaging the Base and Conversion Lines and plotting them 26 periods ahead. It forms one of the Kumo’s edges and indicates potential future support or resistance levels.
Leading Span B (Senkou Span B): Calculated by averaging the highest high and the lowest low over a longer period (usually 52 periods), the Leading Span B (red) is also displaced 26 periods ahead. It forms the other edge of the Kumo and, like Leading Span A, represents potential future support or resistance levels.
Lagging Span (Chikou Span): The Lagging Span (purple) simply shows the current closing price, plotted 26 periods in the past.
Kumo (Cloud): The space between the Leading Span A and B. If Leading Span A is greater than B, then the Kumo will turn green. If A is less than B, the Kumo will be red. The Kumo is a leading indicator and can show whether the market is in a downtrend or an uptrend, depending on its colour and the relative position of the price. To avoid confusion with the indicator and the Cloud, we’ll refer to it as the Kumo in this article.
Ichimoku Cloud Crypto Settings
Unlike most other financial markets, the crypto market trades 24/7. The original 9, 26, 52, and 26 periods for the Conversion Line, Base Line, Leading Span B, and displacements, respectively, were designed for the Japanese working week and aren’t suitable for crypto.
Thankfully, traders have already worked out the best Ichimoku settings for crypto. To match up with crypto’s trading hours, many change the indicator periods from 9, 26, 52, and 26 to 20, 60, 120, and 30.
Put simply, the revised Ichimoku Cloud settings for cryptocurrency are:
Conversion Line: 20 instead of 9.
Base Line: 60 instead of 26.
Leading Span B: 120 instead of 52.
Displacements: 30 instead of 26.
Ichimoku Cloud for Crypto: How to Use It
Now that we have an understanding of each Ichimoku Cloud component and what settings to use, we can start interpreting its signals. Let’s look at four key aspects of using the Ichimoku Cloud.
Want to see how it works for yourself? At FXOpen, we offer the free TickTrader terminal, where you’ll find a full suite of technical analysis tools, including the Ichimoku Cloud. Just adjust the settings to the ones given to follow along in real time.
Timeframe
The first consideration is the timeframe. The Ichimoku Cloud was originally designed to be used on the daily chart. While it has uses on the 4h and 12h charts, it's best to avoid using the indicator on most intraday timeframes, as it has been known to generate false signals.
If you’re determined to make it work on lower timeframes, you could try shorter periods than the original settings. However, it’s important to gain a deep understanding of the indicator and how it works in practice.
Identifying Trends

One of the primary uses of the Ichimoku Cloud is to identify market trends. When the price is above the Kumo, the market is considered bullish. Conversely, if the price is below the Kumo, the market is bearish.
If the price moves within the Kumo, the market is in a consolidation phase and shouldn’t be traded. Additionally, the colour of the Kumo can help traders understand the trend's direction: a green Kumo signals a bullish trend, while a red Kumo indicates a bearish trend.
The Lagging Span can also be used to confirm a trend. If it sits above the price and the Kumo, then traders have confirmation that the market is bullish. If it is plotted below both price and the Kumo, then the market can be considered bearish. Note that the Lagging Span is a confirmation tool, and traders use it after setting a bias based on other aspects of the indicator.
Finally, the distance between Leading Span A and B (forming the Kumo) can help traders gauge the trend’s strength. A narrower Kumo indicates that the trend might be weak, while a large Kumo can mean the trend is strong.
Catching Momentum

The Ichimoku Cloud can help traders identify and catch market momentum, providing valuable opportunities to enter and exit trades. When the Conversion Line crosses above the Base Line, it may signal a bullish momentum, whereas a crossover below the Base Line can indicate bearish momentum. This is known as a TK Cross. Additionally, a widening gap between the Conversion Line and Base Line can suggest that the momentum is increasing.
The Kumo’s position relative to the price also provides vital information about momentum. If the price moves above a rising or below a falling Kumo, it can signify strong bullish or bearish momentum, respectively. Conversely, if the price moves against the Kumo’s direction, it could imply a weakening trend or a potential trend reversal.
Support and Resistance

Lastly, the Ichimoku Cloud can provide traders with dynamic support and resistance levels. These levels can be used to find entry and exit points that align with a trader’s overall analysis of the indicator.
The Kumo’s edges, formed by Leading Span A and Leading Span B, act as the primary support and resistance levels. In an uptrend, the Kumo’s upper edge (usually Leading Span A) serves as support, while in a downtrend, the lower edge (usually Leading Span B) acts as resistance.
It’s also possible for the opposing edge to hold as support when bullish and to pose resistance when bearish, but this would put the price inside of the Kumo. As mentioned earlier, it’s best to avoid taking a position inside of the Kumo, but it can help traders prepare for an entry if the level holds and the price reemerges from the Kumo. However, if the price breaches these levels, it could signal a potential trend reversal.
In addition to the Kumo, the Conversion and Base Lines also serve as minor support and resistance levels. When the price is above the Conversion and Base Lines, they can act as support, while if the price is below them, they can serve as resistance.
Ichimoku Cloud for Bitcoin and Other Cryptocurrencies: A Strategy
Using these interpretations, we can now begin to formulate an Ichimoku Cloud crypto trading strategy. We can set specific criteria that must be satisfied before considering a trade; then, we may set actual entry criteria.
Consideration requirements:
- If bullish, the price must be above the Kumo, and the Kumo must be green. If bearish, the price should be below, and the Kumo should be red.
- In an uptrend, the Lagging Span must be above the price and the Kumo, and vice versa.
- If bullish, the Conversion Line must be above the Base Line, and vice versa.
Once we have the green light on these three requirements, we can identify possible entries:
- If only waiting for the Conversion to cross the Base, we can enter on the crossover.
- If all three requirements are already met, we may enter on a retrace to the Conversion or the Base Line. Entering on the Conversion Line can be considered riskier, while waiting to enter the Base Line may mean missing opportunities.
- We can make an entry after confirming that Leading Span A (if bullish) or Leading Span B (if bearish) is acting as support/resistance.
What about stop losses and take profits? For stop losses, you can try at the opposing edge of the Kumo or use another technical factor altogether for a tighter stop. Take-profit levels are tricky to set with the Ichimoku. You may prefer to simply trail a stop above or below the Kumo, depending on the direction of your trade, or close the position when the Conversion line crosses back over the Base.
Let’s take a look at each possible entry in practice.
Conversion-Base Crossover

Here, we see clear bullishness confirmed by both the Lagging Span and Kumo. The only missing piece is the bullish Conversion-Base crossover. Once we see the crossover occur, we can consider an entry.
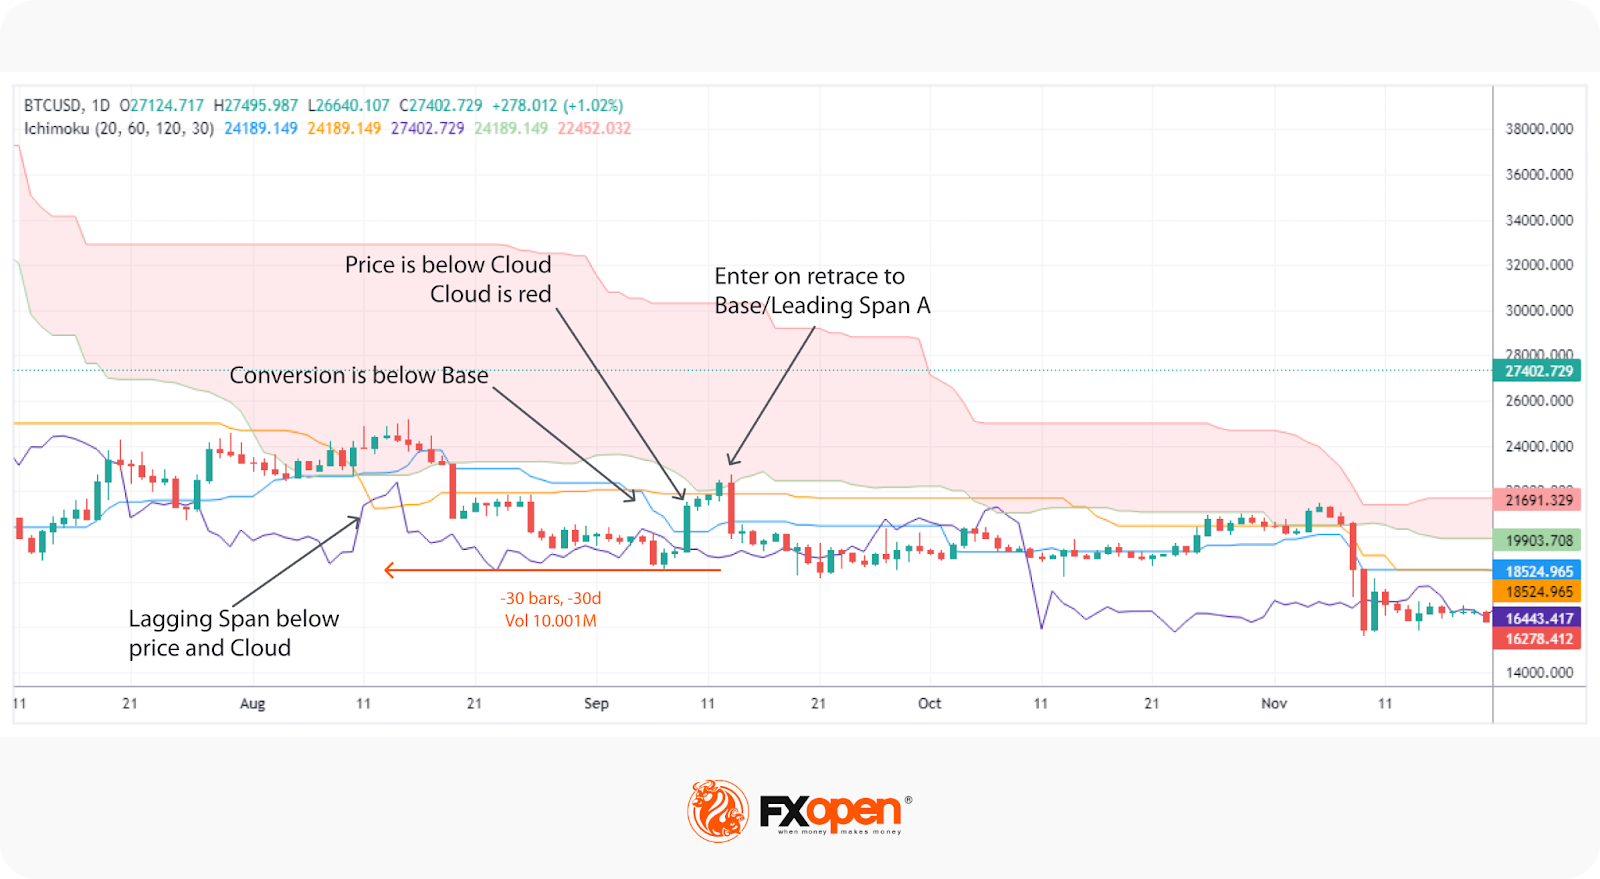
Conversion/Base Retrace

Similarly, we see a very bullish market, with almost every signal of the Ichimoku Cloud pointing to a strong uptrend. When the price pulls back to the Base Line, we can look to enter a position.
Kumo Support/Resistance
In this example, we see a substantial bearish trend, marked by a large Kumo. With each of our three consideration criteria met, we can wait for a pullback to either the Leading Span A or the Base Line to make an entry. Luckily, both lined up at roughly the same area, giving us extra confirmation that the level was likely to hold as resistance.
Limitations of the Ichimoku Cloud
While the Ichimoku Cloud is undoubtedly a versatile and insightful tool, it doesn’t come without limitations. One is that its uses are fairly limited intraday; the short-term volatility of cryptocurrencies and many other asset classes can lead to increased false signals and trouble interpreting the indicator.
It’s also ineffective in ranging markets. It can excel at offering entries in trending markets but may generate conflicting or ambiguous signals in a range, making it difficult to identify clear entry and exit points.
Lastly, the Ichimoku Cloud is more complex than most other indicators, with multiple signals and ways to interpret its readings. This can lead to confusion and a steeper learning curve.
Closing Thoughts
Now that you have a comprehensive overview of the Ichimoku Cloud, why not try applying it to your favourite market? It doesn’t have to be crypto either - you can just switch back to the original settings if you’re looking to use the Ichimoku Cloud for forex, commodities, or stocks.
The same ideas, uses, and strategy rules given here can still be applied to these markets, but you may need to look for your own methods for using the indicator in specific markets. Once you feel like you have a solid understanding of how to apply the Ichimoku Cloud, you can open an FXOpen account. You’ll be able to access dozens of live markets and advanced analysis tools in the free TickTrader platform alongside low costs and tight spreads. Good luck!
*At FXOpen UK and FXOpen AU, Cryptocurrency CFDs are only available for trading by those clients categorised as Professional clients under FCA Rules and Professional clients under ASIC Rules, respectively. They are not available for trading by Retail clients.
This article represents the opinion of the Companies operating under the FXOpen brand only. It is not to be construed as an offer, solicitation, or recommendation with respect to products and services provided by the Companies operating under the FXOpen brand, nor is it to be considered financial advice.
Stay ahead of the market!
Subscribe now to our mailing list and receive the latest market news and insights delivered directly to your inbox.


Latest articles

EUR/USD and GBP/USD consolidate ahead of the Fed decision
European currencies are showing subdued dynamics, entering a consolidation phase following their previous advance. Earlier, EUR/USD and GBP/USD broke out of their ranges and strengthened; however, the subsequent correction has led both pairs to retest the previously breached

Meta: V-Shaped Recovery Meets Heavy Volume Resistance
The movement in Meta Platforms shares is being driven by two competing narratives. On one hand, advertising revenue is benefiting from AI-based tools: the Advantage+ platform continues to support strong advertiser demand, and the analyst consensus for Q1 2026 revenue

Commodity Currencies Test Key Levels Ahead of Major Macro Data
Commodity-linked currencies are trading near key levels, showing restrained price action as market participants adopt a wait-and-see approach. The fundamental backdrop is shaped by expectations surrounding the release of Australia’s inflation data and the Bank of Canada’s interest