


What Is the Relative Vigor Index (RVI)?
FXOpen
Trading indicators are mathematical calculations based on historic price, volume, or open interest data that traders use to analyse financial markets and make effective trading decisions. The Relative Vigor Index is a trading indicator used by market participants when trading various financial instruments. In this FXOpen article, we will discuss the meaning of the RVI and cover the Relative Vigor Index strategy.
What Is the RVI?
The Relative Vigor Index (RVI) was developed by John F. Ehlers and Rick Way and is explained in their book, "Cybernetic Analysis for Stocks and Futures." It is a momentum indicator, and it is used in technical analysis to measure the conviction or strength of a trend. It helps traders identify the price trend direction and potential market reversals.
Here's a step-by-step summary of how to calculate the Relative Vigor Index (RVI):
- Choose an N period: Decide on the number of periods (usually days or bars) for which you want to calculate the RVI. The typical value for N is 14, but it can be adjusted based on your trading strategy and timeframe.
- Gather data: For each period, you need the following values: open, high, low, and close prices.
- Calculate the RVI numerator and denominator:
- The numerator is the sum of the differences between the current closing price and the previous closing price for each period within the chosen N period.
- The denominator is the sum of the differences between the current high price and the previous low price for each period within the chosen N period.
- Calculate the Simple Moving Averages (SMAs): Calculate the SMA of the RVI numerator and denominator over the chosen N period. The SMA is the average of the values calculated in the previous step. It makes the RVI (10) a more stable and interpretable indicator.
- Divide the SMA of the RVI numerator by the SMA of the RVI denominator: This will give you the final Relative Vigor Index value for the current period.
- Calculate the signal line based on RVI values.

Fortunately, you don’t need to perform all these calculations. On the TickTrader platform, all the technical indicators are applied automatically.
How to Use the RVI Indicator
The RVI provides traders with several signals to help them make trading decisions. Let's explore how traders can trade with the Relative Vigor Index:
Crossovers
A bullish RVI crossover occurs when the RVI line crosses above its signal line. This crossover is considered a bullish signal and is interpreted as a sign of a potential uptrend in the market. When the indicator crosses above its signal line, it suggests that the recent price action is gaining strength and momentum is shifting to the upside.

Conversely, a bearish crossover occurs when the RVI line crosses below its signal line. This crossover is considered a bearish signal and is interpreted as a sign of a potential downtrend in the market. When the Relative Vigor Index crosses below its signal line, it suggests that the recent price action is losing momentum, and the downward pressure may be increasing.
Divergences
A bullish divergence occurs when the price forms lower lows, but the Relative Vigor Index forms higher lows. In other words, the price is showing a downtrend, while the RVI is indicating a potential bullish reversal. The significance of bullish Relative Vigor Index divergence is that it suggests the underlying selling pressure is weakening, and the market sentiment may be shifting towards the upside.
The chart below shows a case of bullish divergence where the trader opens a buy trade at the close of a big bullish bar that provides an additional confluence of a trend reversal. A stop-loss order is below the swing point with a profit target at the level calculated based on the risk/reward ratio.

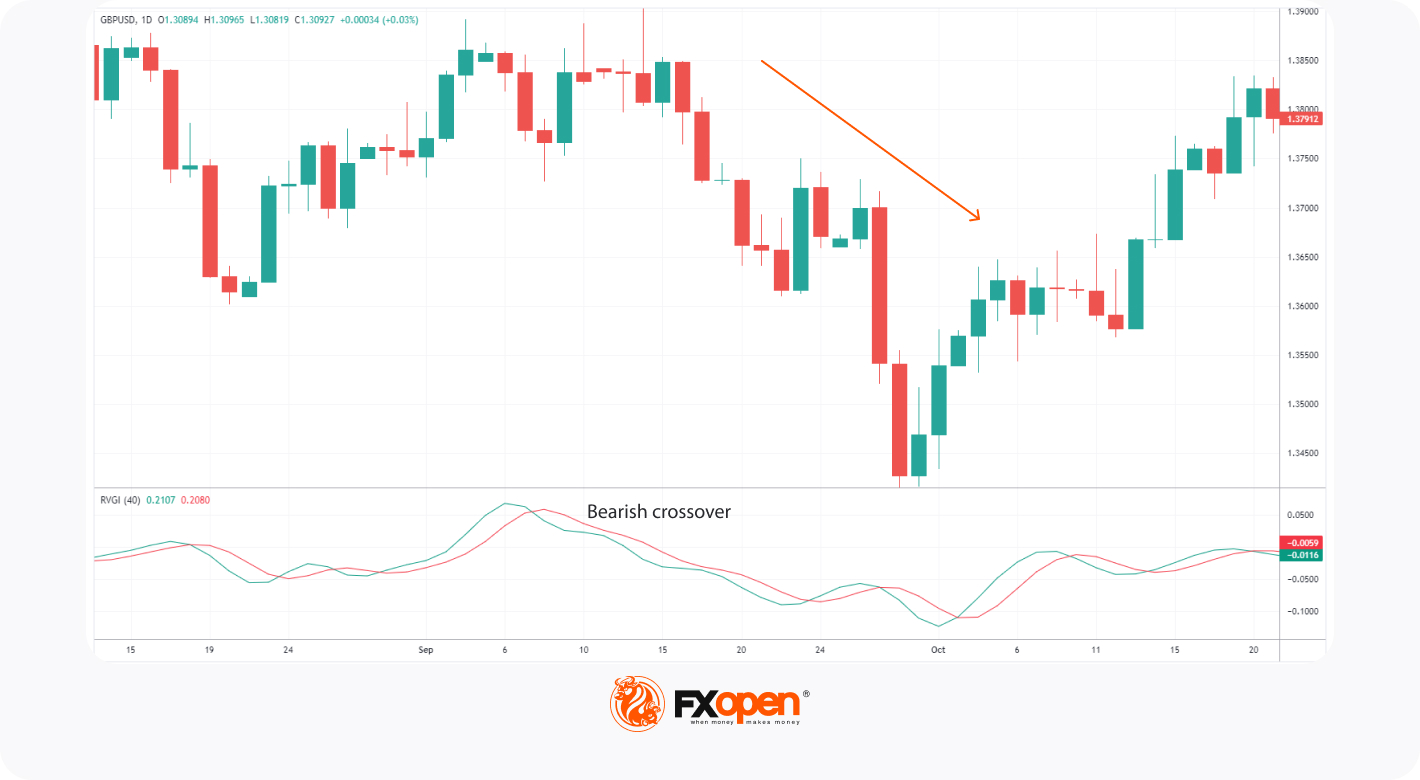
Conversely, a bearish RVI divergence occurs when the price forms higher highs, but the RVI forms lower highs. In this case, the price is showing an uptrend, while the Relative Vigor Index is signalling a potential bearish reversal. The significance of the bearish divergence is that it suggests the underlying buying pressure is weakening, and the market sentiment may be shifting to the downside.
The chart below shows a case of bearish divergence where the trader enters a sell trade at the close of a red candle. The trade takes some time to hit the profit target, which is located at the most significant support level. The stop loss level is placed above the recent swing high, which helps them avoid a possible negative trade.

How to Combine the RVI Indicator with Other Technical Analysis Tools
The RVI may provide false signals or be interpreted incorrectly. To enhance Relative Vigor Index trading efficiency, it can be combined with other technical analysis tools on the TickTrader platform. Here are two such combinations:
- Moving Averages: Combining the RVI with moving averages may help traders identify the overall trend direction and filter out false signals. For example, the Relative Vigor Index divergence accompanied by a change in the moving average direction may be used to confirm bullish or bearish biases.
- Support and Resistance Levels: Incorporating support and resistance levels with the RVI can be valuable. For instance, if the Relative Vigor Index shows a bearish divergence with the price near a strong resistance level, it strengthens the signal for a potential price reversal to the downside.
Conclusion
The world of technical analysis comes with many challenges that may affect the consistency of a trader’s strategy. Indicators such as Relative Vigor Index aim to help market participants solve complex calculations. As you start feeling comfortable with this technical analysis tool, you may consider opening an FXOpen account to trade on various financial instruments.
This article represents the opinion of the Companies operating under the FXOpen brand only. It is not to be construed as an offer, solicitation, or recommendation with respect to products and services provided by the Companies operating under the FXOpen brand, nor is it to be considered financial advice.
Stay ahead of the market!
Subscribe now to our mailing list and receive the latest market news and insights delivered directly to your inbox.


Latest articles

DAX 40: consolidation amid technology sell-off
A wave of selling in the technology sector that emerged earlier this week has weighed on European equities. The trigger was investor concern over the profitability of large-scale debt-funded investments by major US tech companies in AI infrastructure. The Nasdaq

Euro Hits Fresh Yearly Lows Amid Dovish ECB Signals
The euro remains under pressure following weak macroeconomic data from the euro area and fresh signals that the European Central Bank is prepared to maintain a more accommodative monetary policy stance. Data released yesterday pointed to a deterioration in business

Pound at Key Levels: Markets Assess Impact of Political Uncertainty in the UK
The British pound remains under pressure following increased political uncertainty in the United Kingdom triggered by the Prime Minister’s resignation. Investors are assessing potential shifts in the political and economic policy outlook after the head of government stepped down,