


What Is the VIX Index, and How Is It Used in Trading?
FXOpen
The VIX Index serves as a key indicator of expected market volatility over the next 30 days, derived directly from S&P 500 options. Developed by the Chicago Board Options Exchange in 1993, it offers a simple way to gauge volatility and potential stock market fluctuations. In this article, we’ll explore what the VIX is, how it’s calculated, and its practical applications.
Understanding the VIX Index
The VIX Index, often referred to as the "fear gauge," is a real-time volatility index representing the market's expectations of 30-day forward-looking volatility. Developed by the Chicago Board Options Exchange (CBOE), it was introduced in 1993 to provide a measure of market risk and investors' sentiments about future stock volatility. It’s derived from option prices of the S&P 500 Index stocks, offering a glimpse into the volatility traders anticipate over the next month.
The utility of the VIX lies in its ability to measure the degree of volatility—not the direction—of the stock market. High values indicate increased volatility and typically correspond to periods of market stress or uncertainty, while lower values suggest a so-called calm environment. For example, the VIX tends to spike during financial crises or significant geopolitical events, reflecting heightened investor nervousness.
Traders and investors watch the VIX closely because it helps them better understand market conditions. By analysing the index, they can gauge whether market participants are feeling fearful or complacent. This index does not provide direct insights into which direction the market will move but rather the intensity of expected fluctuations.
How the VIX Is Calculated
Unlike measures of past volatility, the VIX is forward-looking, utilising the implied volatilities derived from S&P 500 index options. It uses the prices of a wide range of S&P 500 index options, both puts and calls, across various strike prices. It focuses particularly on options near expiration—those with more than 23 days but less than 37 days until expiration. This range is chosen to capture the most immediate sentiments about volatility.
To calculate the VIX, the CBOE aggregates the weighted prices of these selected options. The weighting of each option reflects the inverse of the option’s strike price squared, which emphasises the relative importance of options closer to the money and lessens the impact of those further out.
The methodology involves a complex mathematical formula that integrates these prices into a single value representing implied volatility. This process includes calculating the expected volatility by averaging the weighted prices of the options, factoring in their probabilities of finishing "in the money" under the assumption of a log-normal distribution of stock prices. The result is then annualised to express the VIX in percentage points.
The values produced by the VIX range on a scale typically between 10 and 80, although it can occasionally fall outside these bounds during periods of extreme tranquillity or turbulence.
A value of around 10 to 20 generally indicates a perceived low-volatility environment, suggesting investor confidence and so-called market stability. Above 20 typically indicates a shaky market, while readings above 30 are often associated with more acute market stress and high volatility levels. A value of 40+ usually only occurs after a strongly negative market event; previous examples include the 2008 financial crisis, the onset of COVID-19, the Eurozone crisis, and various flash crashes over the years.
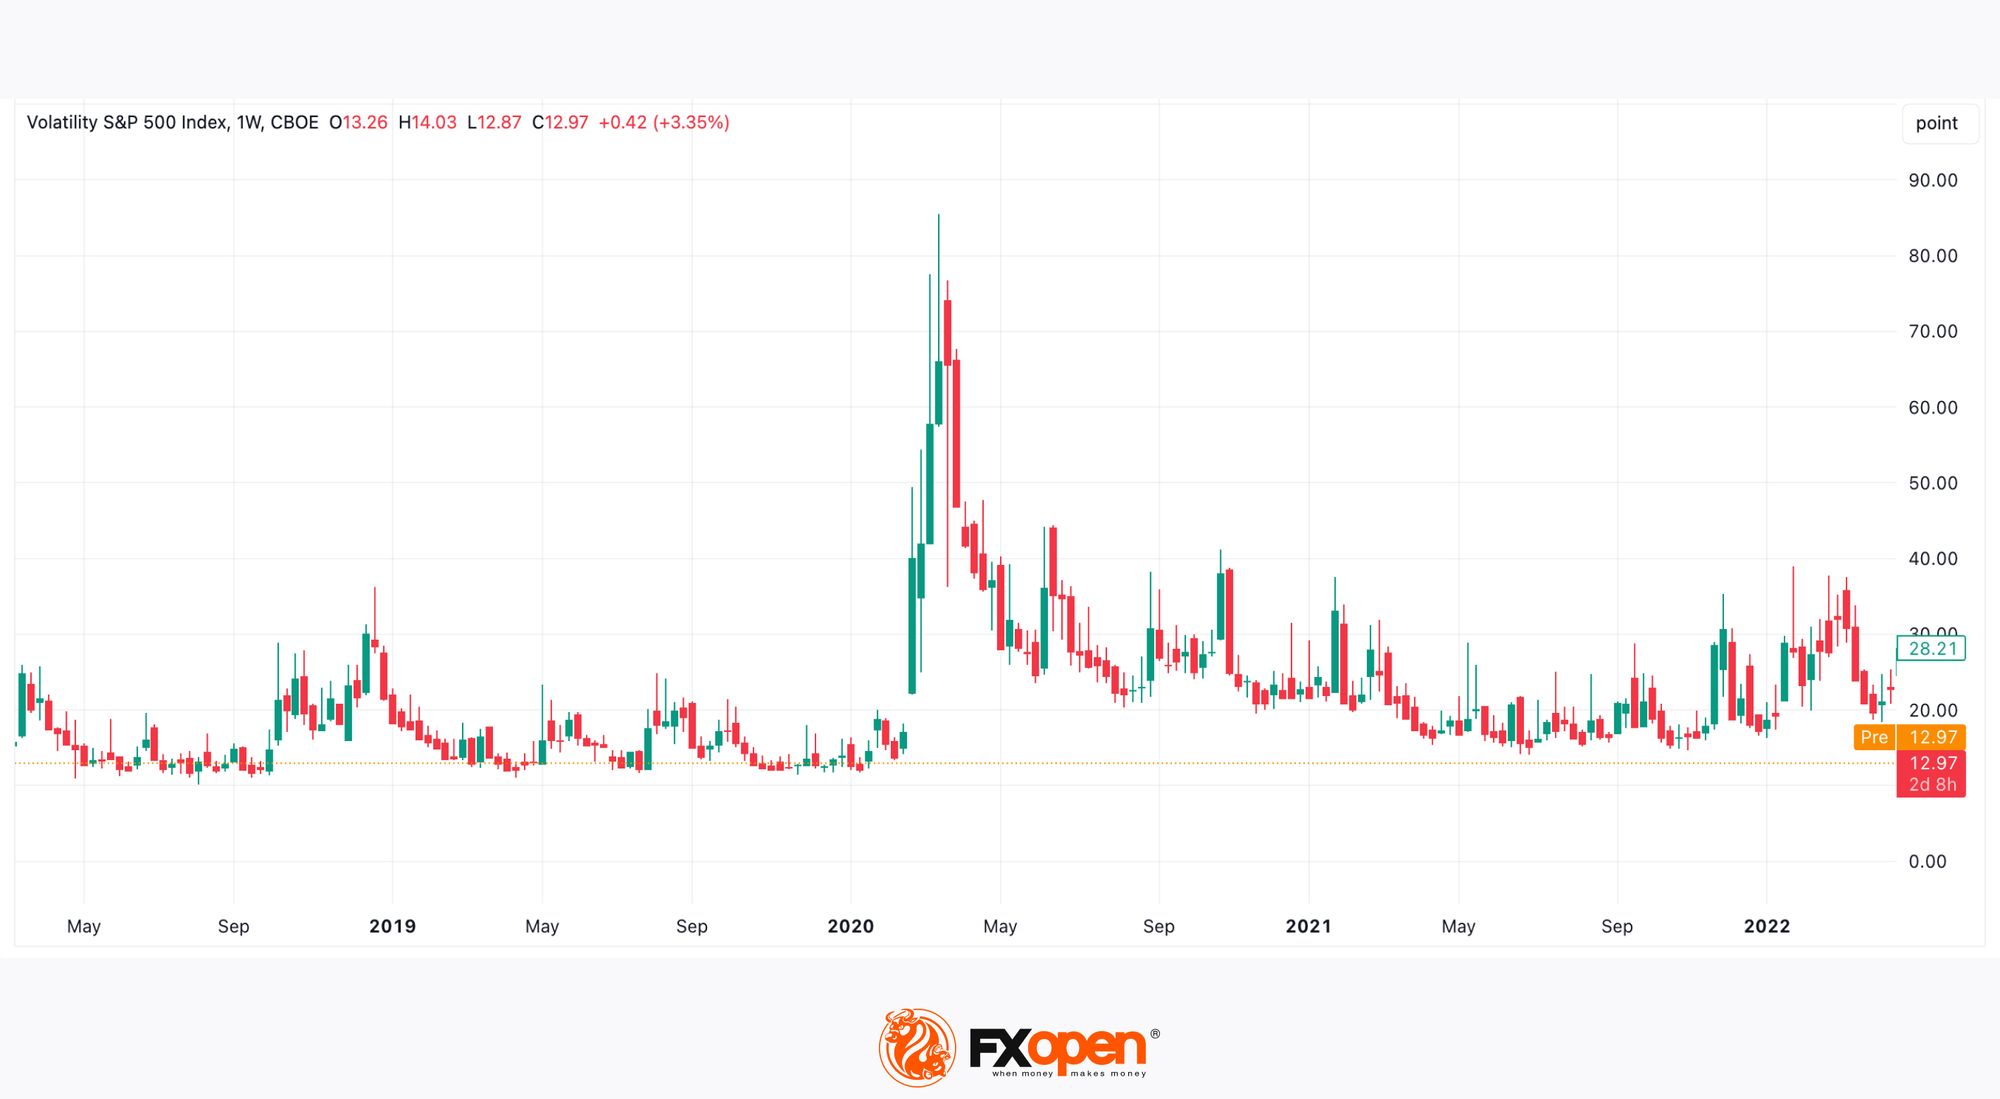
To compare the VIX’s performance with the fluctuations of the US stock market, head over to FXOpen’s free TickTrader platform to interact with real-time charts.
Practical Applications of the VIX in Trading
The VIX serves as a valuable tool for traders. It aids in understanding market sentiment and strategising trades based on perceived risk. Here's how traders often use the VIX in their trading activities:
VIX Trading Instruments
The VIX offers various tradable instruments that allow traders to capitalise on volatility. Key examples include CFDs, futures, options, and Exchange-Traded Products (ETPs) like the iPath Series B S&P 500 VIX Short-Term Futures ETN (VXX) and ProShares VIX Short-Term Futures ETF (VIXY). Traders can buy or sell these instruments to speculate or hedge against a market downturn.
Risk Assessment
The VIX plays a crucial role in assessing the market’s risk environment. When the VIX is high, it indicates increased volatility and uncertainty, suggesting that traders might face higher risks in the equity markets. Traders use this information to decide when to increase or decrease their exposure. For example, a sudden spike in the VIX might lead a trader to reduce their holdings in more volatile assets or shift towards more defensive stocks.
Hedging Strategies
It’s common to see traders using the VIX to hedge their positions against a potential market downturn. When they anticipate a rise in market volatility—suggested by a trending upward VIX—they may purchase VIX futures, options, or ETFs that are designed to increase in value as volatility rises. This hedging action helps to offset potential losses in their portfolio due to falling stock prices. It's a form of insurance against turbulence.
Market Timing
While the VIX does not indicate the direction in which the market will move, it provides clues about the intensity of market moves. Traders watch for extremes in the VIX readings to gauge potential reversals. For instance, historically high VIX levels often precede market bottoms, prompting traders to look for opportunities to buy at reduced prices. Similarly, unusually low VIX levels might signal complacency amongst investors, which could precede a pullback or correction.
Currency Trading
While the VIX has a direct application to the US stock market, it can also offer clues to currency traders. High readings are generally associated with a stronger dollar as investors exit their positions and seek so-called safe havens. Conversely, a low VIX indicates so-called market stability, leading to a weaker dollar as capital moves to riskier assets. However, if the trigger for a high VIX also deters dollar investors (e.g. concerns around the US economy), the dollar can weaken simultaneously.
Can the VIX Signal a Recession?
The VIX, while measuring expected stock market volatility over the next 30 days, does not directly signal recessions. It reflects investor sentiment and the market’s expectations for volatility, not the broader economic conditions that typically indicate a recession. However, it can provide indirect clues. Sharp, sustained increases in the VIX could suggest investor anxiety about future economic performance, which might precede economic downturns.
For example, a significant and rapid rise in the VIX, as seen during the 2008 financial crisis or the COVID-19 pandemic, corresponded with deep economic troubles. However, the VIX itself is more reactive than predictive. It rises in response to investor fears, which can be triggered by both economic factors and other influences like geopolitical unrest.
Therefore, while a high value can signal periods of economic stress, it shouldn’t be used in isolation to indicate recessions. It’s more accurate to view the VIX as a barometer of market sentiment at a particular time rather than an analysing tool for economic declines. Economic indicators such as GDP growth rates, employment figures, and business investment levels provide a more direct insight into economic health and potential recessions.
The Bottom Line
The VIX Index is more than just a measure of market volatility; it's a versatile tool that informs a wide range of trading strategies. Whether it's assessing risk, timing entries, or understanding the implications of market movements on currency values, the VIX can help traders make informed decisions. For those looking to trade based on sentiment and volatility, consider opening an FXOpen account to take advantage of these insights in real-time trading scenarios.
FAQ
What Is the VIX Index?
The VIX Index, known as the "fear gauge," is an index representing the expected volatility of the S&P 500 over the next 30 days. Developed by the Chicago Board Options Exchange in 1993, it gauges market sentiment and risk appetite by analysing the prices of S&P 500 index options.
What Does the VIX Measure?
The VIX measures the current market expectation of volatility, specifically 30-day forward-looking volatility. Unlike specific stock or sector movements, it reflects the overall sentiment towards volatility, indicating the level of risk or fear among investors.
How Is the VIX Calculated?
The VIX is calculated using a wide range of S&P 500 index options, both puts and calls, focusing on those with expirations between 23 and 37 days. It aggregates the weighted prices of these options to derive a measure of expected volatility.
How to Use VIX in Trading?
Traders use the VIX to gauge market risk and sentiment, assisting in decisions about portfolio hedging, timing entries and exits, and capitalising on volatility through VIX futures, options, and ETFs.
Can VIX Predict Recession?
While the VIX can indicate increased anxiety and potential downturns, it can’t signal recessions. It reflects immediate investor sentiments rather than long-term economic trends.
This article represents the opinion of the Companies operating under the FXOpen brand only. It is not to be construed as an offer, solicitation, or recommendation with respect to products and services provided by the Companies operating under the FXOpen brand, nor is it to be considered financial advice.
Stay ahead of the market!
Subscribe now to our mailing list and receive the latest market news and insights delivered directly to your inbox.


Latest articles

Weekly Market Insights with Gary Thomson: The Week of Central Banks and Earnings
In this video, we’ll explore the key economic events and market trends, shaping the financial landscape. Get ready for insights into financial markets to help you navigate the week ahead. Let’s dive in!
In this episode of Market

Intel at a Crossroads: Earnings Beat Meets Technical Resistance
Intel has just delivered its strongest quarter in over fifteen years, and the market reaction says it all. Q2 2026 revenue surged 25% year-over-year to $16.1 billion, crushing the consensus estimate of $14.42 billion, while adjusted EPS of

Tesla: Complex Range Structure Breaks Down Following Quarterly Earnings
Tesla released its Q2 2026 results after the market closed on 22 July. Revenue increased 26% year-on-year to $28.24 billion, while vehicle deliveries reached a record 480,126 units. However, operating margin fell sharply to 1.4%, down from