


Understanding the Volume-Weighted Average Price (VWAP) Indicator in Trading
FXOpen
Known for its use by both institutional and retail traders, the Volume-Weighted Average Price (VWAP) indicator is one of the most well-respected trading tools. But how does it work, and what does it tell us? Join us in this article as we dive into the world of VWAP trading, exploring its applications, advantages, and limitations.

The VWAP Indicator Explained
What does VWAP stand for? VWAP is an acronym for the Volume-Weighted Average Price indicator. There are two key terms here:
- Volume-Weighted: The calculation considers the amount of volume traded during each time period.
- Average Price: The mean price of an asset over a specified timeframe.
What Is the VWAP Indicator?
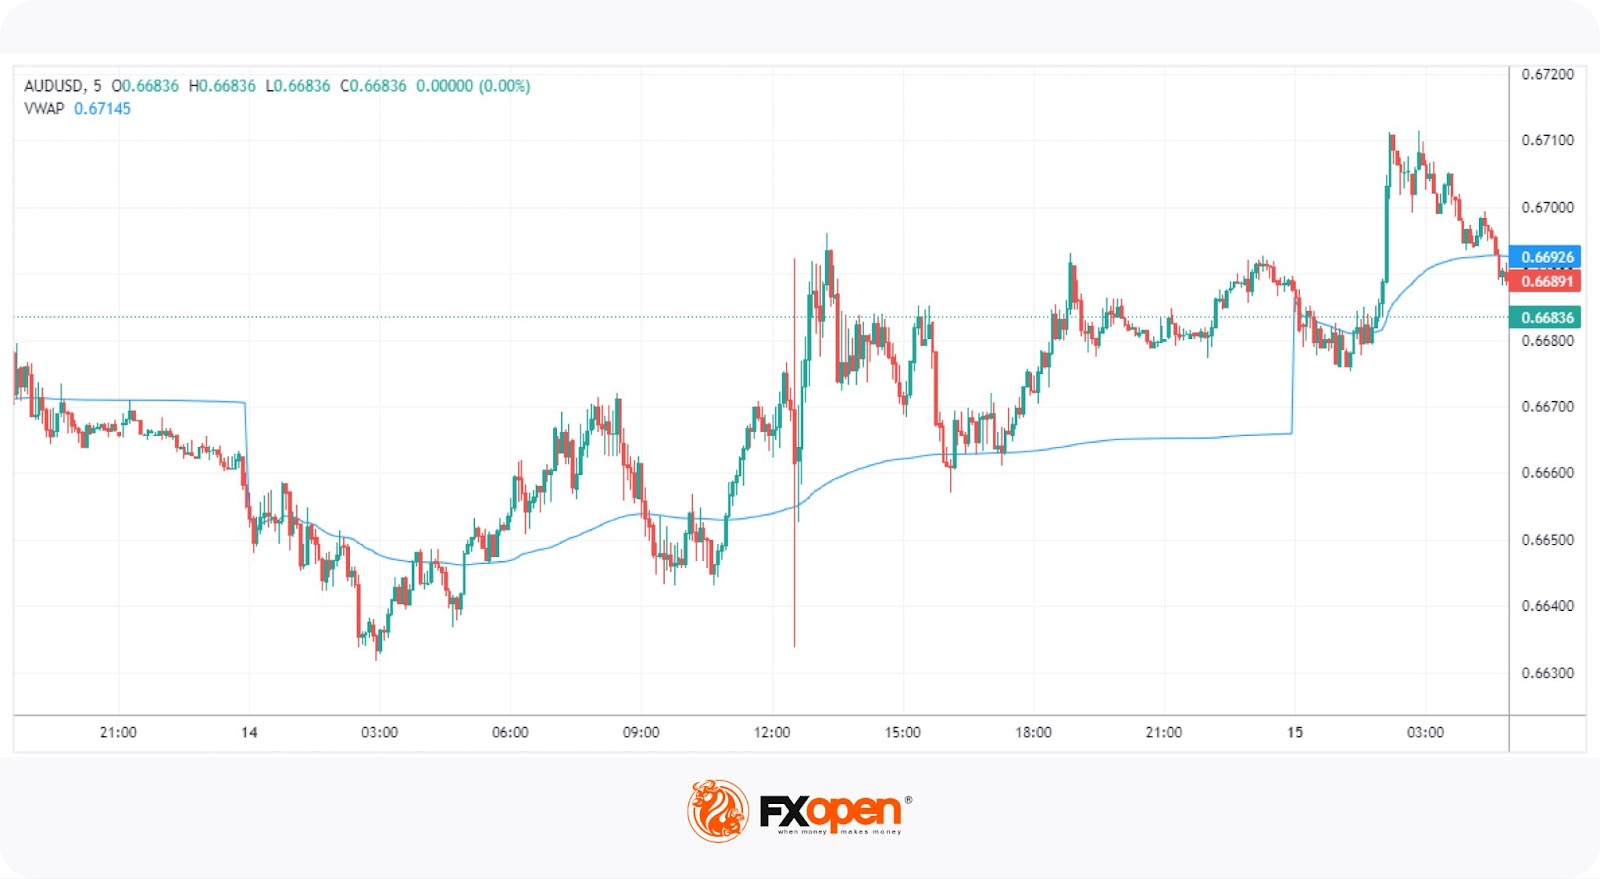
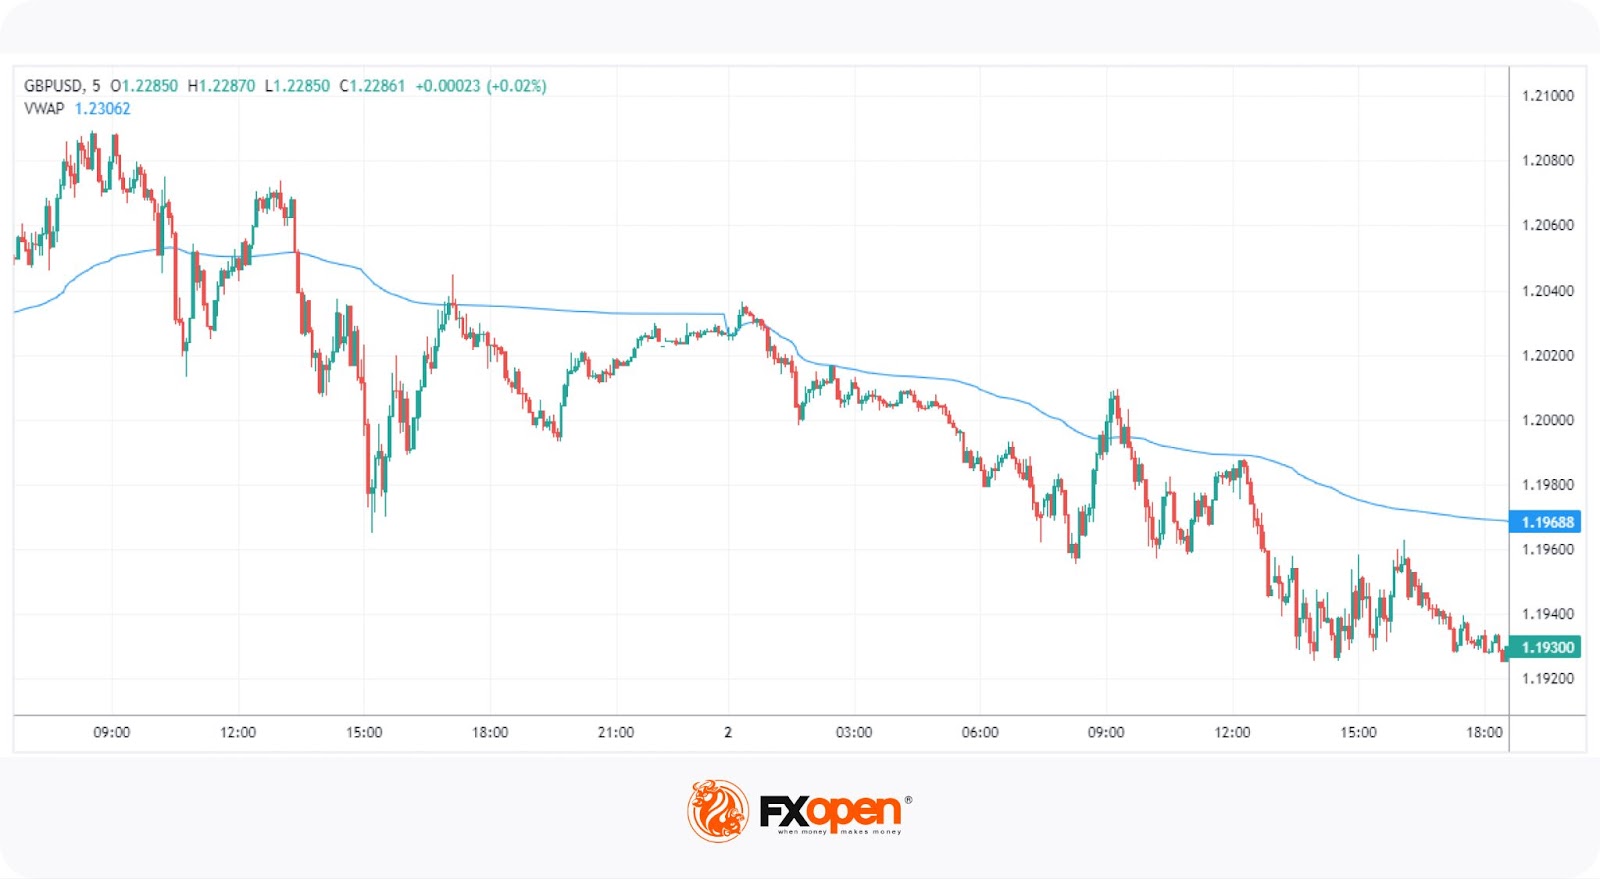
The VWAP definition refers to a technical analysis tool that calculates the average price of an asset, weighted by the volume of trades over a given timeframe (called an anchor period), typically a set trading day. At first glance, its appearance is similar to a moving average. However, instead of closely following an asset’s price, the indicator produces a relatively stable line that reflects the cumulative average price level over the anchor period.
By taking into account both price and volume data, the Volume-Weighted Average Price provides a more accurate representation of an asset's fair value. This makes it particularly useful for traders looking to identify potential entry and exit points, as well as for gauging the overall market sentiment.
How to Calculate the VWAP?
Firstly, it’s important to note that the default VWAP calculation resets at the start of each trading session. This is unlike a moving average, which will simply take an average price over a given period, such as 5 or 20 candles.
At its simplest, the VWAP formula can be expressed as:
VWAP = (Typical Price * Volume) / Volume
In practice, the specific steps involved in the Volume Weighted Average Price formula are:
1. Calculating the typical price from the session’s first candle, with the formula (High + Low + Close) / 3.
2. Multiplying the Volume of the first candle by the typical price, using (Volume * Typical Price).
3. Calculating the sum of (Volume * Typical Price) from the first candle to the current.
4. Calculating the sum of Volume from the first candle to the current.
5. Dividing the sum of (Volume * Typical Price) by the sum of Volume to produce the VWAP value.
The default VWAP settings are useful for intraday trading but may indicate less when used on higher timeframes.
The calculation may seem complicated but don’t worry. In the free TickTrader trading platform from FXOpen, you’ll find the indicator waiting for you with minimal setup required.
What Does the VWAP Indicate?
The Volume-Weighted Average Price is a versatile tool favoured by institutional and retail traders alike. Let’s take a look at some of the most common applications.
Assessing Fair Value
By accounting for both volume and price data, the Volume-Weighted Average Price can be used to determine how a security is valued compared to its “fair value.” If the VWAP level is considered to be a fair price, then movements beyond it can demonstrate that an asset is overvalued or undervalued.
This idea relates to the principle of mean reversion, which suggests that prices eventually return to their average values. Say a VWAP chart shows an asset spiking far below the line, bouncing off a key support level. Traders can then anticipate that the price will revert to the VWAP and enter a long position to capitalise on the move.
Evaluating Market Sentiment and Trends
The relationship between the price and VWAP line can help traders gauge the broader market sentiment and trend direction. If the price sits above the line, the market can be considered bullish and vice versa. This is similar to how many traders use moving averages. However, a key advantage of the VWAP is its stability, which makes it easier to identify trends.
Of course, there are occasions when the price fluctuates around the VWAP line. In this scenario, traders can consider the market to be neutral and should watch for sustained breaks above or below it.
The concepts of mean reversion and evaluating trends might sound contradictory, but in reality, there’s nothing stopping traders from using both together. For example, you may identify a bullish break above the VWAP line and anticipate further bullishness. Then, you could look to enter when the price returns to the line before it takes off bullishly again.
Identifying Support/Resistance
Like moving averages, the VWAP acts as a dynamic support and resistance level. For instance, if the market is bearish, signified by price action below the line, then it’s unlikely that the asset will begin to move above its average price.
Instead, it may simply revert to its mean and continue the bearish trend. In this sense, the Volume-Weighted Average Price is a valuable tool for timing entries, as well as for setting stop losses and take-profit targets.
Assessing Entry Quality
Some traders, including institutional and algorithmic traders, use the Volume-Weighted Average Price as a benchmark to evaluate the quality of their entries. By comparing their executed prices to the indicator, traders can determine if they are buying or selling at favourable price levels. Consistently entering above (if bearish) or below (if bullish), the VWAP indicates that their trades have a greater likelihood of success, given the concepts of fair value and mean reversion discussed earlier.
Limitations of the VWAP
While the Volume-Weighted Average Price can offer some valuable insights and help traders decipher the markets, it’s essential to be aware of its limitations.
Lag and Distortion
Since the VWAP is a cumulative indicator, it can lag, especially toward the end of the trading day. At the start of the day, it is more sensitive. As the day progresses, the calculation takes in more data and becomes less sensitive. This can result in distortion, making it less reliable for late-day trading decisions.
Poor Application in Illiquid Assets
The indicator relies heavily on the volume of trades, which means its effectiveness is limited when analysing assets with low trading volumes. With little volume data, the VWAP’s charting may appear erratic and not provide a reliable representation of an asset’s fair value.
While rarely an issue for forex and commodities, using the VWAP for stocks can be troublesome, especially if they’re illiquid. You may want to forgo applying VWAP to these stocks, meaning you’ll need to consider other types of analysis instead.
Ineffective During Strong Trends
As mentioned earlier, the Volume-Weighted Average Price may be less effective during strong trending markets. When the price persistently trades above or below the line, it could indicate that the market is experiencing a strong trend that may not revert to its average. In these situations, it’s best to consider other technical and fundamental factors before taking a trade.
Combining the VWAP With Other Indicators
To overcome some of the limitations of the VWAP and enhance its effectiveness, traders can combine it with other technical indicators. Here are a couple of complementary tools you can use.
Moving Averages
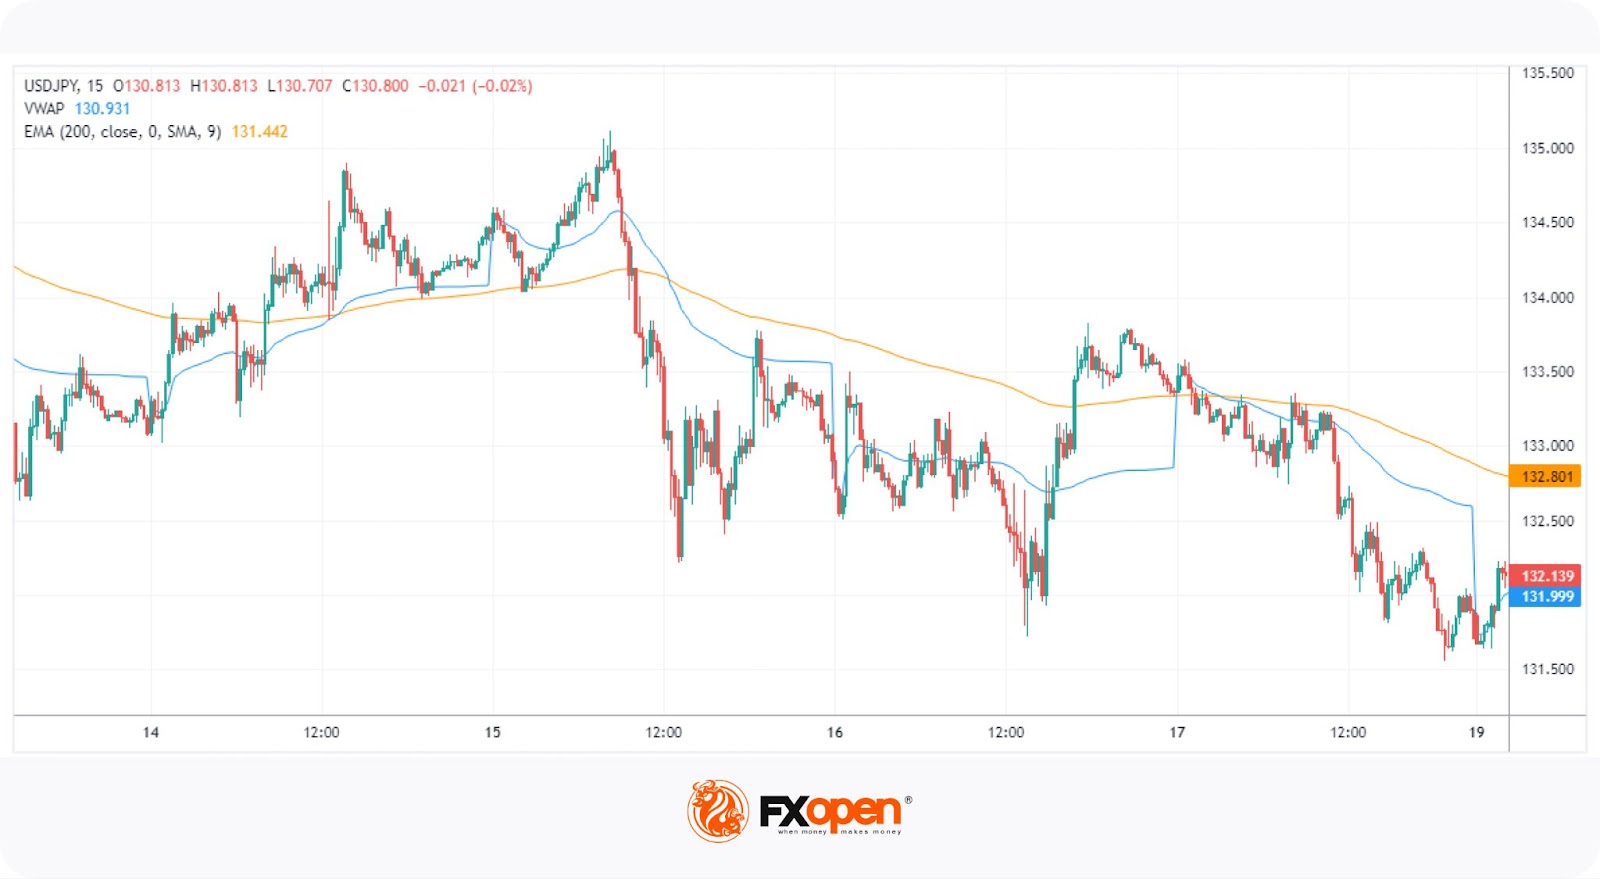
Traders can combine moving averages, like the Simple Moving Average (SMA) or the Exponential Moving Average (EMA), alongside the Volume-Weighted Average Price to confirm trends and identify potential entry and exit points.
In the example above, we’ve used the slow-moving 200-period EMA (orange) to help identify potential entries. When the Volume-Weighted Average Price crosses above the EMA, a bullish trend is signalled, and vice versa. Traders could use the Volume-Weighted Average Price to determine that the price is trending in a given direction, then wait for validation from an EMA crossover before entering the market.
Relative Strength Index (RSI)
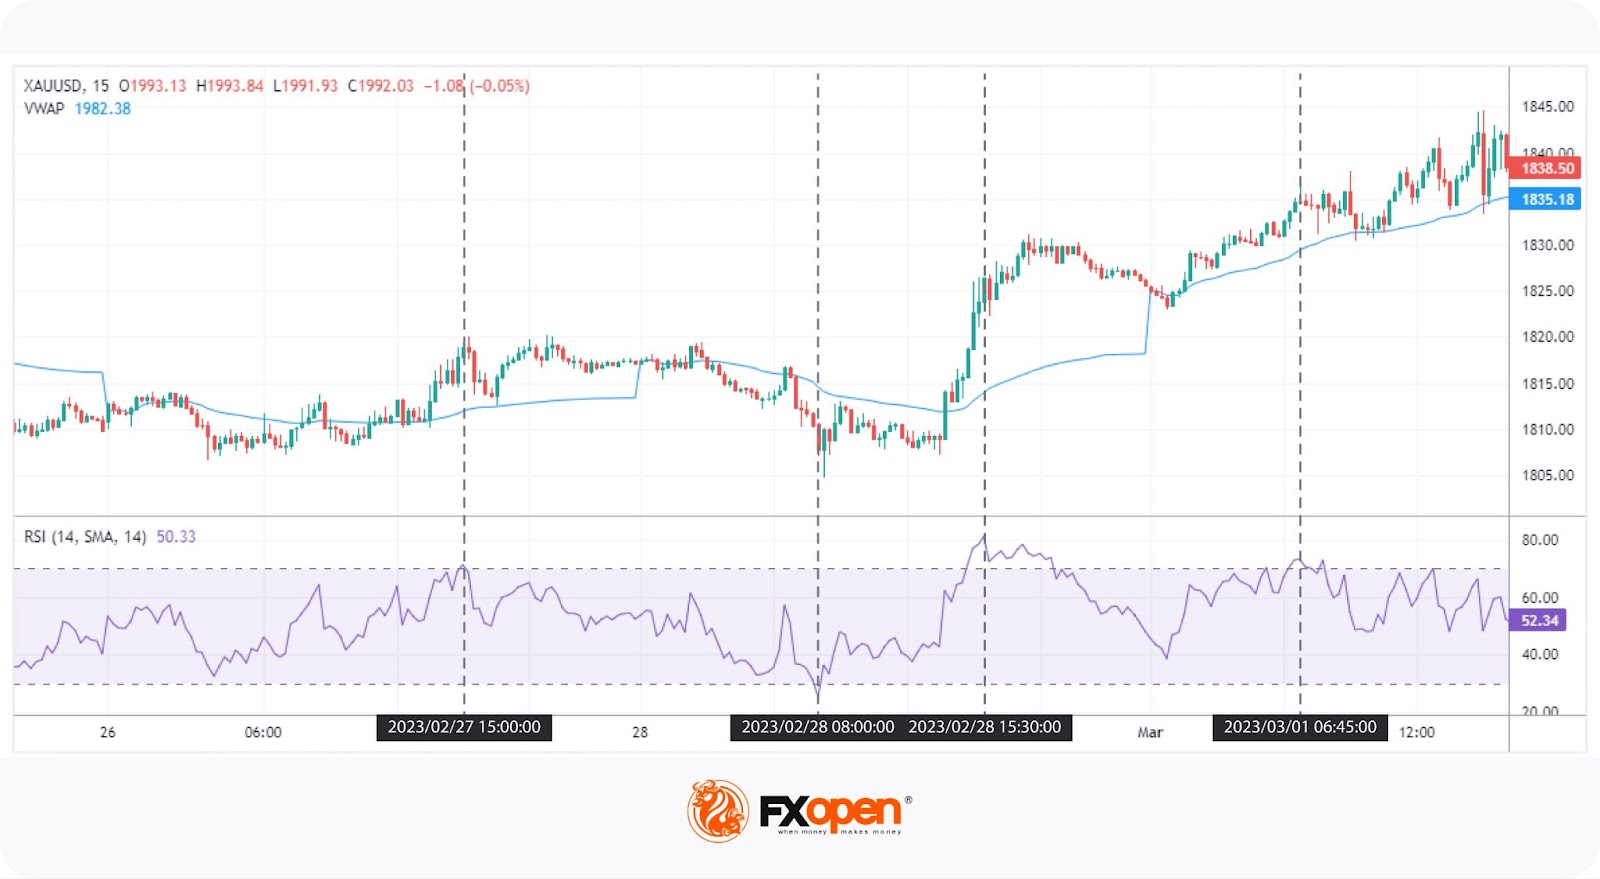
How to use VWAP and RSI together? RSI is a momentum indicator that measures the speed and change of price movements. When used alongside the VWAP, the RSI can help traders identify overbought or oversold conditions in the market and find mean reversion opportunities.
In this RSI and Volume-Weighted Average Price example, we see four areas where the RSI determines the asset being overbought or oversold. In each scenario, traders could begin to consider entries to capture the move back to the VWAP, given the confirmation signal from the RSI.
VWAP and RSI Strategy
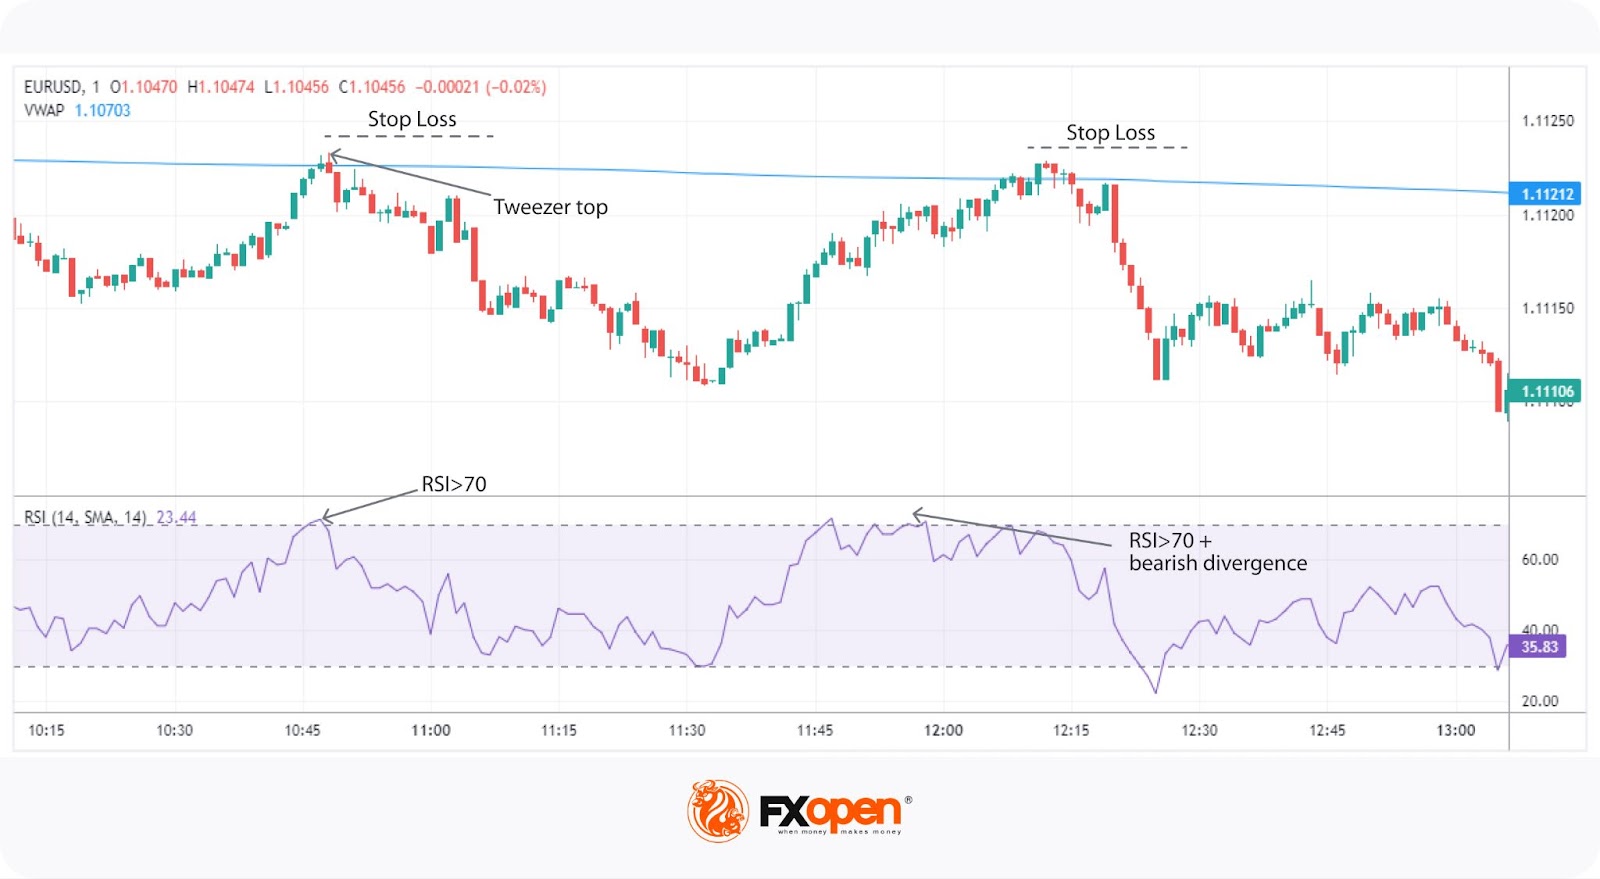
This VWAP trading strategy leverages the Volume-Weighted Average Price as a dynamic support or resistance level, combined with the RSI indicator for additional confirmation of a reversal and backed by a candlestick/chart pattern. By observing the price action relative to the VWAP and interpreting RSI signals, traders can identify entry and exit points.
Entries
Bullish Entry
The price should be above the VWAP. The trader looks for a pullback where the price returns to it. The RSI should dip into oversold territory (below 30) or slightly above, indicating a potential upward move is due. Added confirmation from a bullish candlestick/chart pattern or divergence strengthens the setup.
Bearish Entry
The price should be below the VWAP. A pullback occurs, where the price returns to the VWAP level. The RSI should rise into overbought territory (above 70), or slightly below, suggesting a potential downward move. A bearish candlestick/chart pattern or divergence offers further confirmation.
Stop Loss
Stop Loss for Bullish Entry
Placed just below the swing low formed around the VWAP support level.
Stop Loss for Bearish Entry
Set slightly above the swing high formed near the VWAP resistance level.
Take Profit
Exit for Bullish Trades
When the price reaches a suitable resistance level or hits a set risk-reward target.
Exit for Bearish Trades
When the price reaches a suitable support level or achieves the desired risk-reward ratio.
Your Next Steps
The Volume-Weighted Average Price can be a powerful tool when used correctly. It offers some valuable insights, such as helping traders assess an asset’s fair value and identify dynamic support/resistance levels. Wondering which steps to take from here? You can try this:
1. Experiment with the indicator across different timeframes and observe how the price reacts as it fluctuates above and below the line.
2. Already have a strategy? Monitor your entry quality by comparing your executed price to the VWAP.
3. When you feel ready to start putting your strategy to work, open an FXOpen account to gain access to a full suite of trading tools and dozens of markets!
FAQ
What Is a VWAP in Trading?
The Volume-Weighted Average Price (VWAP) meaning refers to a trading indicator that shows the average price of an asset, weighted by the volume of trades, over a specific period. It helps traders determine an asset's fair value by considering both price and volume, making it useful for identifying entry and exit points.
Is a VWAP Better Than an EMA?
VWAP and Exponential Moving Average (EMA) serve different purposes. While the former considers both price and volume for its calculation, the latter focuses solely on price, giving more weight to recent data. The VWAP is better for understanding market sentiment within a trading day, while the EMA is often preferred for longer-term trend analysis.
Do Professional Traders Use the VWAP?
Yes, professional traders frequently use the Volume-Weighted Average Price as it helps them make informed trading decisions. It serves as a benchmark for executing large orders, assessing market trends, and identifying optimal entry and exit points. The VWAP is particularly valuable for institutional traders aiming to minimise market impact and avoid buying at higher prices or selling at lower ones throughout the trading day.
What Is the 5-Minute VWAP?
The 5-minute VWAP recalculates the price value using 5-minute intervals. It’s an unconventional indicator type used by day traders to gain a more granular view of intraday price movements and gauge short-term trends.
This article represents the opinion of the Companies operating under the FXOpen brand only. It is not to be construed as an offer, solicitation, or recommendation with respect to products and services provided by the Companies operating under the FXOpen brand, nor is it to be considered financial advice.
Stay ahead of the market!
Subscribe now to our mailing list and receive the latest market news and insights delivered directly to your inbox.


Latest articles

US Dollar Index: A Defining Week for the King of the Markets
The dollar heads into a pivotal week trading near 101.80, just off a 15-month high, with the Fed's July 29 meeting standing as the clear focal point. Markets currently price roughly a 65% chance of a hold, though renewed

NZD/USD: Inflation Surge Meets Strong US Dollar Pressure
On 21 July, Stats NZ reported an acceleration in inflation: the Consumer Price Index rose 1.5% in the second quarter, while the annual inflation rate climbed to 4.1%, its highest level in more than two years and slightly

Weekly Market Insights with Gary Thomson: The Week of Central Banks and Earnings
In this video, we’ll explore the key economic events and market trends, shaping the financial landscape. Get ready for insights into financial markets to help you navigate the week ahead. Let’s dive in!
In this episode of Market