


FXOpen

The price of oil rallied for most of the year and, at one point, it looked like $100/barrel was just a question of time. However, it topped at $85 before correcting into the holidays season.
With just one trading week to go until 2022, what may move the oil price next year?
Global oil demand to rise to pre-pandemic levels
According to OPEC's latest oil market report, global oil demand is expected to reach pre-pandemic levels despite the energy crunch and new COVID-19 waves impacting the demand in the first half of the year.
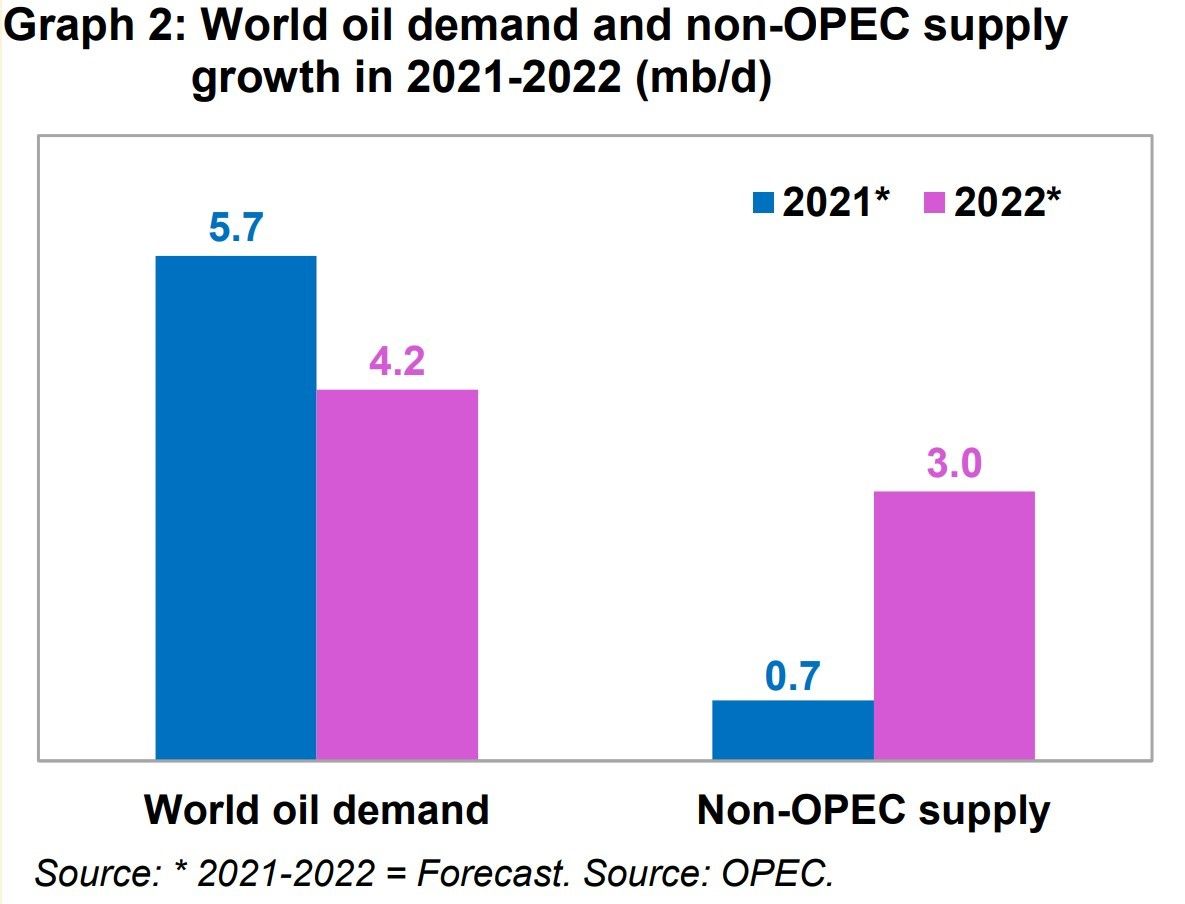
OPEC is expected to limit its oil supply, while supply from non-OPEC countries will increase. In the past decade, oil supply became inelastic because of low investments in fossil fuels. As such, imbalances in the supply and demand function may trigger future sharp moves in the price of oil.
Everyone talks about energy transition in order to reach the climate change goal of net-zero carbon emissions by 2050. But the transition is likely to support oil prices due to the difference between the investments needed ($1.5 trillion) and the actual investments ($1 trillion). In other words, current investment in fossil fuels and alternatives is insufficient to satisfy demand trends.
The price of oil formed a double top pattern at $85 and has been in correction ever since. It found support in the $65 area before bouncing, but the $20 drop was not strong enough to invalidate the bullish trend. A bullish trend is defined by a series of higher highs and higher lows, and the series was not broken during the recent move lower.
All in all, the price of oil remains bullish while above $65. A move above $85 would likely trigger more strength, with market participants focusing on the round $100.
The Iranian nuclear deal might become a game-changer for the price of oil in 2022. Negotiations over the nuclear agreement resumed last November, but the 1.3 mbd of missing Iranian oil is unlikely to come back to the market soon.
This article represents the opinion of the Companies operating under the FXOpen brand only. It is not to be construed as an offer, solicitation, or recommendation with respect to products and services provided by the Companies operating under the FXOpen brand, nor is it to be considered financial advice.
Stay ahead of the market!
Subscribe now to our mailing list and receive the latest market news and insights delivered directly to your inbox.


Latest articles

XBR/USD Chart Analysis: Price Rebounds from a Seven-Week Low
On 1 December, we outlined a descending channel on the XBR/USD chart and noted that the bearish trend was driven by fading geopolitical risks. Indeed, hopes for an end to the war in Ukraine—along with the possibility of

Silver Price Hits Historic Record Around $64
On 27 November, we suggested that silver was preparing to challenge its all-time high. Since then (marked with the orange arrow), XAG/USD has risen by roughly 18%, breaking above the psychological $60-per-ounce threshold for the first time in history.