


Will We See Santa Rally This December?
FXOpen
As this trading, pandemic-stricken year is nearing its end, the one thing left to emphasize is the stock market's rally. Not all market indices have rallied, for example, emerging markets: their indices performed poorer than developed markets by more than 20%.
The strongest rally happened in the United States. All major indices, Dow Jones, Nasdaq 100, and S&P 500, are nearing their all-time highs. Nothing could deter their advance. For most of the year, the tapering of asset purchases had been the main reason to expect a correction. The Fed did announce tapering, a small correction did happen, but only for bulls to step in and buy the dip again.
With the Fed's meeting looming large next week, is it possible for stocks to reach their new all-time highs? Also, is a Santa Rally possible even with the Fed turning hawkish?
What is a Santa Rally — and what are the chances to see one This December?
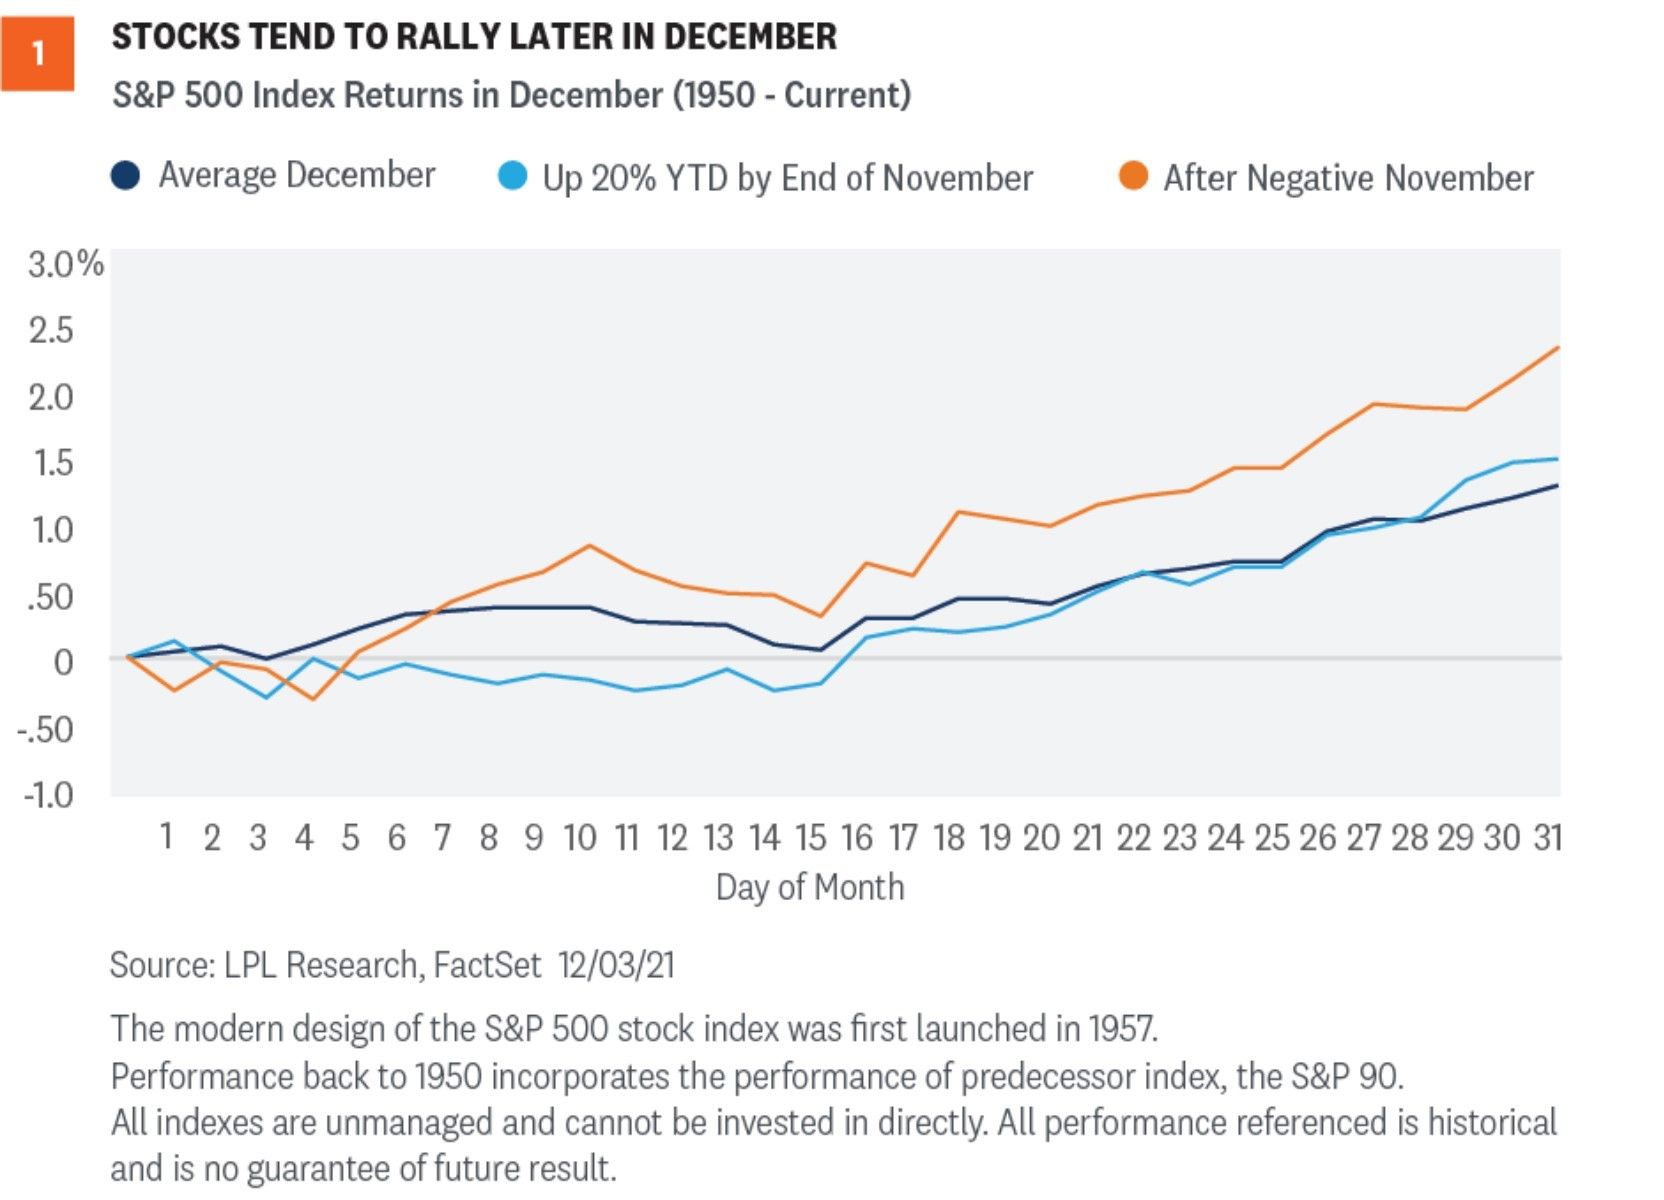
Stocks tend to rally later in December, hence the Santa Rally name. A close look at the chart above shows that the chances for a Santa Rally are quite high. Most rallies occur after December 20, and if, say, the S&P 500 goes up more than 20% YTD, as is the case this year, it will outperform the average December return. The performance record dates back to 1950, so it is fair to say the likelihood is high for the stock's rally going on.
Furthermore, after this year’s negative November, December has delivered a positive return of 2.7% on average, with a probability of 86.3%. In other words, investors are betting on continuation of the economic recovery despite Omicron fears and the Fed's intentions to tighten the policy.
All in all, a Santa Rally is not just a possibility but a probability; 86.3% is enough to keep buyers in control.
This article represents the opinion of the Companies operating under the FXOpen brand only. It is not to be construed as an offer, solicitation, or recommendation with respect to products and services provided by the Companies operating under the FXOpen brand, nor is it to be considered financial advice.
Stay ahead of the market!
Subscribe now to our mailing list and receive the latest market news and insights delivered directly to your inbox.


Latest articles
DAX 40: Can the Index Print Fresh Record Highs Once Again?
The DAX 40 has shed more than 2% over the past several sessions, breaking a rally that had pushed the index to record highs on the back of Germany's fiscal pivot toward defence, infrastructure and climate spending. The pullback raises

US Dollar Consolidates Ahead of FOMC Minutes Release
The US dollar has entered a period of consolidation following last week's sharp price swings, as market participants turn their attention to the release of the Federal Reserve's latest meeting minutes. Investors are looking for additional guidance on the future

EUR/USD Analysis: Who Is in Control?
Two central banks, two hawkish tones — but only one dollar just took a hit. The ECB delivered a 25bp hike in June, its first since 2023, lifting the deposit rate to 2.25% as Middle East-driven energy costs pushed headline