XRP/USD and EOS/USD showing potentially short-term increase but an outlook is grim
XRP/USD
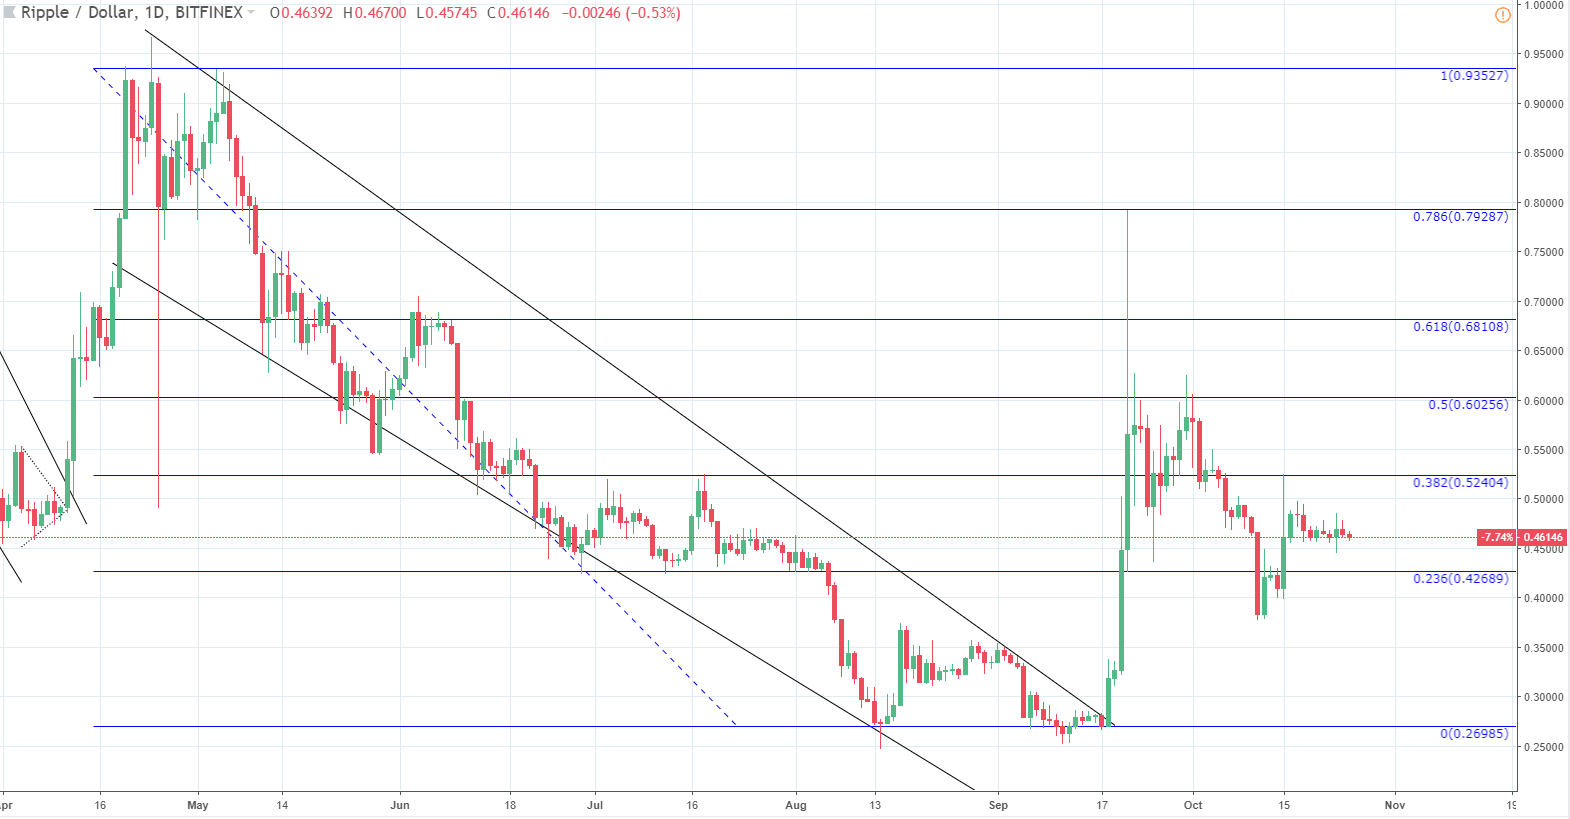
Last Monday, October 15th, the price of Ripple started the week at $0.4 at the open and in five hours managed to spike up to $0.52404 which is an increase of 30.45%.
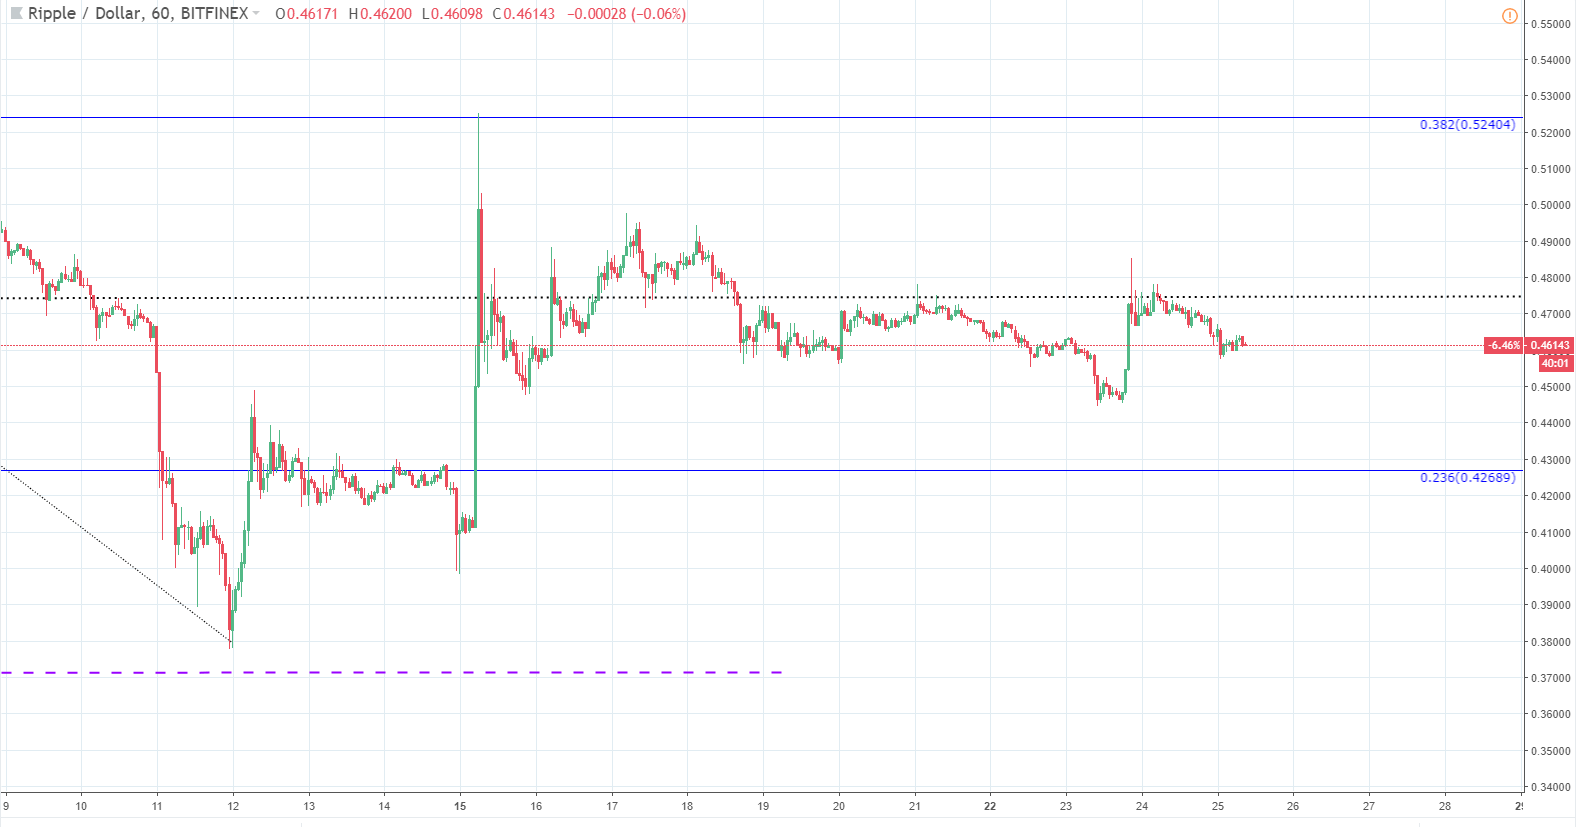
After a massive rise the price action has been stuck in a corrective range with the price currently being below the range median line at $0.475. It is heading downwards as the price was rejected by the level once again. Measured from the last Monday’s opening price to the current levels, XRP is up by 12.92% which is a good recovery after the prior drop to $0.378.
Zooming out onto the daily chart you can see the Fibonacci levels clearly as they are measured from 20th of April when the price was $0.9352 to the August 14th low at $0.26985. The price action is currently between 0.236 and the 0.382 Fibonacci retracement level which was interacted with on last Monday’s spike.
As the price broke out from the descending channel with a massive impulsive move on September 18th and an increase of 115.6% measured from the 0 Fibonacci retracement level to just slightly below the 0.5 Fibonacci retracement level at $0.577, a correction occurred and we are now seeing another minor one in play.
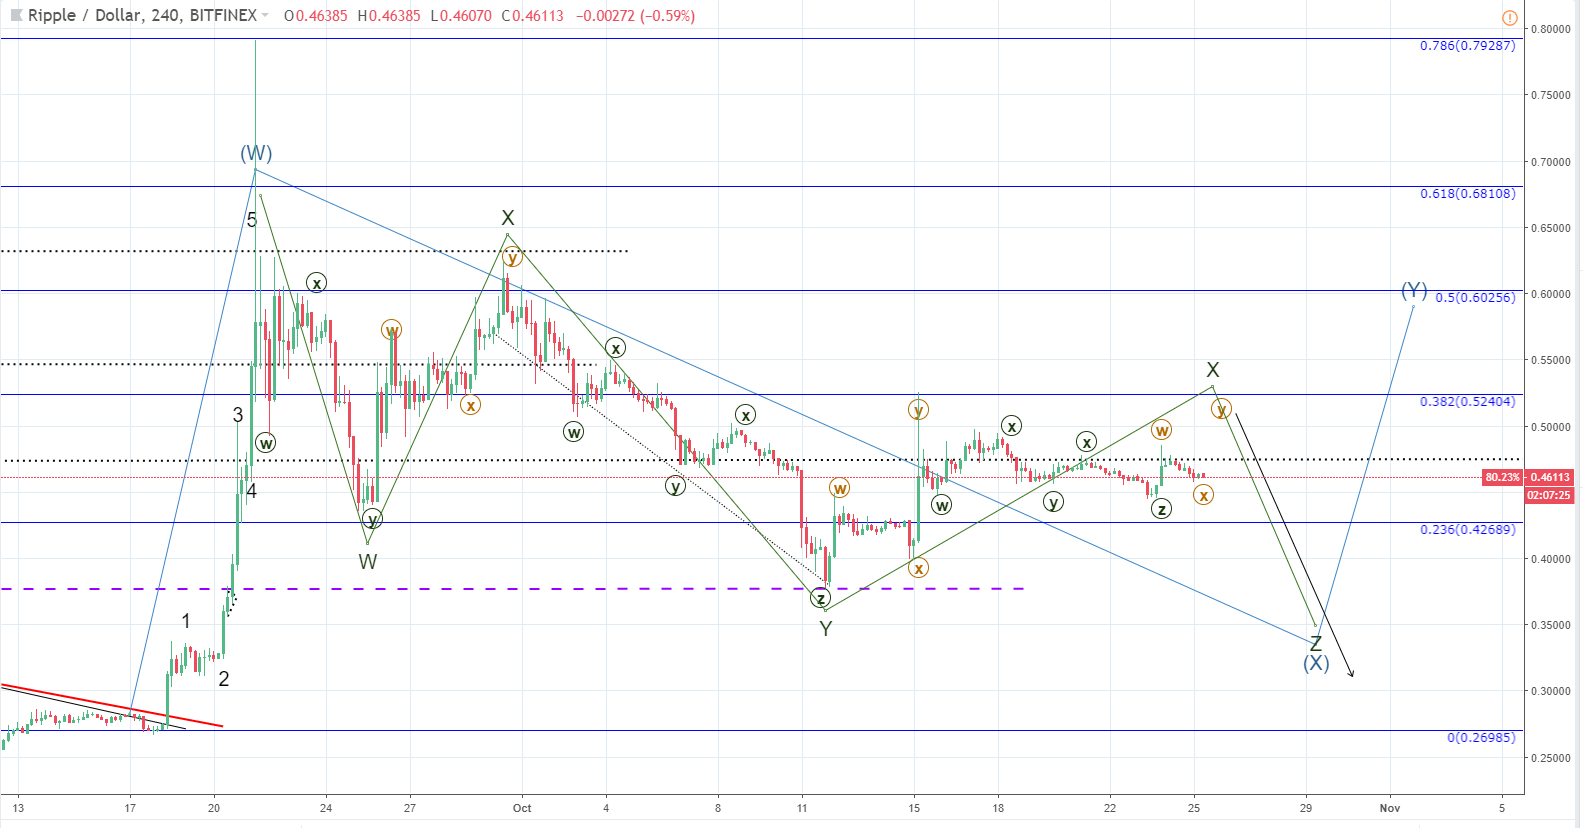
In order to determine the potential direction of further price action movement I have counted the sub-corrective structures within the last move from September 18th.
Looking at the 4-hour chart you can see my Elliott Wave count. It points out that the correction has move sideways movement to go before further decline. As this is likely a three wave correction after the mentioned decline to $0.269, more upside can be seen and short-term is yet more likely so as the minor wave X is about to complete. For the upcoming period I would be looking at the opportunity to short sell XRP/USD.
EOS/USD
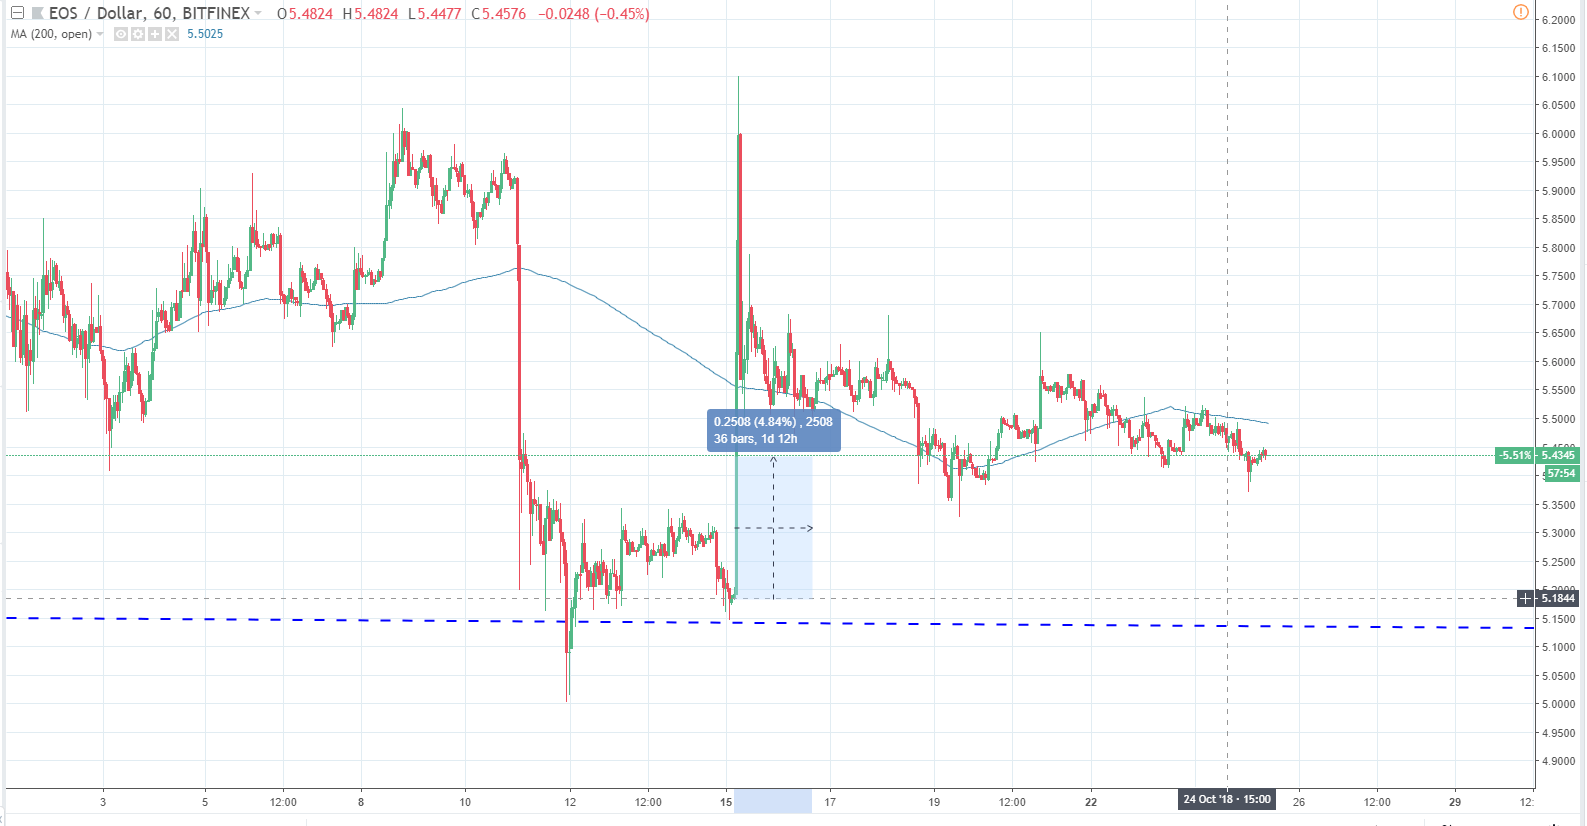
From last Monday the price of EOS has increased by 4.84% coming from $5.18 to the current levels of $5.43.
Looking at the hourly chart you can see that the price action has formed a descending channel after the spike up to $6.1. Currently the price action is below the MA (200, open) but is now in an upward trajectory once again heading towards it and judging by the wick from the downside the buyers are present. We might see the price go beyond it if the momentum is kept up.
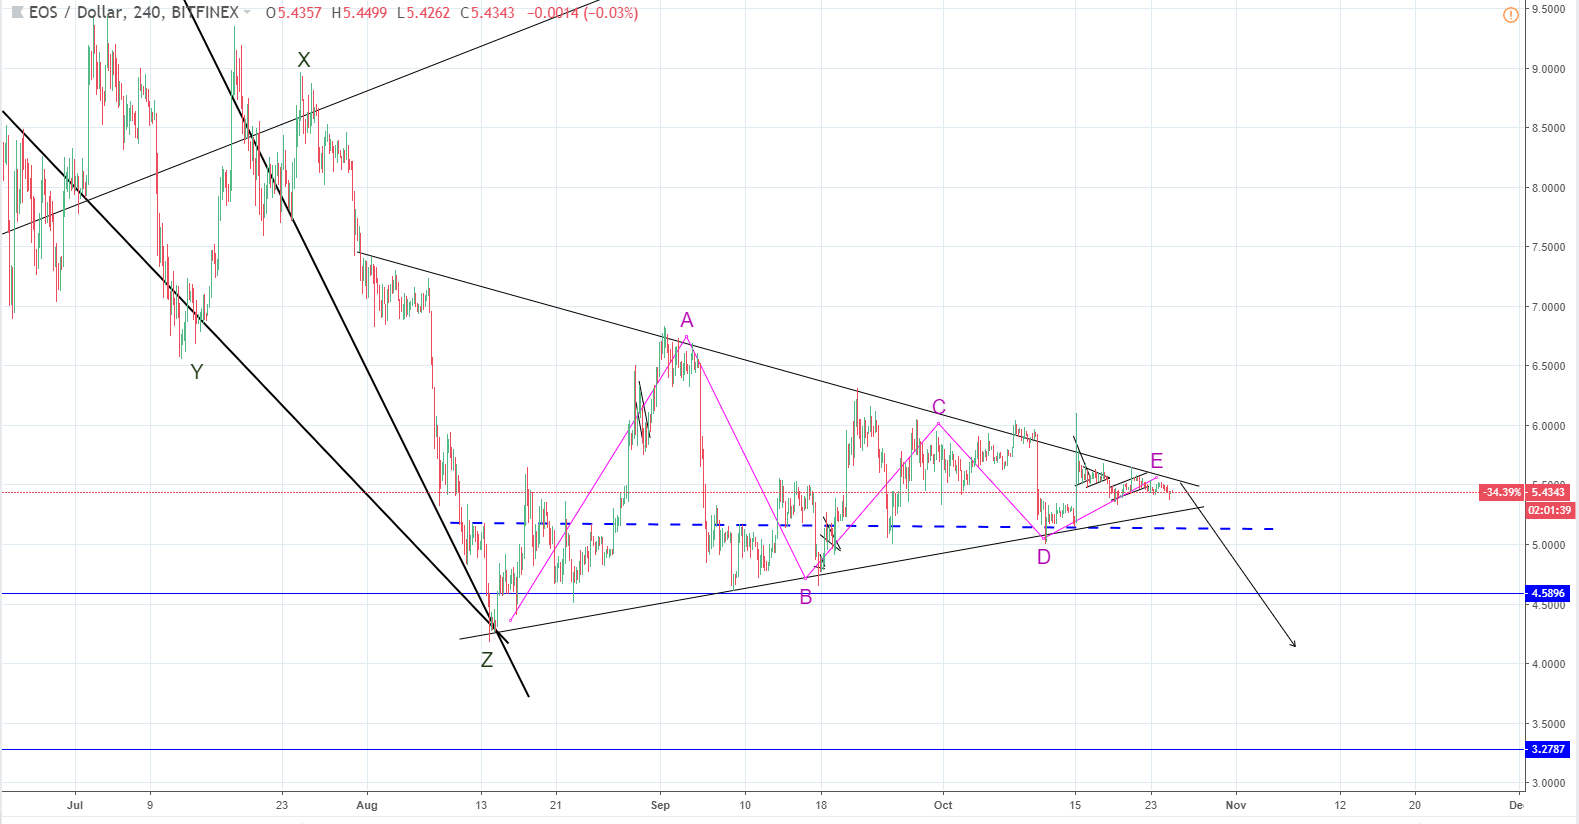
Zooming out to the 4-hour chart you can see that the price action is currently in a symmetrical triangle, which can be interpreted as a bearish pennant. Considering the last move down resulted with a decrease of over 80% and was from the all-time high at $22 to where the wave Z is around $4.5 area, the triangle is consolidative in nature.
You can also see this labeled as and ABCDE correction, but the E wave just might not be over yet. The price might increase further up and go beyond the triangles resistance line before dropping down again inside the triangles territory resulting as a fake-out. It could cause those who were reassured that the price isn’t going up further to panic sell their positions, which would lead up to the further price drop. The next horizontal level, which is strong enough to hold the momentum, would be at first around $4.5 but I would expect the price to go further down potentially to 3.27.