


FXOpen

Last week, the market sentiment turned bullish after Ripple touched a low of $0.4915 on April 6 and started to correct. The market opened bullish this week.
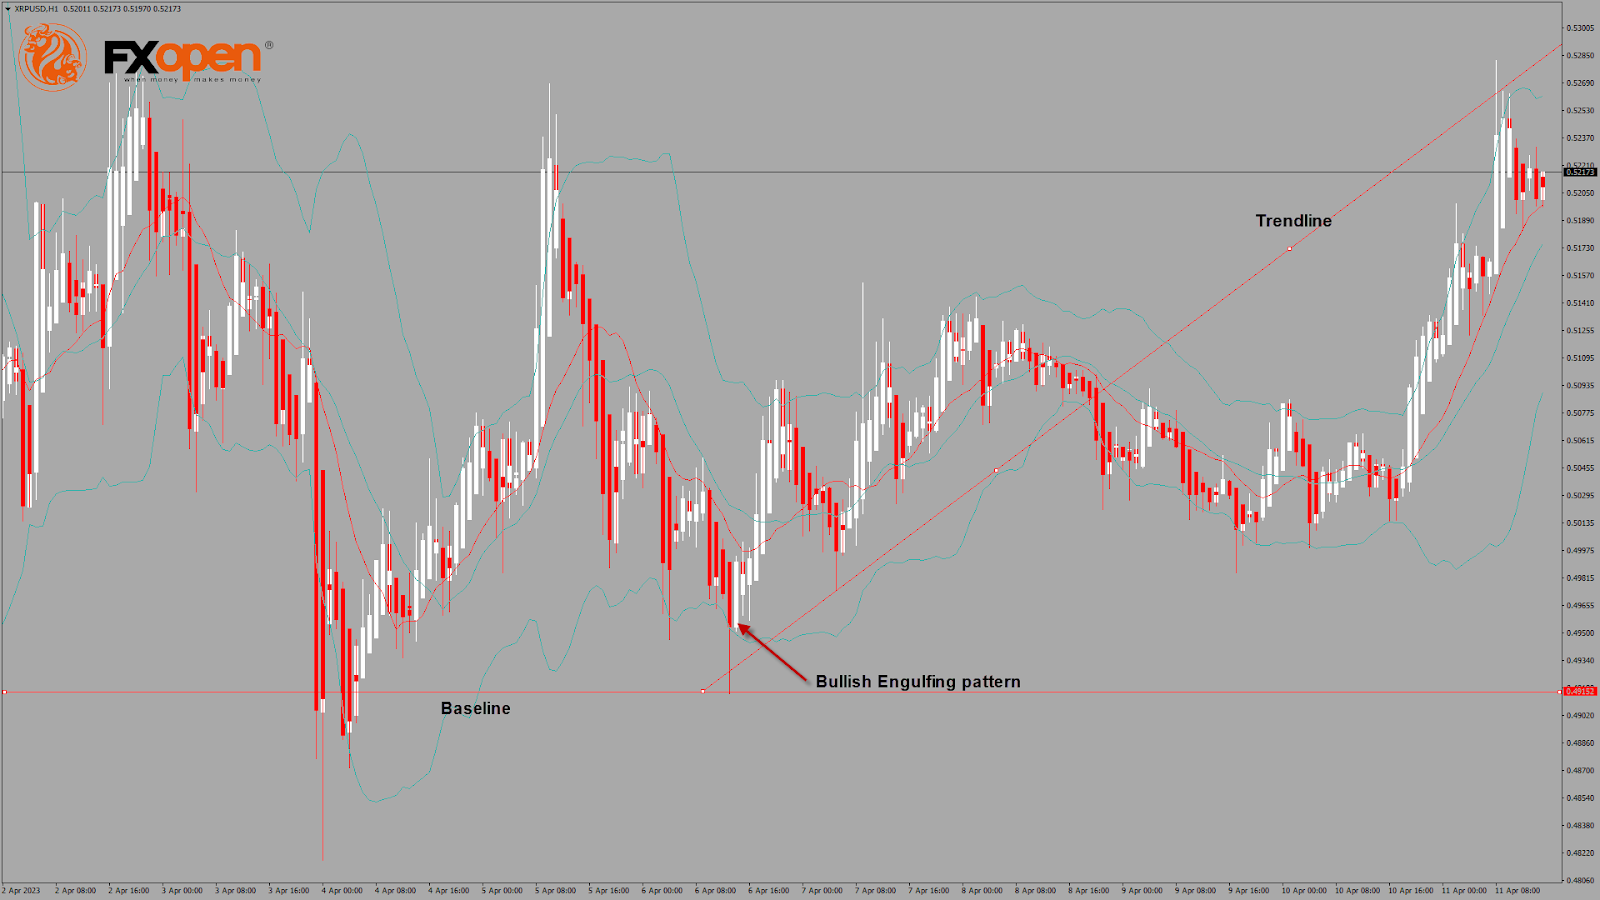
On the hourly chart:
- The relative strength index is at 60.40, which signifies a strong demand for Ripple at the current market prices and the continuation of the bullish phase in the market.
- Moving averages signal an upward price movement at the current market level of 0.5203.
- Both the STOCH and CCI are in the neutral zones, which means the price is now resting in the consolidation zone.
- Ripple is now trading just below its pivot level of 0.5209 and is now facing its classic resistance at 0.5221 and Fibonacci resistance at 0.5241, after which it will be able to move towards 0.6000.
Some of the major technical indicators are bullish.
- Ripple bullish reversal is seen above 0.4915.
- The price is below its pivot level.
- Average true range indicates HIGH volatility.
We have also detected a bullish price crossover with 20 and 50-period moving averages in the weekly timeframe.
Ripple Bullish Reversal Seen Above $0.4915
We can see that Ripple continues to move bullish, and further resistance levels are at 0.5600 and 0.6000. There is a bullish engulfing pattern above the $0.4913 handle on the hourly chart.
There is a bullish Doji star pattern in the 2-hour timeframe.
The Aroon indicator is signaling a bullish trend in the 15-minute timeframe.
The short-term outlook for Ripple has turned bullish, the medium-term outlook is bullish, and the long-term outlook is neutral.
We can see an increase of around 77% in the trading volumes of Ripple as compared to yesterday, which is indicative of growing investor sentiment in the market.
This Week Ahead
Ripple continues its bullish momentum from last week and has managed to cross $0.5200 levels. The next visible targets are located at $0.5600 and $0.5800.
Now, the prices have entered a consolidation zone.
The resistance level is located at $0.5213, which is 14-3 Day Raw Stochastic at 70%.
We can see a continuous progression of a bullish trendline formation from $0.4913 to $0.5300.
The support level is located at $0.5085, which is a pivot point, and at $0.5014, which is a 3-10 Day MACD Oscillator.
The weekly outlook for Ripple is $0.5800 with a consolidation zone of $0.5600.
FXOpen offers the world's most popular cryptocurrency CFDs*, including Bitcoin and Ethereum. Floating spreads, 1:2 leverage — at your service (additional fees may apply). Open your trading account now or learn more about crypto CFD trading with FXOpen.
*Important: At FXOpen UK, Cryptocurrency trading via CFDs is only available to our Professional clients. They are not available for trading by Retail clients. To find out more information about how this may affect you, please get in touch with our team.
This article represents the opinion of the Companies operating under the FXOpen brand only. It is not to be construed as an offer, solicitation, or recommendation with respect to products and services provided by the Companies operating under the FXOpen brand, nor is it to be considered financial advice.
Stay ahead of the market!
Subscribe now to our mailing list and receive the latest market news and insights delivered directly to your inbox.


Latest articles

FX Market Awaits Macro Data: EUR/USD and GBP/USD Near Range Boundaries
European currencies are trading without a clear direction against the US dollar, remaining in a consolidation phase following the earlier decline driven by USD strength. At the start of the week, both EUR/USD and GBP/USD attempted a recovery,

Market Analysis: AUD/USD, NZD/USD Struggle at Resistance, Upside Risks Diminish
AUD/USD is attempting a recovery wave from 0.6910. NZD/USD is also correcting losses and might recover if there is a clear move above 0.5885.
Important Takeaways for AUD/USD and NZD/USD Analysis Today
· The Aussie

Tesla (TSLA) Shares Surge Following Musk’s Announcements
According to the chart, Tesla (TSLA) shares had been under significant pressure since the start of 2026: from their December high, they had lost around 25% of their value. The main bearish drivers included:
→ Intense competition from Chinese automakers, particularly