


Quasimodo Pattern in Trading
FXOpen
The Quasimodo pattern is a reversal structure that closely resembles the Head and Shoulders. Many traders overlook it or mistake it for its more popular counterpart in price action trading. The QM pattern has distinct entry, stop-loss, and take-profit rules that set it apart. This article covers its structure, the methods used to confirm signals, and the execution rules.
Quasimodo Pattern Structure Explained
The Quasimodo pattern is a reversal chart structure that forms at the end of a trend. The QM pattern relies on a failed continuation. Price prints a higher high (or lower low) in line with the trend. Then it reverses and breaks the prior swing in the opposite direction. This break invalidates the previous structure and signals exhaustion. QM pattern trading suits any timeframe. A Quasimodo trading strategy may be used across forex, stock, and commodity charts.
The pattern has two variants:
- Bearish Quasimodo: appears after an uptrend and signals a potential downtrend.
- Bullish Quasimodo (inverse): appears after a downtrend and signals a potential uptrend.
Bearish and Bullish QM Structure
A bearish QM occurs at the end of an uptrend and signals the formation of a new downtrend. It consists of three peaks (a head in the middle and two shoulders at the sides) and two troughs. The second peak (head) is the highest, and the second trough is the lowest.
A bearish QM reversal pattern forms in six moves:
- Price prints a left shoulder high, then pulls back to the first trough.
- It pushes to a higher high (the head), then pulls back below that trough.
- Price rallies to a right shoulder lower than the head.
- The lower low between head and right shoulder breaks bullish structure.
- Price moves downward from the right shoulder.
- Failure to retake the head confirms sellers have taken over.
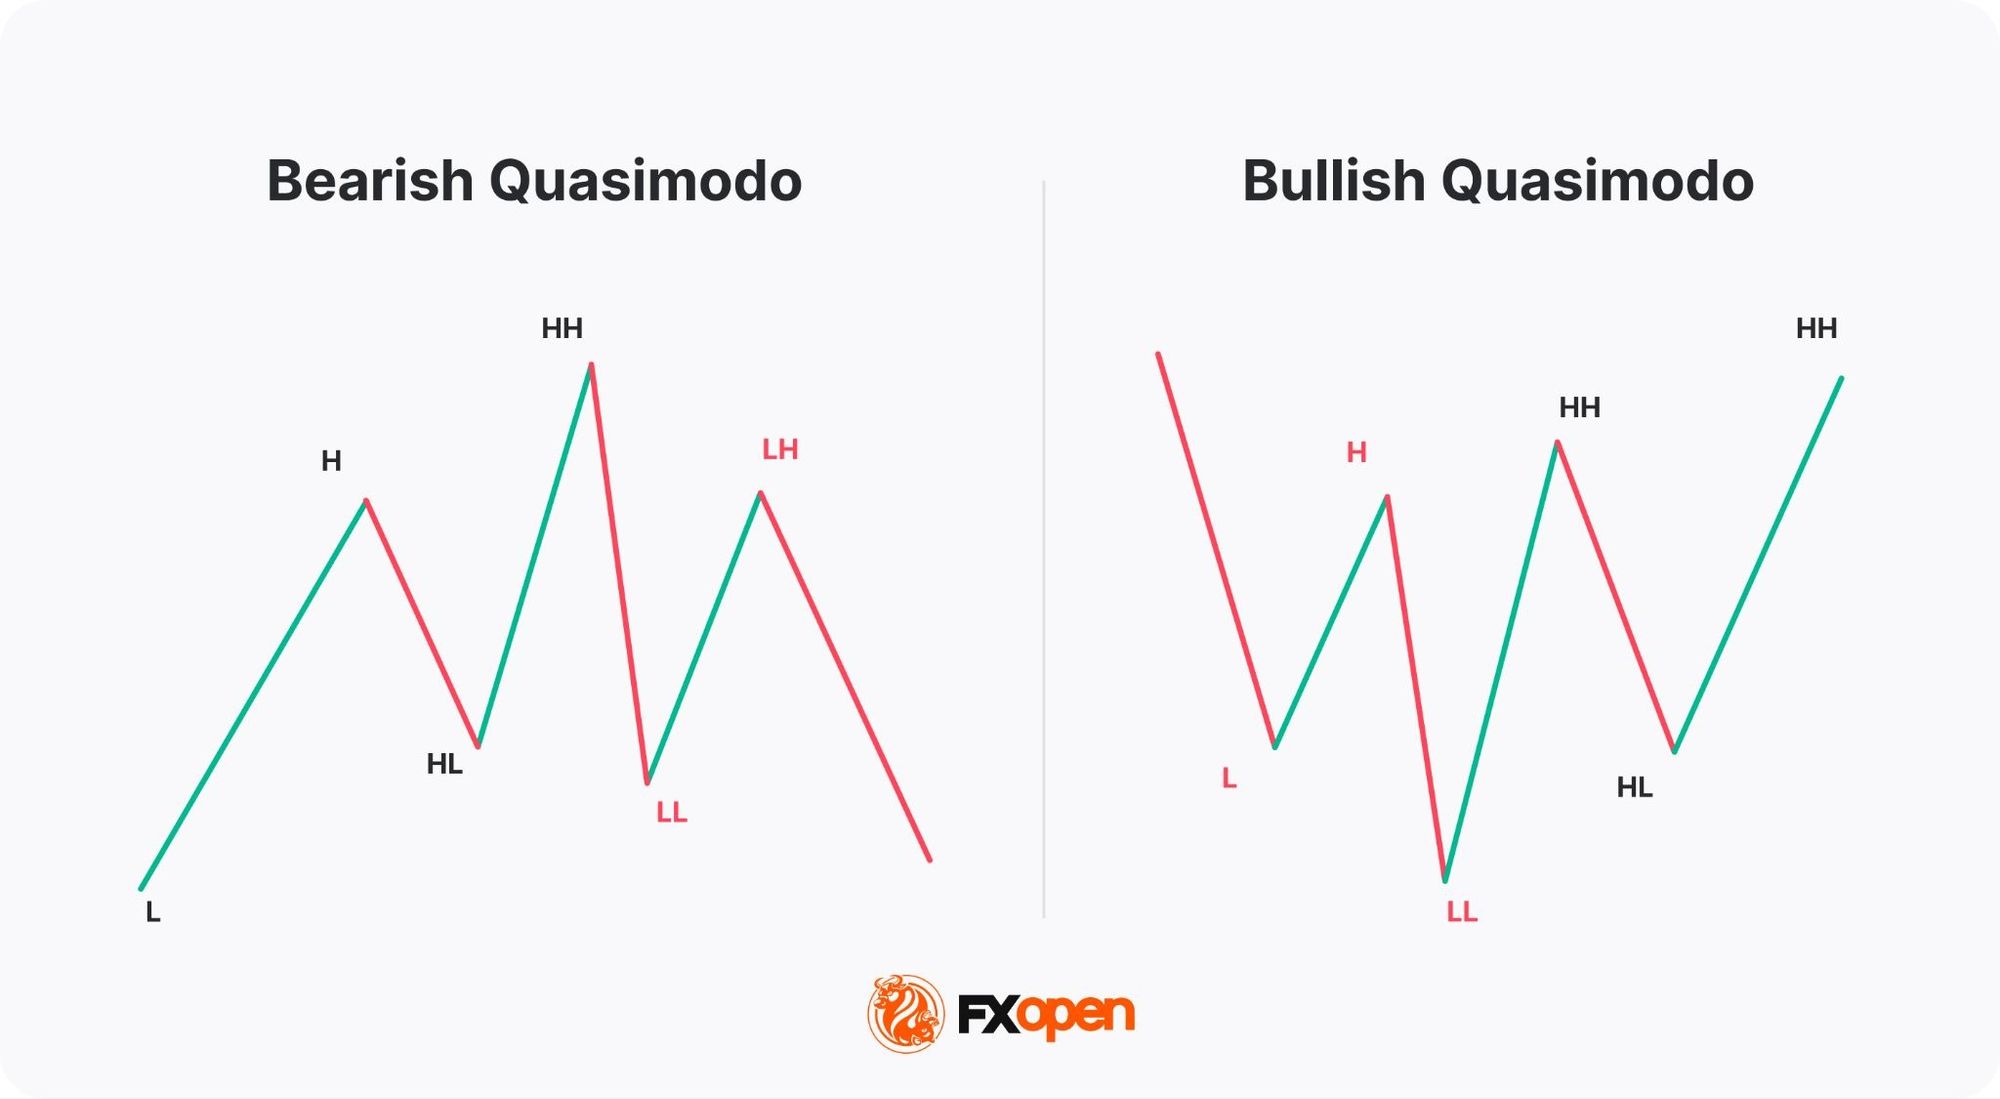
A bullish (inverse) Quasimodo occurs at the end of a downtrend and signals a potential uptrend. It consists of three lows (a head in the middle and two shoulders at the sides) and two tops, where the second trough (head) is the lowest and the second top is the highest.
A bullish QM forms in six moves:
- Price prints a left shoulder low, then rallies to the first peak.
- It pushes to a lower low (the head), then rallies above that peak.
- Price pulls back to a higher low (right shoulder).
- The higher high between head and right shoulder breaks bearish structure.
- Price reverses upward with the right shoulder.
- Failure to retake the head's low confirms buyers have taken over.
Market Structure Behind the QM Pattern
The QM pattern reflects a specific shift in market structure. Price extends the prevailing trend by sweeping the prior swing high or low. This sweep often triggers stops and absorbs liquidity sitting above old highs or below old lows.
Buyers (or sellers) fail to push price further. The market then reverses and breaks the opposite swing, invalidating the trend's structure. This failed continuation is what gives the QM its reversal signal.
In terms of reliability, the Quasimodo pattern is considered useful for identifying trend reversals, particularly when supported by other technical indicators like the RSI or MACD. Unlike more common patterns, the QM pattern provides distinct entry and exit points.
Its reliability might increase in strongly trending markets, where the previous trend is well-defined, and the pattern clearly indicates a reversal. CME Group's reference on reversal chart patterns notes that confirmation through volume or follow-through movement strengthens any reversal signal.
QM Pattern Trading Strategy Rules
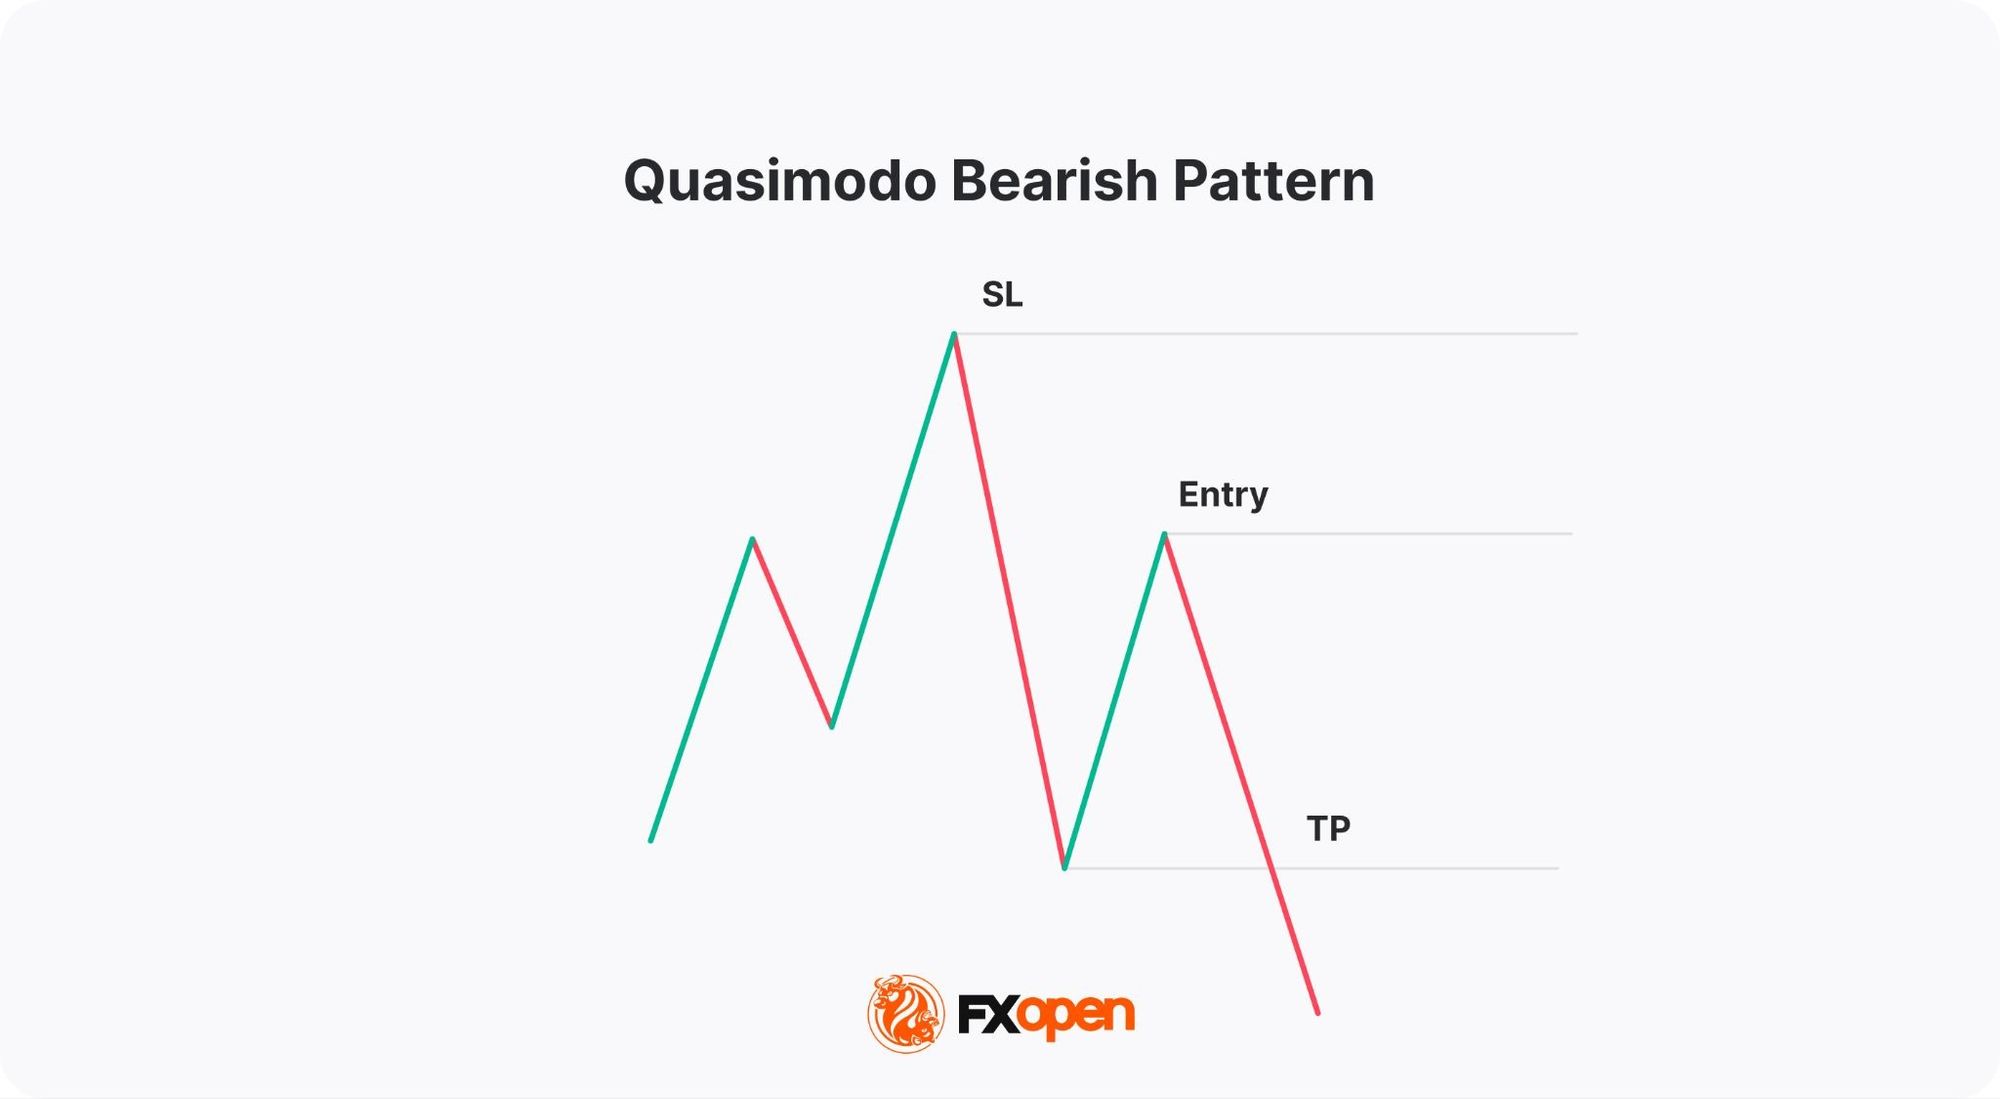
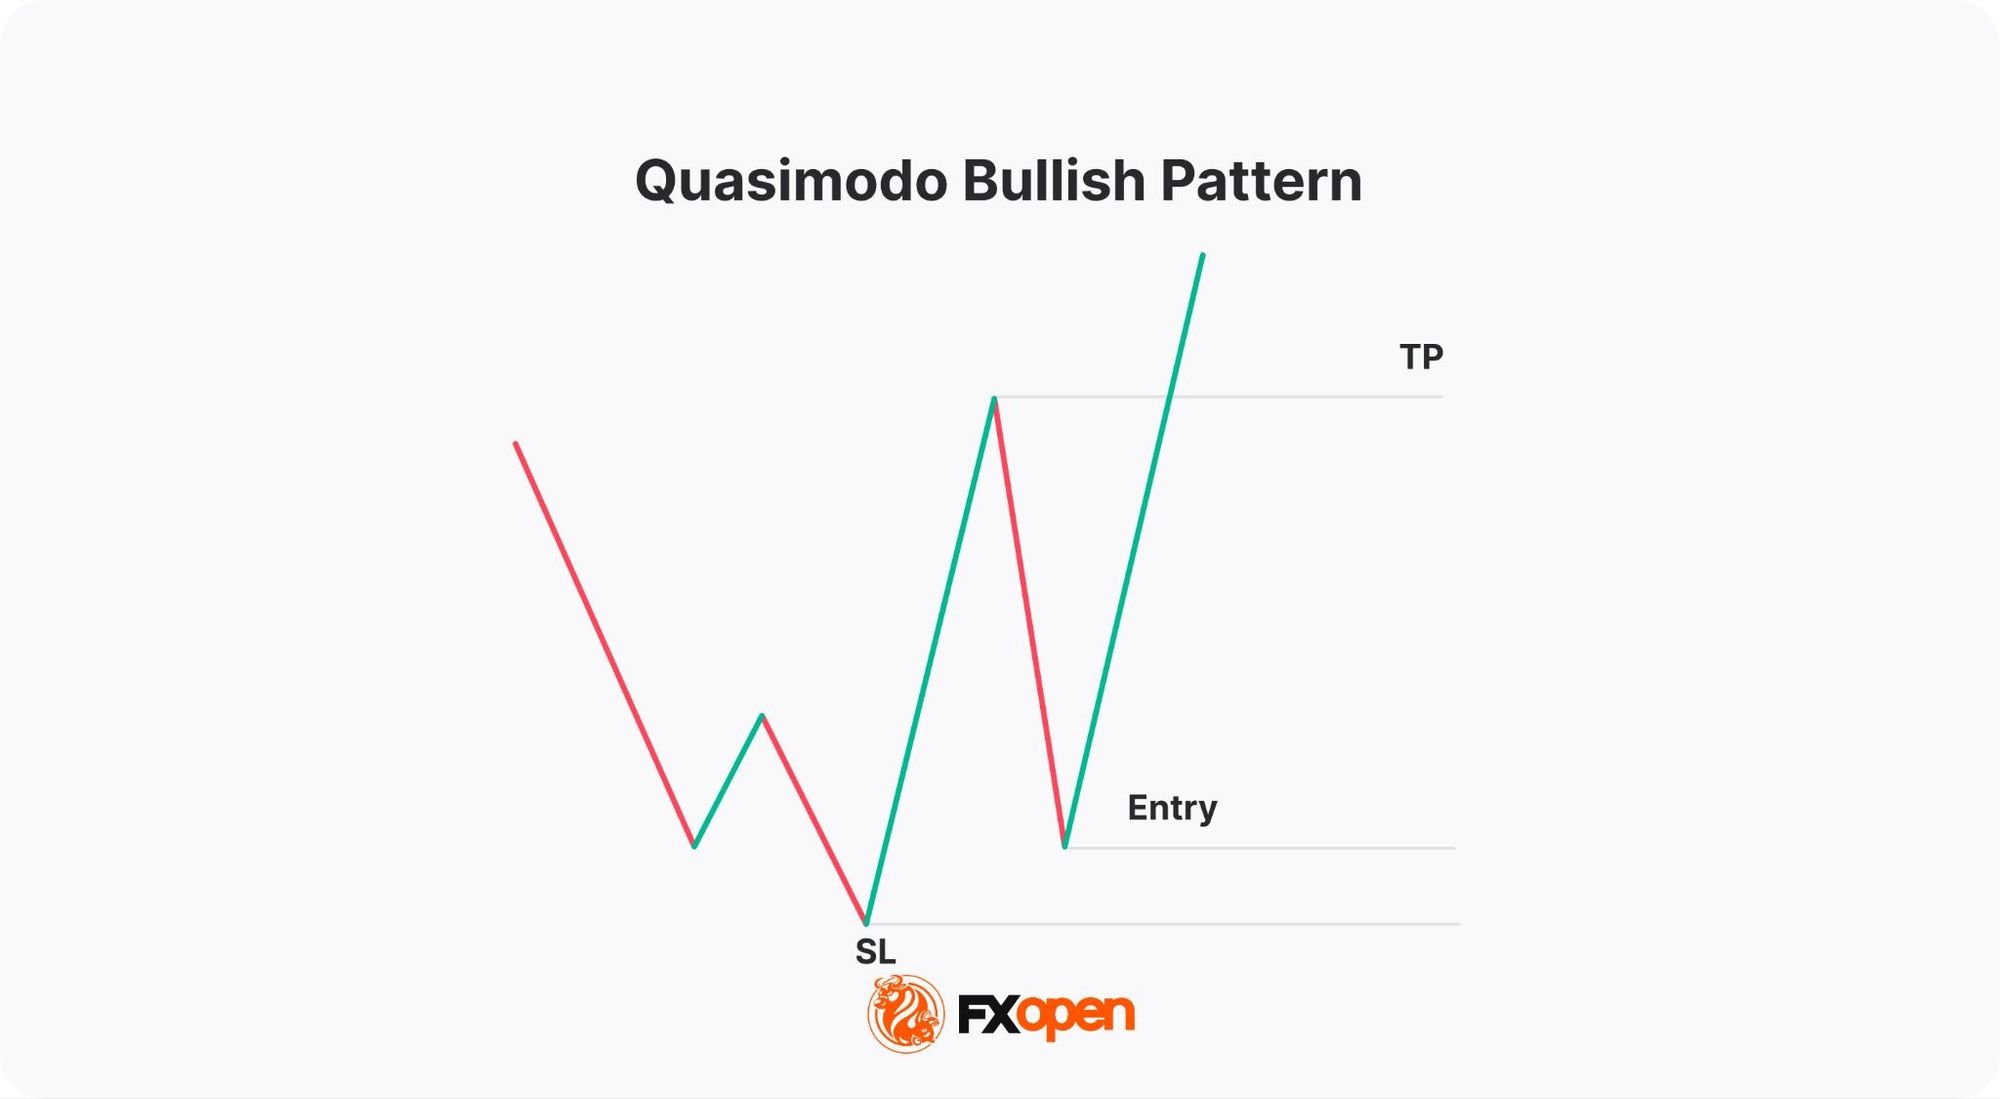
The Quasimodo trading strategy defines four execution components tied to pattern structure:
- Entry: a position is typically opened as the right shoulder forms, after price reverses from the head's extreme.
- Stop-loss: placed just beyond the head, since a move through that level invalidates the structure.
- Take-profit: set at the second trough (bearish) or second peak (bullish), which marks the prior swing the pattern broke.
- Invalidation: price closing beyond the head, or failing to reverse from the right shoulder area, cancels the setup.
Risk-to-reward depends on shoulder placement. A right shoulder formed close to the second trough (or peak) shortens the take-profit distance and may produce a 1:1 ratio or worse. A shoulder formed further away can deliver 1:2 or 1:3. In a QM entry strategy, traders often filter setups by the structural geometry rather than entering every formation.
Entry and Risk Parameters
The table below summarises the QM pattern entry and stop loss logic for both directions:
Variations and Execution Adjustments
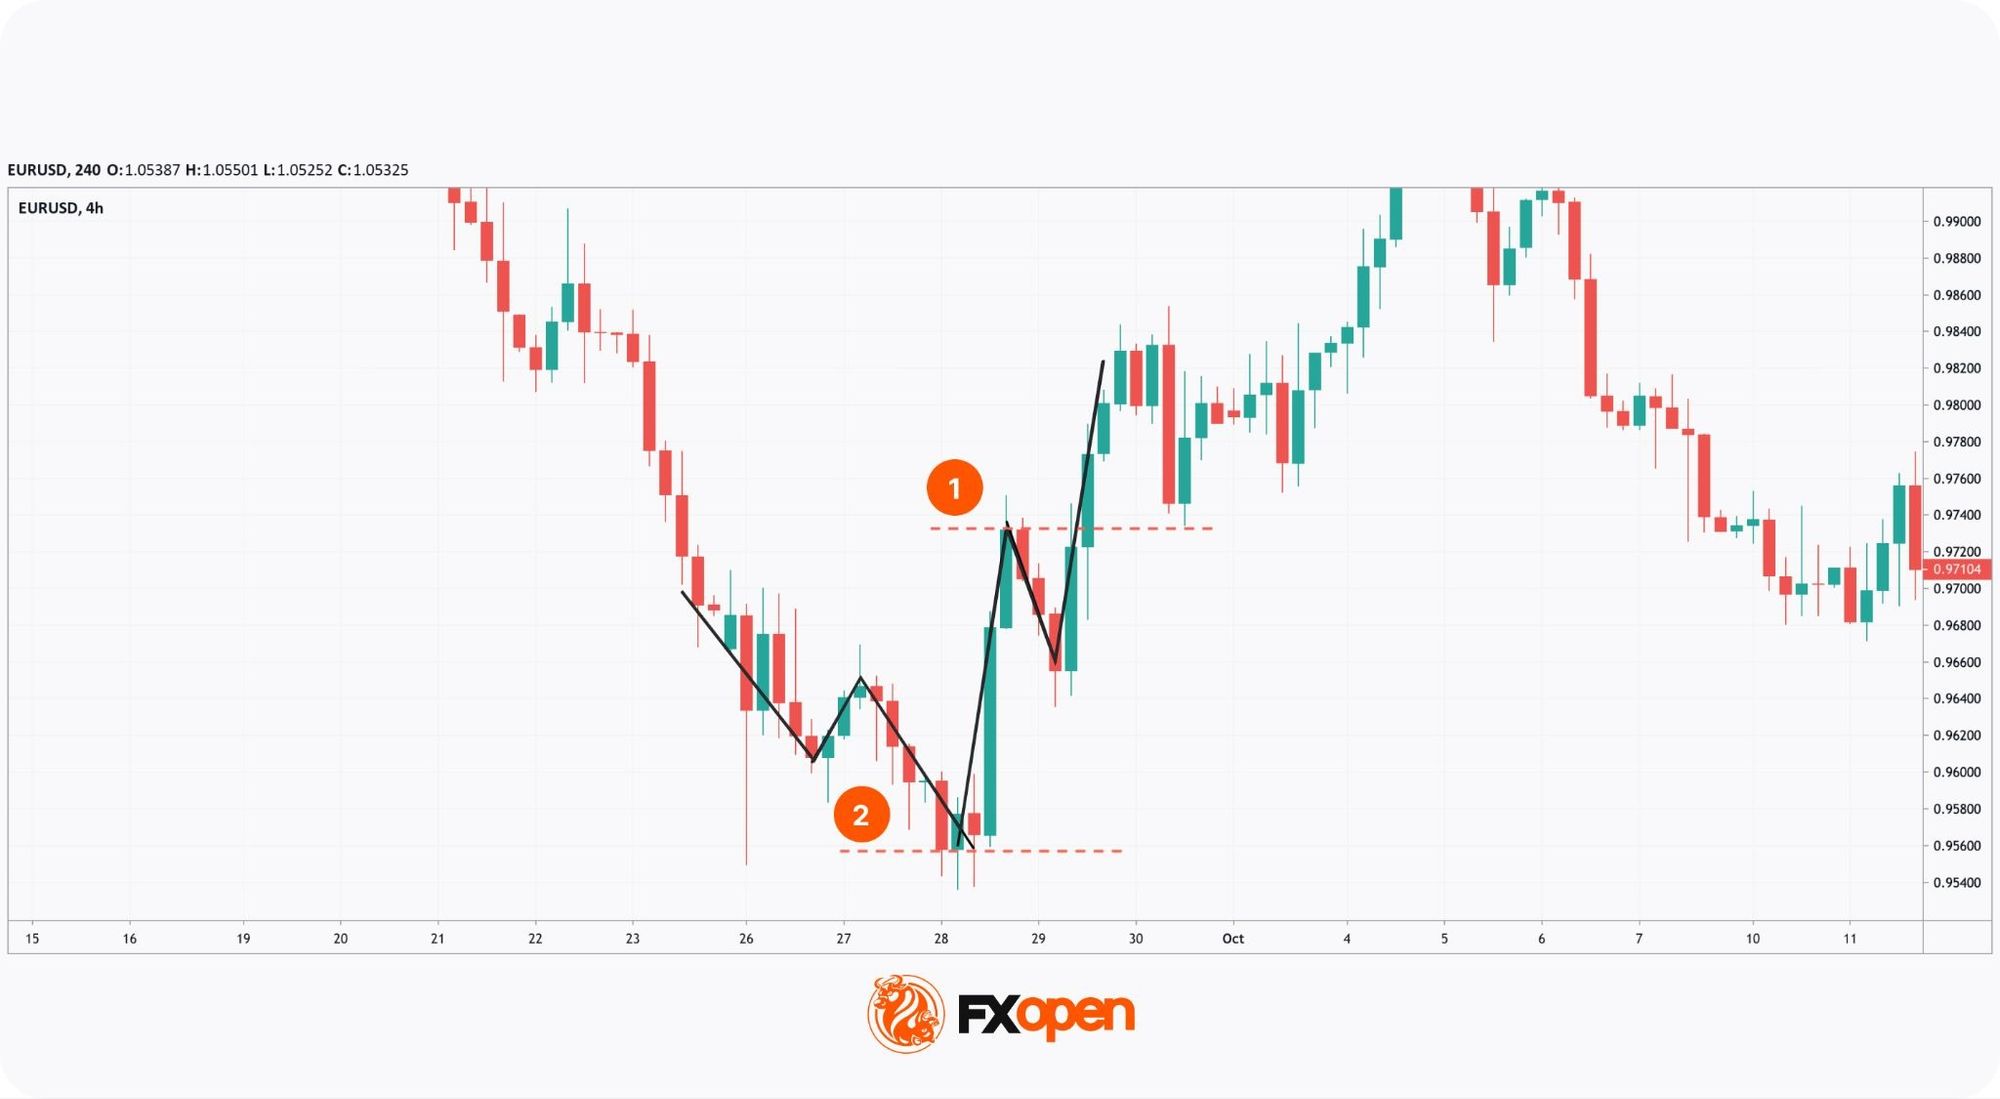
Any theory is always based on perfect conditions, but the actual market often differs. For example, on the chart below, the take-profit target (1) is three times smaller than the stop-loss level (2). In such cases, standard rules don't work.
In this particular case, we would avoid trading as the risk/reward ratio is negative and potential loss is twice potential profit.
Distorted Quasimodo forex structures often appear in three forms:
- Asymmetric shoulders, where the right shoulder sits far closer to the head than the left, leaving little room for a meaningful take-profit.
- A shallow head break, where price only marginally clears the prior swing before reversing, which weakens the liquidity sweep logic.
- A sloped or skewed neckline, where the troughs (or peaks) sit at very different levels, blurring the pattern boundary.
A setup is often avoided when:
- The risk-to-reward ratio falls below 1:1 after measuring entry to head and entry to the second swing.
- The prior trend is weak or choppy, since the pattern relies on a defined trend to reverse.
- Higher-timeframe structure conflicts with the QM pattern trading direction, such as a bearish QM forming inside a strong daily uptrend.
- Confirmation tools fail to align with the reversal signal.
Quasimodo vs Head and Shoulders
The QM and the Head and Shoulders are reversal patterns. They look similar but still differ and provide different entry/exit points. Take a look at the image below.
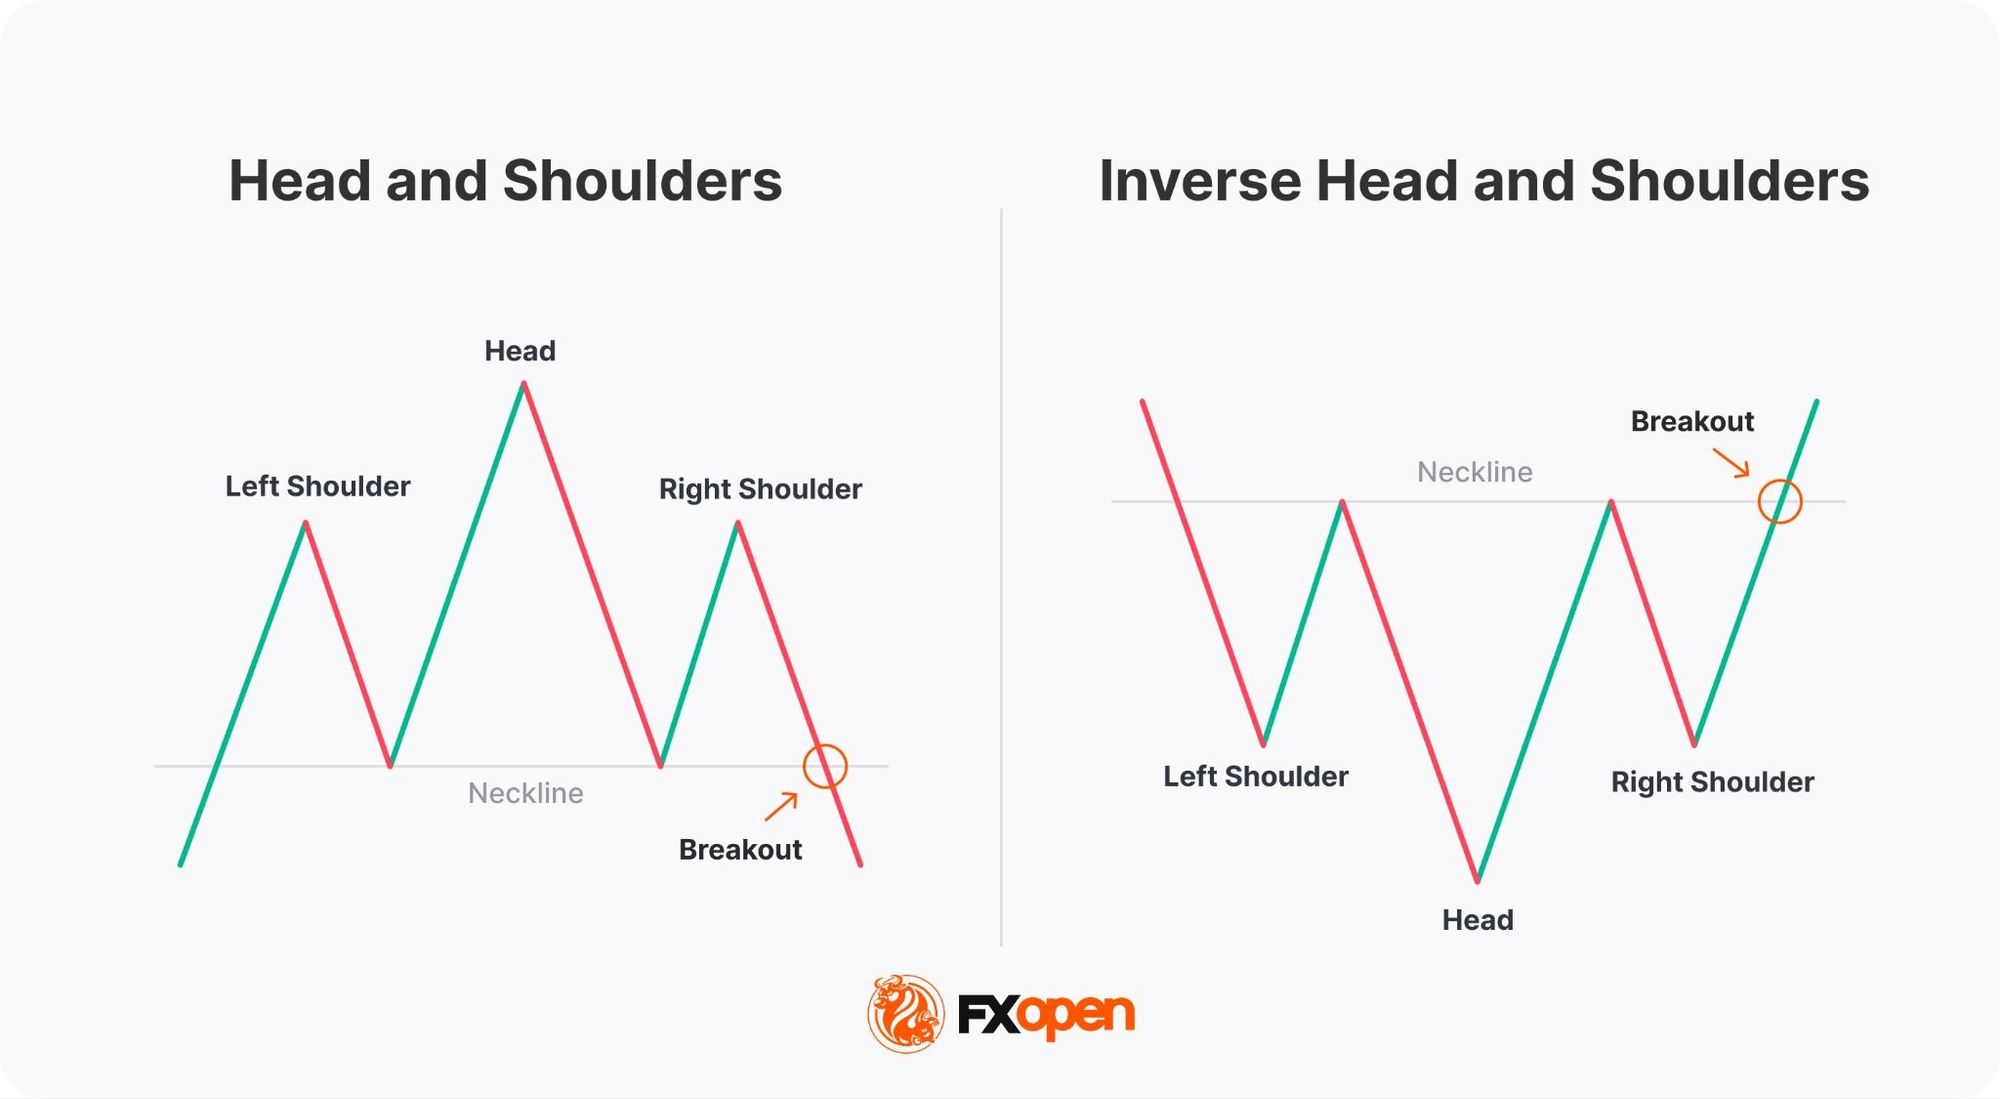
The bearish Head and Shoulders also has three maximums and two minimums, where the second peak (head) is the highest. However, the second trough is at the same level as the first one. This is the difference between the QM and the Head and Shoulders patterns.
The inverse Head and Shoulders consists of three lows and two peaks, where the second trough (head) is the lowest, and the second top is at the same level as the first.
To make it easier, draw a line, a so-called ‘neckline’, through the two troughs in a bearish formation and the two maximums in a bullish one. If the neckline is horizontal, it's the Head and Shoulders. If it's angled, it's the Quasimodo.
The table below highlights the structural and execution differences:
The practical effect of these structural differences:
- When trading the bearish QM pattern, you are supposed to go short on the right shoulder. In the Head and Shoulders, you would wait for the price to break below the neckline after the right shoulder.
- In the inverse QM, you enter the trade at the third trough (right shoulder). But when trading on the inverse head-and-shoulders formation, the common rule is to enter the market not on the second shoulder but after the price breaks above the neckline.
QM Pattern Confirmation Method
Although patterns are reliable technical analysis tools, they must be validated.
Confirmation works in a priority order. Price structure comes first: the head must clearly break the prior swing, and the right shoulder must form below (or above) it. Divergence on RSI or MACD comes second, strengthening the signal where momentum disagrees with price. A moving average crossover near the right shoulder comes third, acting as a trend-bias filter.
Timing matters as much as the signal itself. Confirmation that prints before or at the right shoulder is treated as proactive. A signal that appears only after the right shoulder reverses adds weight but reduces the entry window.
Divergence
RSI and MACD signal a trend reversal in several ways, but the divergence method is the most dependable.
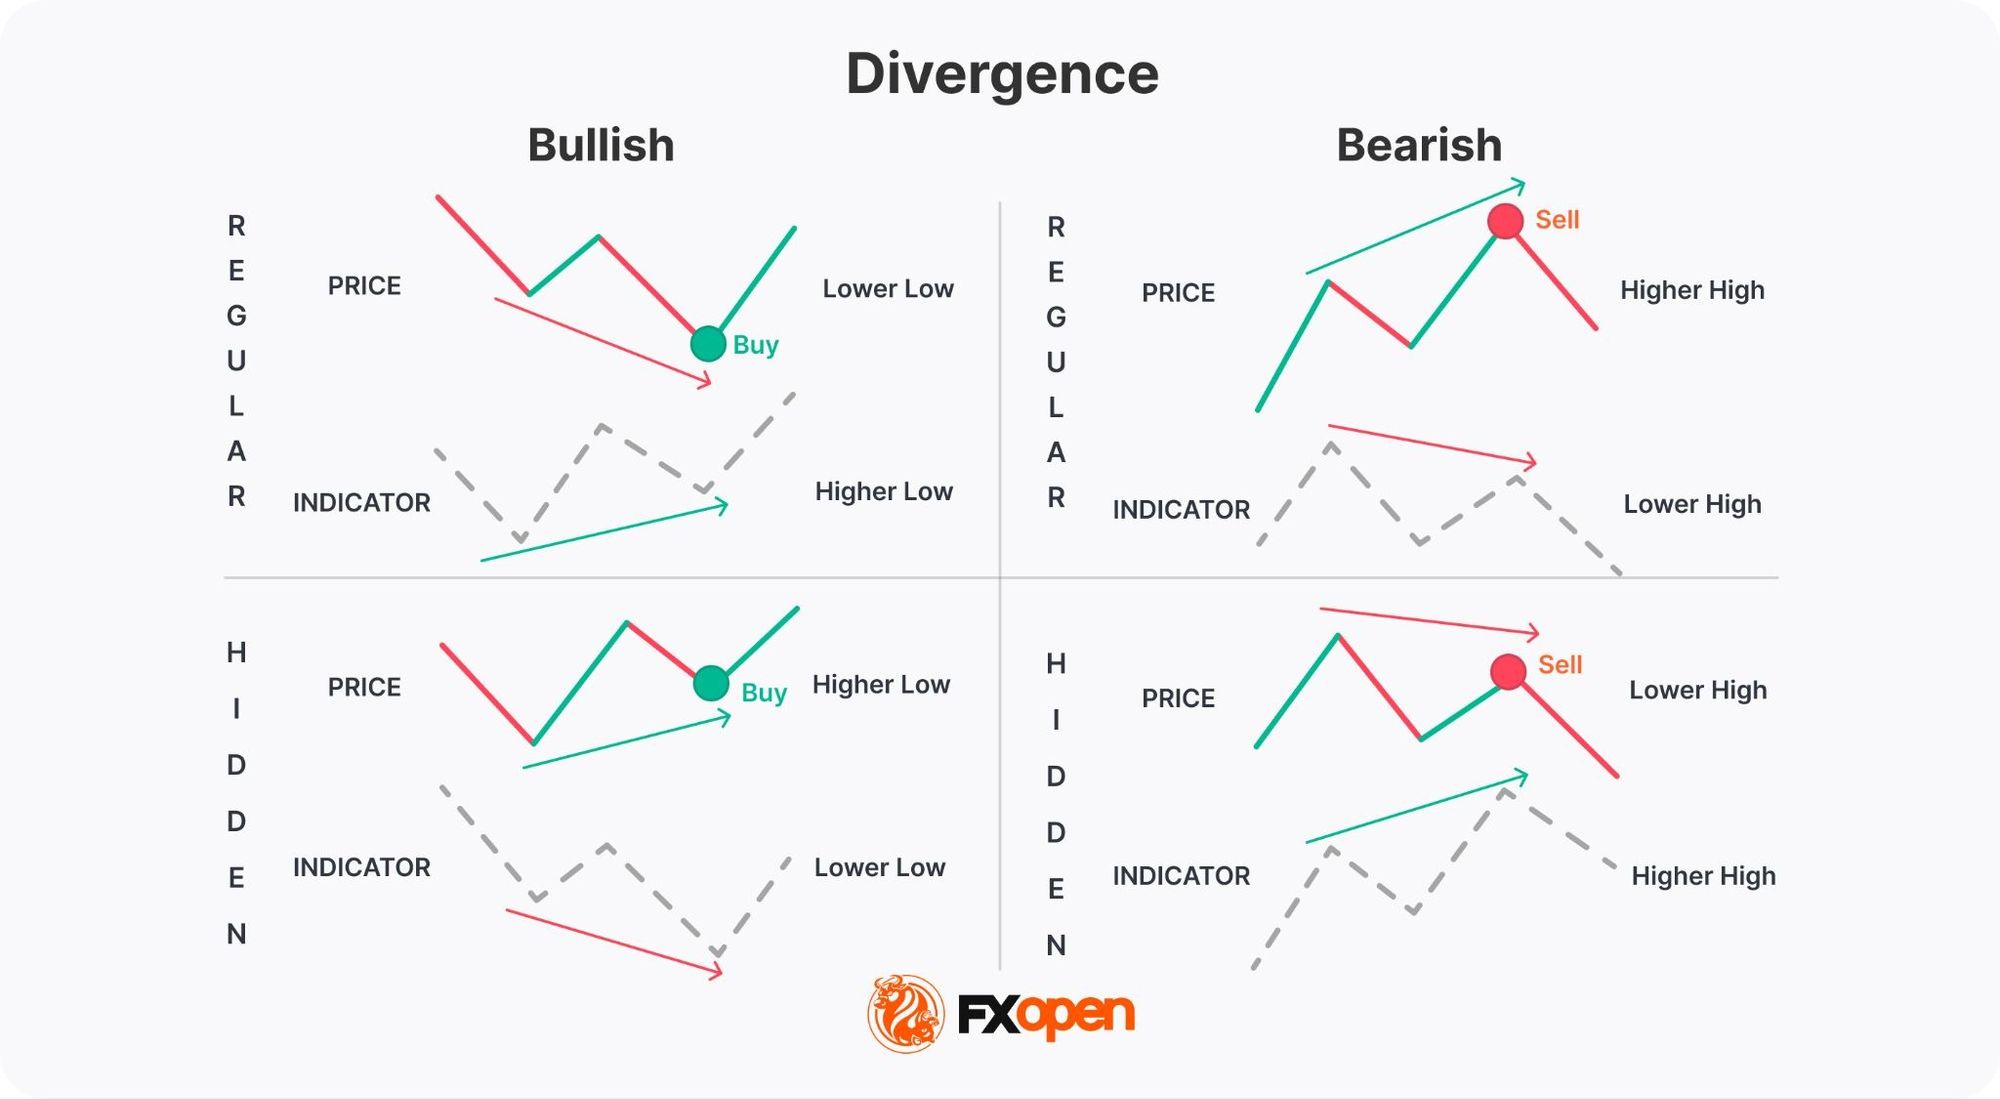
- Regular Bullish Divergence: When the price creates lower lows, but the indicator forms higher lows, it suggests the market might be poised for an upward turn.
- Regular Bearish Divergence: When the price reaches higher highs, but the indicator forms lower highs, it indicates a potential market decline.
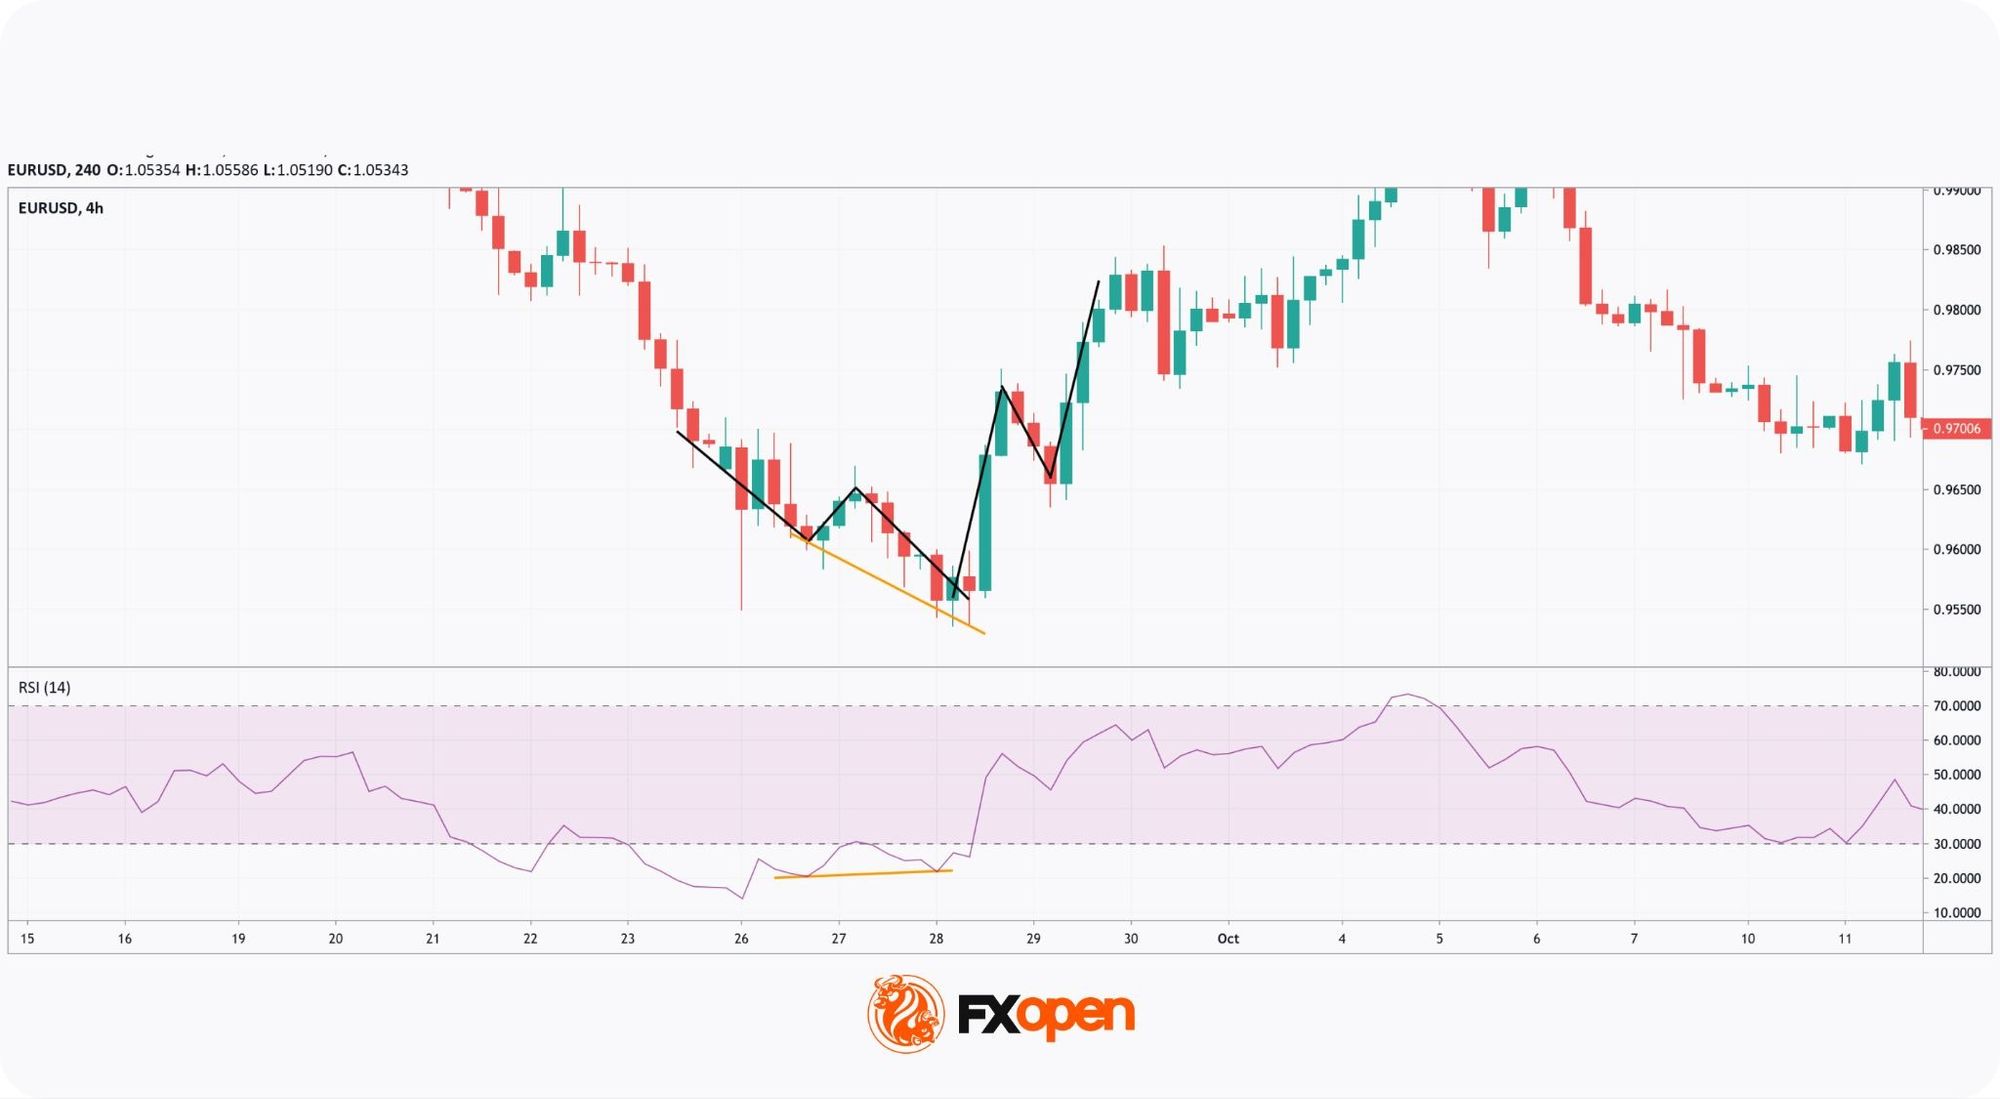
The chart above shows a regular bullish divergence between the price chart and the RSI indicator. As the RSI formed a higher low and left the oversold area, you can anticipate a price reversal. Once the second shoulder of the Quasimodo appears, the market creates conditions for a buy trade.
Divergence strengthens a QM signal when it prints between the head and the right shoulder, on the same timeframe as the pattern. It weakens when:
- The divergence appears on a lower timeframe but is absent on the pattern's own timeframe.
- The indicator extreme is shallow (e.g., RSI barely leaves overbought or oversold).
- Momentum aligns with the prior trend instead of disagreeing with it.
Moving Averages
A simple moving average is widely used to confirm a trend reversal. You will need two MAs with different periods, depending on the timeframe you trade on. 50-, 100-, and 200-period MAs are typically used on high timeframes, while 9-, 12-, and 21-period MAs are more popular on shorter-term periods.
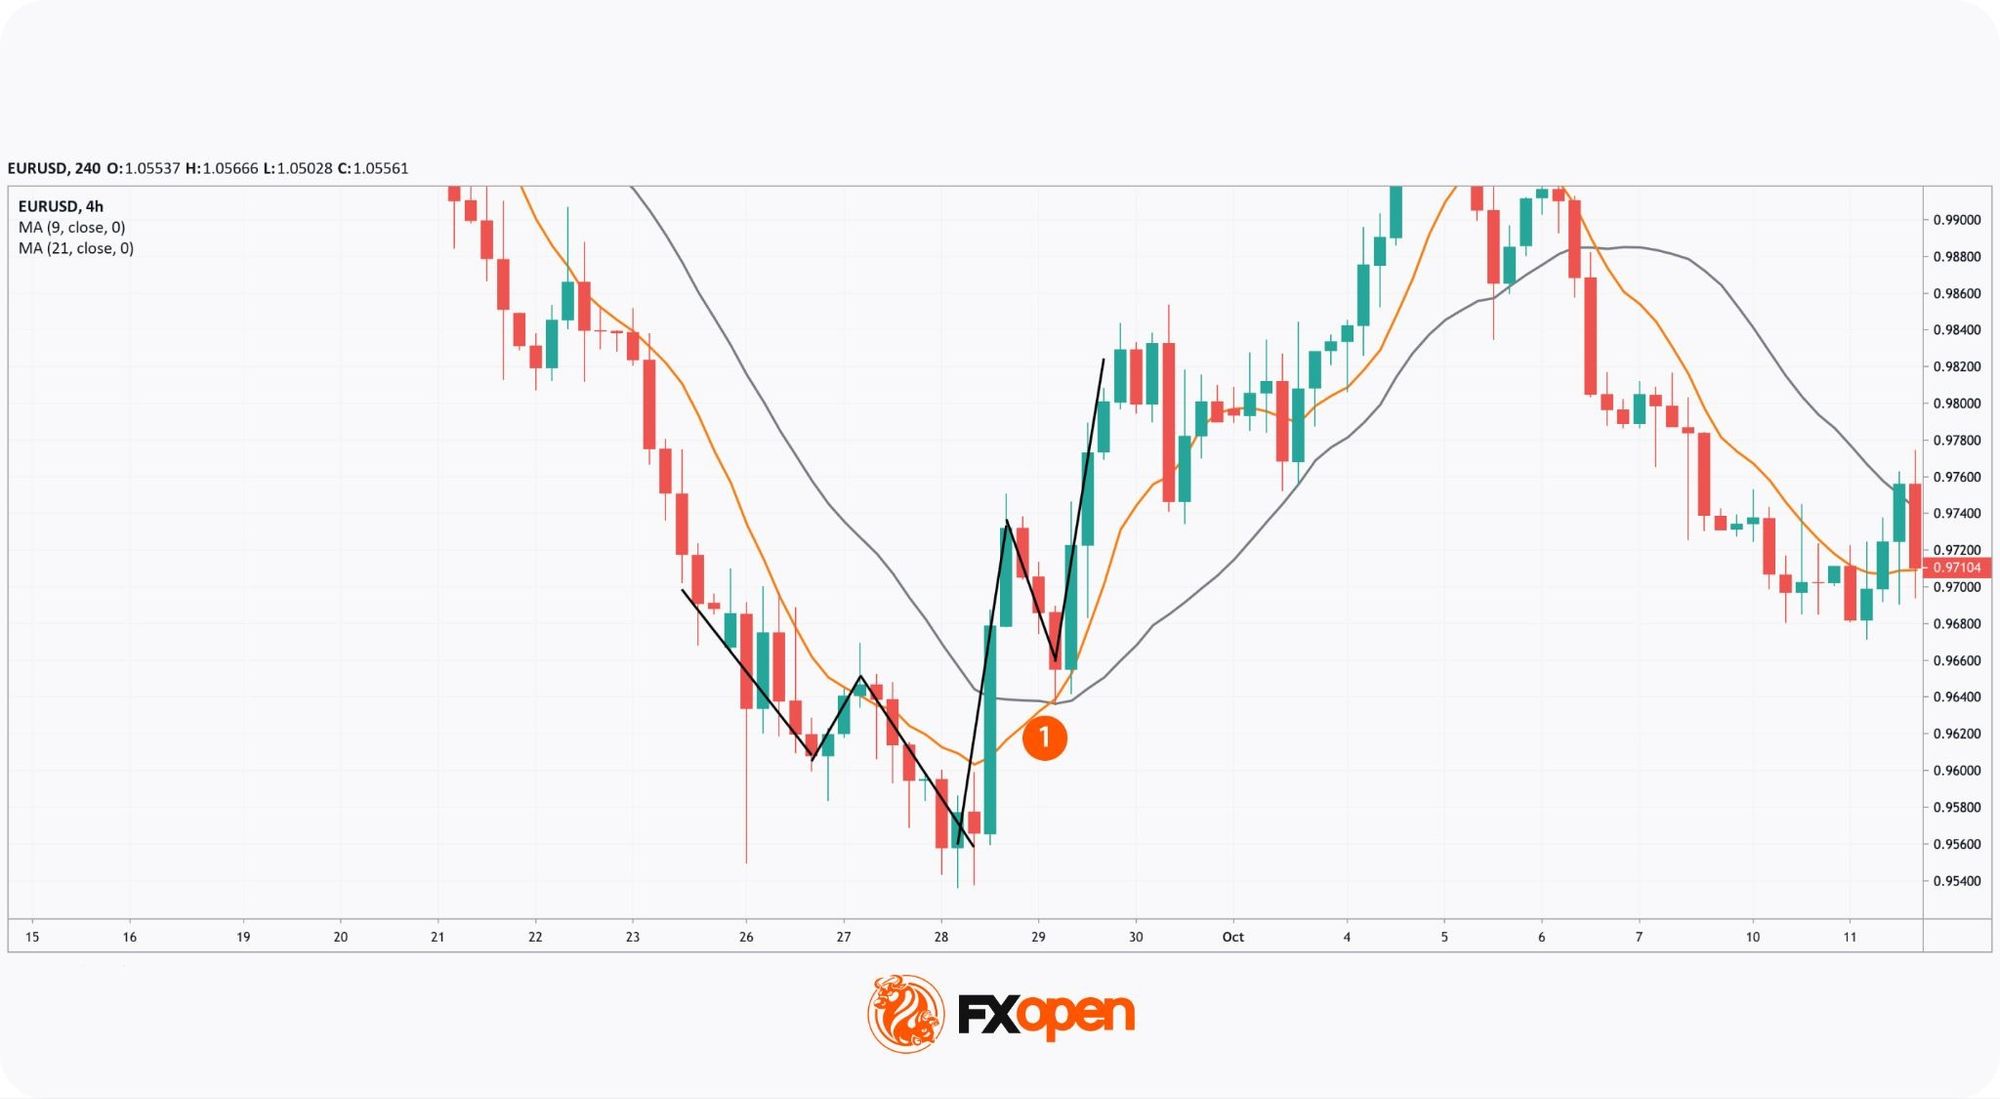
Let’s look at the 4-hour chart of the EUR/USD pair. The price formed an inverse QM. When the second bottom appeared on the chart, a 9-hour MA crossed the 21-hour MA from bottom to top (1). It's a so-called golden cross that signals an upward movement. As the cross occurred before the price formed the third bottom of the QM, you could open a buy trade at the second shoulder with a strong confirmation.
MA periods should align with the trade's timeframe. A QM on the 4-hour chart pairs naturally with a 9 and 21 MA, since those react fast enough to confirm the right shoulder. A daily QM calls for 50 and 200 MAs, which filter noise and reflect institutional trend bias.
Using short MAs on a high-timeframe QM produces too many crossovers and weakens the confirmation. Using long MAs on a short-timeframe QM lags the entry and may miss the reversal entirely.
If you want to practice spotting the QM pattern, you may consider using FXOpen’s TickTrader trading platform.
Execution Conditions for QM Pattern
Before executing a Quasimodo trading strategy, traders typically run through a checklist that combines pattern validity, confirmation, and risk control:
Pattern validity:
- The prior trend is clearly defined, not choppy or sideways.
- The head breaks the prior swing decisively, not by a few pips.
- The right shoulder sits below the head (bearish) or above the head (bullish), not at the same level.
Confirmation:
- At least one confirmation tool aligns with the reversal direction — divergence, MA crossover, or a clean reversal candle at the right shoulder.
- Higher-timeframe structure does not contradict the trade direction.
Risk control:
- Stop loss sits just beyond the head, with the distance accepted before entry.
- Risk-to-reward measures at least 1:1, with 1:2 or better preferred, after accounting for the take-profit at the prior swing.
- Position size respects the wider risk management plan, with potentially no more than 1–2% of account capital exposed per trade.
Additional reminders:
- Don’t confuse bearish and bullish formations. A QM is formed at the end of an uptrend, while an inverse QM appears when the downtrend ends.
- Don’t confuse the Quasimodo trading pattern with the Head and Shoulders.
Common Execution Errors
When trading the QM pattern, traders often fall into common mistakes:
- Ignoring confirmation signals: Failing to use additional indicators, momentum indicators, to confirm the pattern can lead to premature or losing trades. Consequence: traders enter at the right shoulder before momentum confirms the reversal, often catching a continuation move against them.
- Overtrading: Trying to trade every Quasimodo pattern without considering the broader market context or trend strength can result in overtrading and losses. Consequence: capital exposure compounds across multiple weak setups, eroding the account even when individual trades look reasonable in isolation.
- Neglecting market conditions: Not accounting for low volatility or trading during choppy market conditions can reduce the pattern's reliability. Consequence: the QM relies on directional follow-through. In a range, price often returns to the head and triggers the stop-loss before reaching the take-profit.
- Misjudging pattern completeness: Entering trades before the second swing fully forms may result in false signals and unexpected reversals. Consequence: the right shoulder may extend past the head, invalidating the structure mid-trade and forcing an exit at the stop-loss.
- Improper position sizing: Failing to adjust position sizes based on market conditions or pattern strength can lead to excessive risk. Consequence: a single failed QM can wipe out the gains from several successful setups when sizing ignores the stop-loss distance.
Summary
The QM pattern is a reversal structure built on a failed continuation followed by a break of prior swing. Its execution rules tie entries to the right shoulder, stops to the head, and targets to the broken swing.
Confirmation through price structure, divergence, and moving average alignment strengthens the signal but does not replace it. A Quasimodo trading strategy is considered to work when the prior trend is well-defined and risk-to-reward measures at least 1:1.
Traders interested in applying these execution rules can open a trading account at FXOpen to test the QM pattern across forex and CFDs on stocks, indices, and commodities.
FAQ
What Does Quasimodo Mean in Trading?
In trading, the Quasimodo definition refers to a reversal pattern that signals a potential change in the trend direction. It indicates a shift from an uptrend to a downtrend (bearish Quasimodo) or a downtrend to an uptrend (bullish Quasimodo). Traders use it to identify entry and exit points.
What Is the Quasimodo Structure?
The Quasimodo consists of three peaks and two troughs in the bearish pattern and three troughs and two peaks in the bullish pattern. The middle peak or trough (head) is the most prominent, flanked by two smaller shoulders.
How May Traders Use the Quasimodo Pattern?
Traders use the Quasimodo pattern to enter trades at potential reversal points. Typically, they look to sell near the right shoulder in a bearish QM or buy near the right shoulder in a bullish QM. The invalidation level is usually set just beyond the head, while profit targets are placed at the closest swing.
What Is the Quasimodo Pattern in Crypto*?
The QM meaning in crypto* is the same as in other markets. The Quasimodo signals potential trend reversals in digital assets. The reliability of its signals often depends on market conditions and is typically confirmed with indicators like oscillators or those that reflect trends.
What Confirms a Valid Quasimodo Pattern?
Confirmation works in three layers. First, the price structure itself: the head must break the prior swing decisively, and the right shoulder must form below (or above) it. Second, momentum indicators like RSI or MACD showing divergence against price. Third, a moving average crossover that aligns with the reversal direction. A pattern with all three layers carries more weight than one supported by structure alone.
Does the Quasimodo Pattern Work on All Timeframes?
The QM pattern can form on any timeframe, but reliability tends to vary. Higher timeframes (4-hour, daily, weekly) produce fewer setups but with clearer structure and stronger follow-through. Lower timeframes (15-minute, 1-hour) produce more setups but carry more noise, more false breaks at the head, and more shallow shoulders that fail to develop. Most traders apply the pattern on medium-term timeframes.
*Important: At FXOpen UK, Cryptocurrency trading via CFDs is only available to our Professional clients. They are not available for trading by Retail clients. To find out more information about how this may affect you, please get in touch with our team.
This article represents the opinion of the Companies operating under the FXOpen brand only. It is not to be construed as an offer, solicitation, or recommendation with respect to products and services provided by the Companies operating under the FXOpen brand, nor is it to be considered financial advice.
Stay ahead of the market!
Subscribe now to our mailing list and receive the latest market news and insights delivered directly to your inbox.


Latest articles

Intel at a Crossroads: Earnings Beat Meets Technical Resistance
Intel has just delivered its strongest quarter in over fifteen years, and the market reaction says it all. Q2 2026 revenue surged 25% year-over-year to $16.1 billion, crushing the consensus estimate of $14.42 billion, while adjusted EPS of

Tesla: Complex Range Structure Breaks Down Following Quarterly Earnings
Tesla released its Q2 2026 results after the market closed on 22 July. Revenue increased 26% year-on-year to $28.24 billion, while vehicle deliveries reached a record 480,126 units. However, operating margin fell sharply to 1.4%, down from

Pound Weakens After Soft UK Inflation Data as Euro Awaits Fresh Market Signals
The pound remains under pressure following the release of weaker-than-expected UK inflation data. The slowdown in inflation has strengthened expectations that the Bank of England could adopt a more accommodative policy stance in the coming months, weighing on sterling. Meanwhile,