


FXOpen
By Marcin Nowogórski for Forex Articel Contest
In the following article I’d like to present you one of my favorite theories about trading on the markets. Although the facts I’m going to describe here are very basic to every trader – or at least they should be – it took me long to properly understand and apply them in my strategy. So let’s consider the candles closer.
The first funny fact about candles is something that most traders notice at some point but don’t know what to do with it, and I mean wicks. Almost every candle, especially on higher timeframes, has open, close, high and low zones on different levels – such candle has both wicks. How could it be and what does it mean for the universe?
The second funny fact is that the whole universe is built as a wave, and so is the price movement. It happens so due to the mutual influence of two factors with dynamically changing intensity – supply and demand. Fluctuations of these two forces are the reason for price going up and down all the time. So the most probable thing is that during the given time period price will go down and up and then down again – as a result we will see an upward candle with two wicks.
Most people learn Supply/Demand strategies from forums, sites or webinars where they often get a misleading impression, that Supply is simply an area determined by a pack of candles above the price, while Demand is determined by a pack of candles below the price. Actually, another funny fact is that Supply and Demand are all over the chart (market) and they move dynamically. There is nothing extraordinary about it. Just take a look at your Stop Loss order. It’s nothing more than a Buy (demand) above the price or a Sell (supply) below the price. The same relation occurs with pending stop orders which in fact are used as SL. Moreover, if price goes one tick to the upside, it means that there were some supply and demand and they clashed leaving bids and offers on the market waiting for filling with any counterparty. Yes! That’s right. Spread – assuming it’s a market spread – is actually a supply and demand manifestation.
Almost every candle has its wicks and each candle has a designated timeframe. What does a time period mean for the price? Time is a very important factor on the market. Many traders are focused on price levels so deeply that they almost forget that time is equally important. It would be hard to navigate on the markets without time periods. Many sources state that the Forex market is open 24/7 or 24/5 but that’s not the whole truth. This fact often makes newbie traders think that they can trade and profit each and every moment. Actually the Forex market functioning is divided into the specific time zones and market sessions. There are moments of low liquidity and volatility and there are also moments of great moves backed with high volume. So, the intensity of trading and the supply/demand dynamics are also fluctuating. Most traders are not trading Forex directly, and in their case trading currencies is rather a necessary evil that accompanies buying or selling foreign assets. Therefore they must stick strictly to market hours. For example, a manager from New York who wants to buy German Stocks, will have his transactions executed during the great overlap between 15:00 – 17:00 GMT.
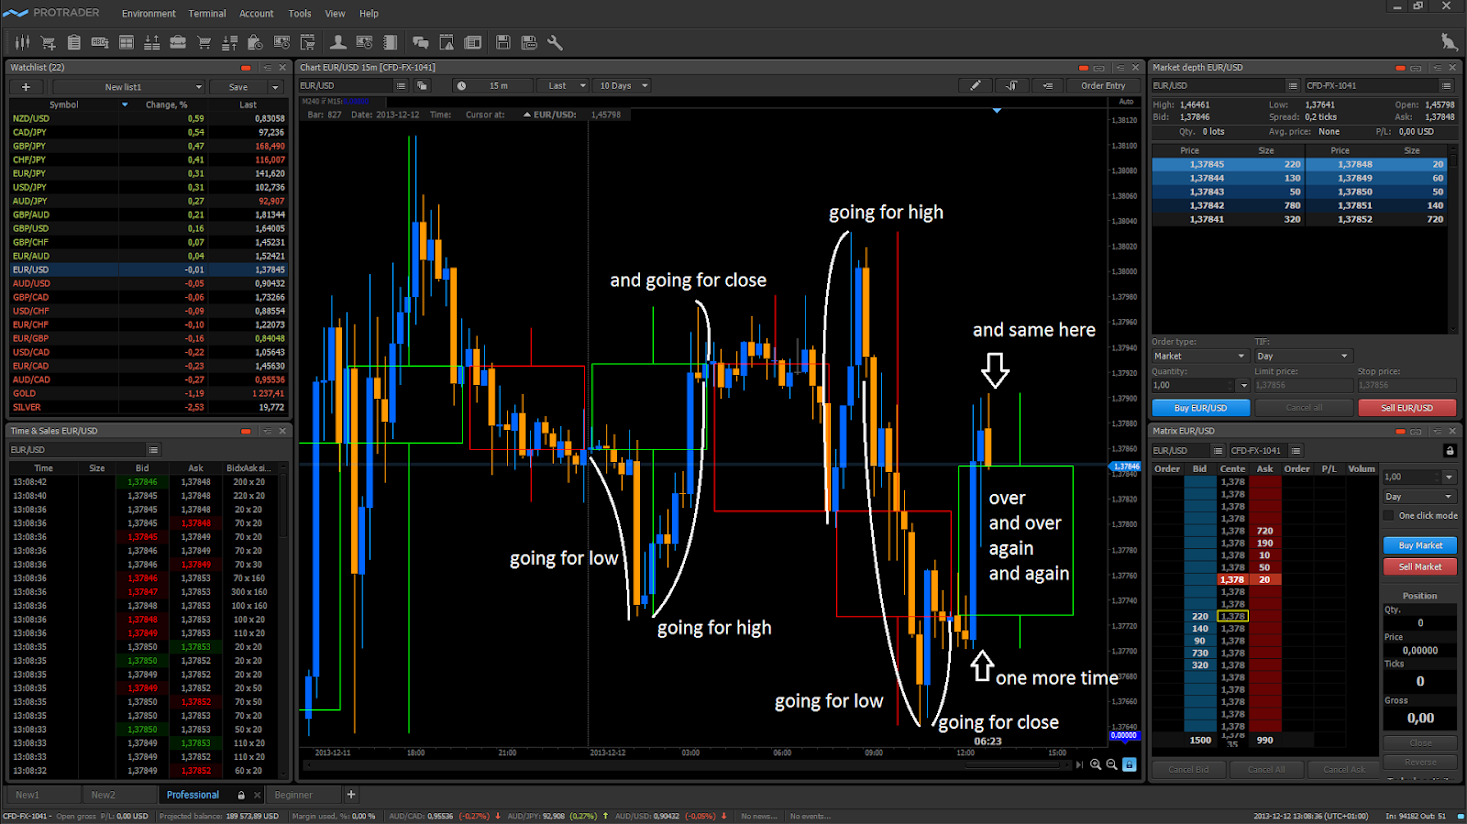
For reasons stated above many traders have to operate in the session manner. They begin their workday when their stock market opens and finish when the last fixing goes off. Therefore many day traders and session traders cannot bare the risk of leaving their often leveraged exposition till the next open because they are afraid of gaps and sentiment changes while they are exposed. So, they lower or liquidate their exposure to the market – take profit or cut loss – adding this way some strength to the headwind forces. For example: if temporary good sentiments brought certain asset higher during the session – thanks to a wave of buyers – there will appear some selling pressure at the end of the session when day traders most probably try to cash their profits and get out of their trades.
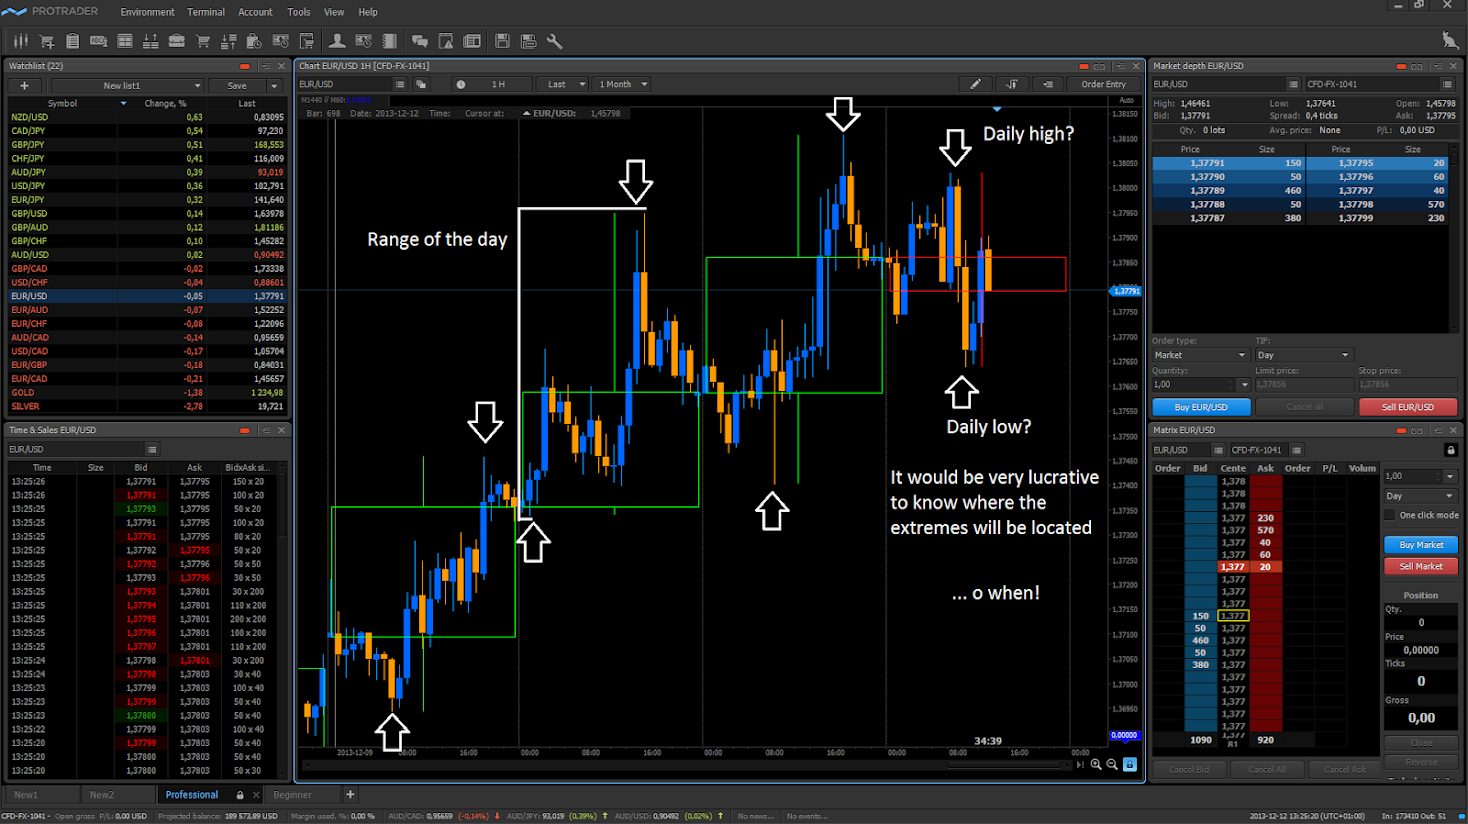
Every session or day has its range. Sometimes it’s close to average but often it varies from the average. The range depends highly on the market sentiment but also on traders’ will to take their profits. As you see that range is quite extended now and sentiment seems to fade. You may try to join the other side on a certain level. Note that you might need some additional confirmation and you should not try to reverse a clear trend.
So, how to apply this knowledge to our way of interpreting the markets? As it’s all about the right side, here you have some good clues for your speculation. Leave the archeology. Don’t try to draw too many colors on your history. Ask yourself what the universal laws that rule the price are and how they will determine the next candle on your chart. Believe me, you don’t need anything else. And here you have one of such laws. If you see a momentum and want to acquire a better price to offset the spread, keep in mind that the next candle will probably have a counter wick. If you like a contrarian style or fading trades then you should try to pick the right time for that – when the session is over or the market is shallow. You can use the above rule for lower timeframes as well as for higher ones. Wouldn’t be great just to catch the Low of the day with your long position? And, in fact, almost every upside session, day, week or month has its own Low.
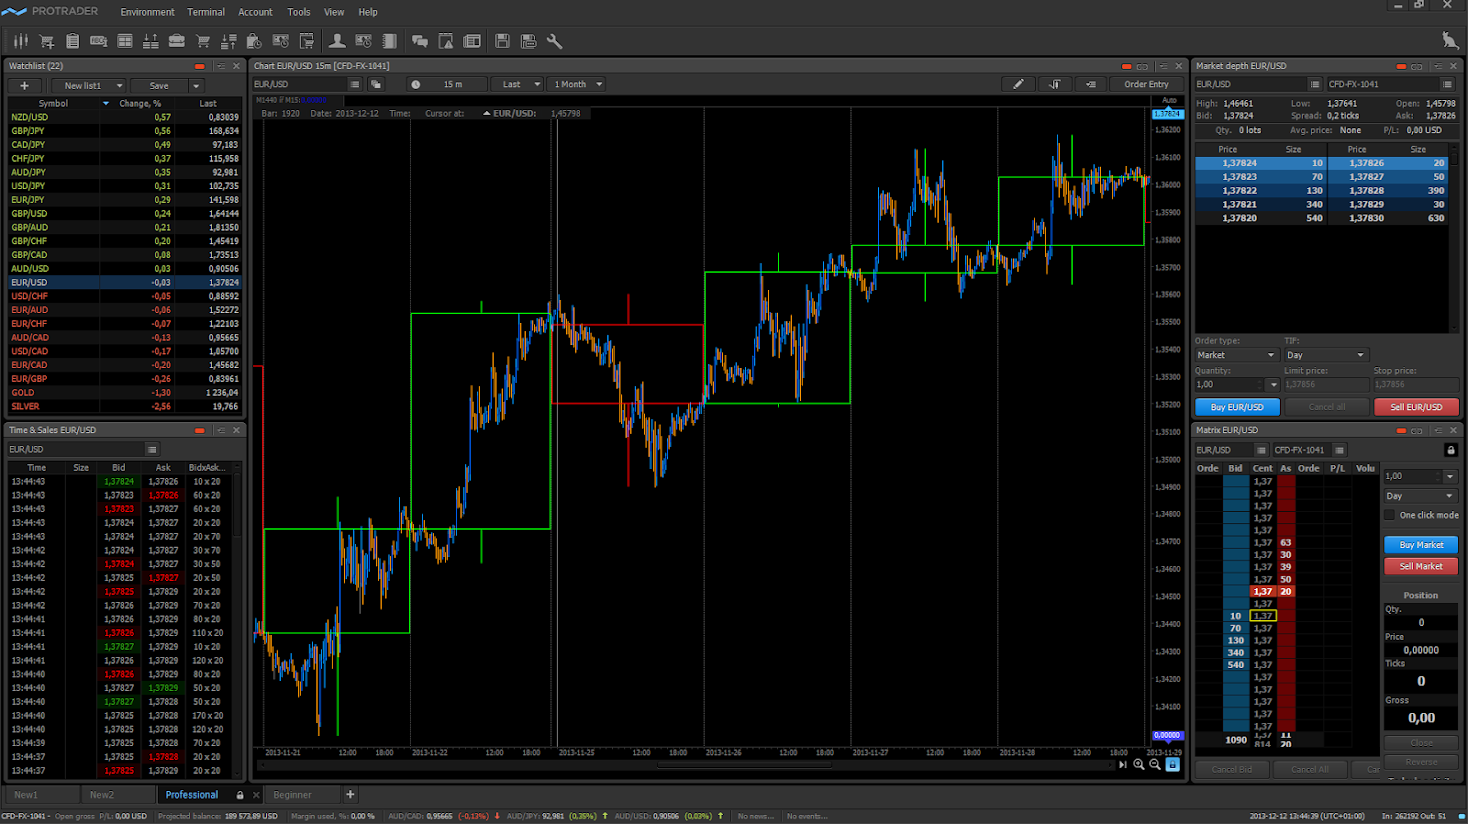
P.S.: The indicator used for candles is Custom Candle MT4 Indicator.
The article is written by Marcin Nowogórski and is participating in the Forex Article Contest. Good luck!
This article represents the opinion of the Companies operating under the FXOpen brand only. It is not to be construed as an offer, solicitation, or recommendation with respect to products and services provided by the Companies operating under the FXOpen brand, nor is it to be considered financial advice.
Stay ahead of the market!
Subscribe now to our mailing list and receive the latest market news and insights delivered directly to your inbox.

Latest articles

Weekly Market Wrap With Gary Thomson: Nasdaq, EUR/USD, USD/CHF, Brent Crude Oil, Googl Shares
Get the latest scoop on the week's hottest headlines, all in one convenient video. Join Gary Thomson, the COO of FXOpen UK, as he breaks down the most significant news reports and shares his expert insights.
- Nasdaq Composite: Worst Session

Analysis of AUD/USD: Exchange Rate Falls to Early May Low
As indicated by the 4-hour AUD/USD chart today:
→ the rate fell below 0.652, a level last seen on May 2;
→ the RSI indicator dropped below 15, a level last seen during the panic over the spread of COVID-19

Analysis of AMZN Stock: Price at 1.5-Month Low
As shown in the AMZN chart, the stock price dropped below:
→ the psychological level of $180;
→ the mid-June interim low.
The last time AMZN traded below $180 was in early June.
Thus, AMZN has faced sell-offs, similar to other tech