


A Tutorial on How to Use Keltner Channels
FXOpen
Looking for a way to determine market trends and momentum? Keltner Channels may be the tool you’re looking for. This volatility-based indicator can help you get a clearer picture of the market and identify potential trading opportunities. In this article, we’ll take a closer look at Keltner Channels, how they work, and how you can use Keltner Channels in trading.
What Is the Keltner Channel Indicator?
The Keltner Channel is a popular indicator used to help determine trends, momentum, and potential reversal points in the market. Keltner Channels were invented by Chester Keltner in the 1960s, with a modified version being released in the 1980s.
Keltner Channels consist of three lines plotted on a chart. The middle line is an exponential moving average (EMA). While the original Keltner Channel used a high-low range to plot the upper and lower lines, the updated version commonly found today uses Average True Range (ATR).
The Keltner Channels expand and tighten based on volatility in the market. Given that most price action occurs within the bands, moves outside the channel are significant. They can indicate a strong trend forming, a breakout, or a potential reversal incoming, determined by price action and other technical indicators.
Keltner Channels Settings
Keltner Channels work across all timeframes, so feel free to use them in whichever period you feel most comfortable with.
There are two components to the Keltner Channel: the EMA and ATR multiplier. The EMA is often set to 20 periods, providing a good balance between responsiveness and stability.
The upper and lower bands are determined by a multiplier of the ATR. Two times the ATR is typical for many traders, but you can increase the number of signals by reducing the multiplier to 1 or 1.5. Be cautious that this may also increase the number of false signals you receive. To get the lower band, you need to multiply the ATR by a multiplier and subtract that number from the EMA. To get the upper band’s value, you need to multiply the ATR by a multiplier and add that number to the EMA.
How to Use Keltner Channels
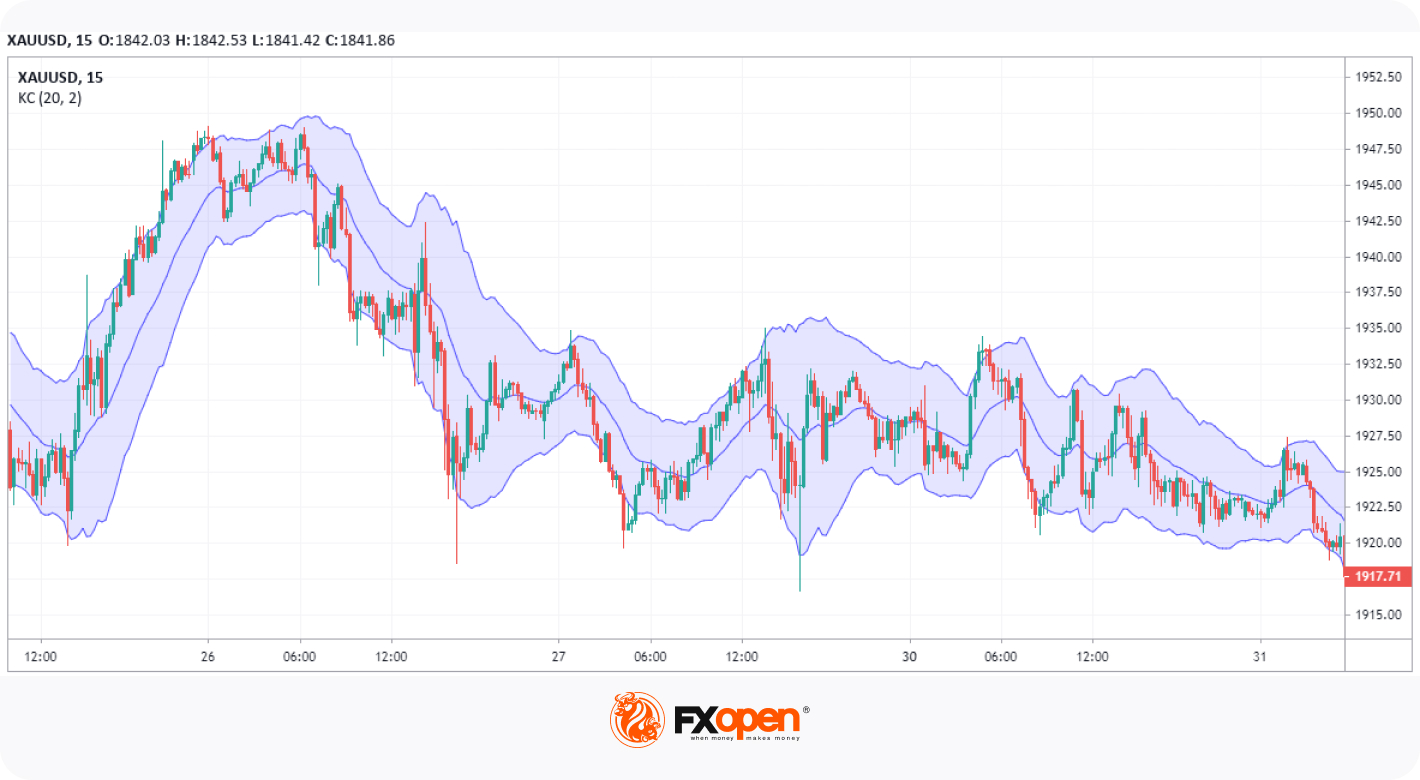
Like other volatility-based indicators, like Bollinger Bands, there are multiple ways to interpret Keltner Channels. At its most basic, an upward-sloping channel indicates a bull trend, while a downward-sloping channel shows a bear trend. A flat channel means that the price is in a range.
Most of the time, the price will bounce between the channels, using them as dynamic support/resistance levels. When a trend is strong, it tends to stick to the upper or lower bound, continually hitting the lines. A pullback to the EMA is where traders often jump on the trend.
Additionally, Keltner Channels can be used to identify breakouts. This is most effective when following a range, as a break above the channel can indicate bullish momentum coming into the market and vice versa.
Lastly, Keltner Channels can also signal oversold or overbought areas. A move outside of a bound that then closes back inside of the channel, usually within one or two candles, can indicate that a reversal is inbound.
However, predicting reversals using Keltner Channels alone can be tricky, as the price will often retrace slightly before continuing to trend. It’s best to use Keltner Channels for trading trends and breakouts until you become more proficient with the indicator.
Keltner Channel Trading Strategy
Now that we have an idea of what Keltner Channels are, how to interpret them, and how to set them up, let’s look at some Keltner Channel trading systems. We’ll cover the two most effective applications: trend following and breakout trading.
We’ve used the free TickTrader platform, offered by us at FXOpen, to demonstrate the strategies. To better understand how they work, you can try the TickTrader platform and use the Keltner Channel indicator for yourself.
Trend Following

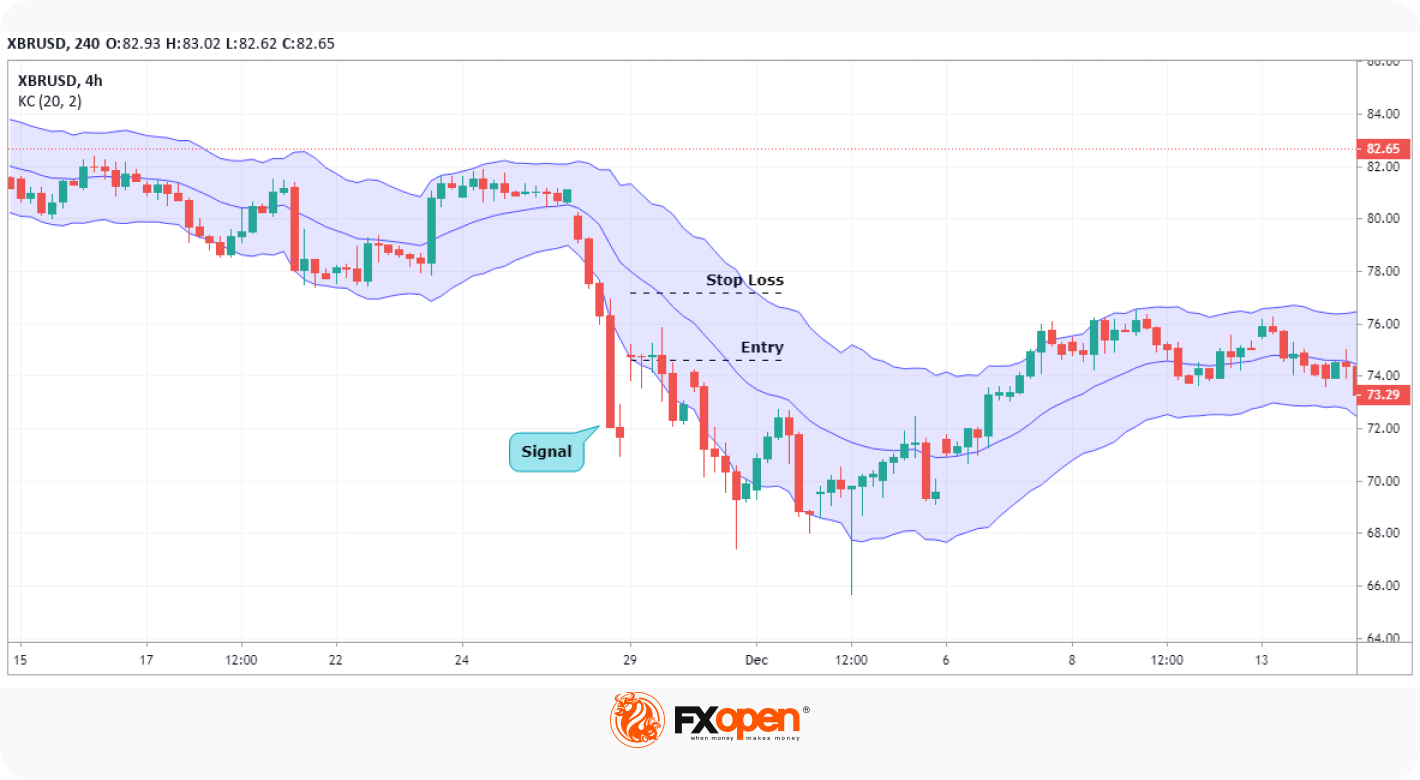
Entry: You can wait for two consecutive closes outside of the band (indicating momentum) with a sloping channel, then enter on the retest of the EMA. For example, two candles close above the upper bound with an upward-sloping channel.
Stop Loss: Just beyond the opposing bound. As the trend progresses, you could also trail the stop above or below swing points or the opposite line.
Take Profit: Profit-taking is flexible here. You could begin to take profits the next time the price closes outside of the band and then moves back inside, or use a Fibonacci extension to project potential reversal levels. Alternatively, you might set a specific risk/reward ratio, like 1:3, and exit once you’re happy with your returns.
In this example, we see the price bullishly moving outside the upper band with no signs of trend exhaustion. There’s also extra confluence from a larger overall bullish trend on the left-hand side, just off-screen. We then see the channels begin to slope downwards as bearish pressure enters the market with a large engulfing candle (entry 3). The EMA acted as an ideal place to enter in all three scenarios.
Breakout Trading
Example 1:
Example 2:
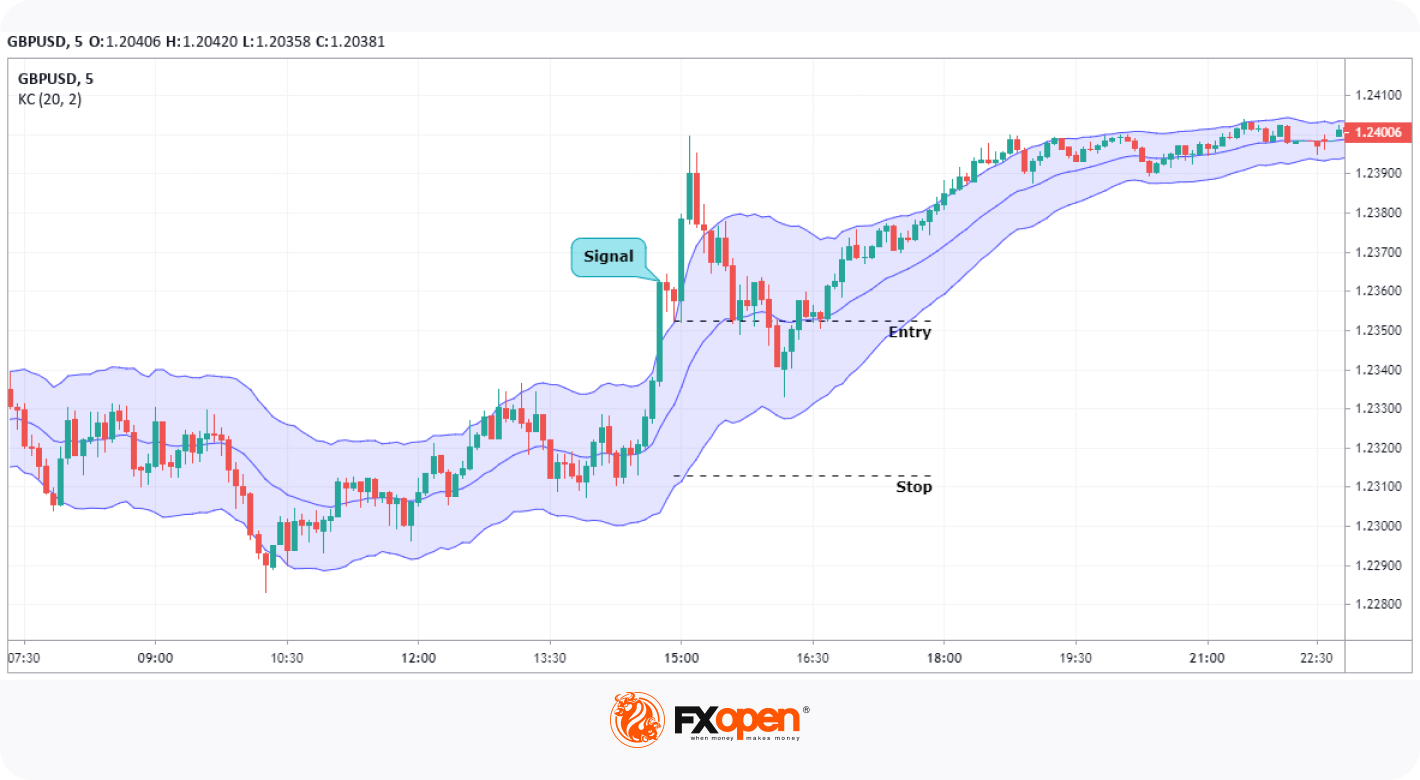
Entry: The first thing to look for is an extremely bullish or bearish candle that closes well beyond the channel. Often, it’ll stand out from recent price action and will have little to no wicks. You could also look for an additional close outside of the channel to qualify the signal if desired. Traders enter on the retest of the bound the price broke out from.
Stop Loss: Since the idea is that momentum will continue with little movement back inside the channel, you could set a stop just above or below the EMA, depending on the direction of the trade, as seen in the first example.
As in the second example, you might place the stop above or below the opposing band for a more conservative approach. Again, you can also choose to trail your stop, either just beyond the channel, above or below key swing points, and above or below the EMA.
Take Profit: You could wait for the price to make another retest of the upper/lower bound once it moves beyond the high or low of your signal candle to start taking profits. Or, you could wait for a reversal candle to form, like a hammer or shooting star, that closes within the channel to take profits.
In both examples, the price breaks out of the channel with momentum following a sideways range. Traders can jump in on the retest of the channel’s bands before the strong momentum continues. In the first example, a stop above the EMA would have been suitable, while it would have seen you stopped out in the second. But, taking a more conservative approach allowed us to ride the trend and potentially make more profit.
What to Do Next
You now have a comprehensive overview of Keltner Channels and how to apply them to the markets. However, understanding is just the first step in using Keltner Channels to trade. Here are some actionable steps you can follow to make the most out of the indicator:
- Practice using Keltner Channels with live charts, using this article to complement your observations. You can use TickTrader to help you with this.
- Note your observations, and try to come up with your own strategy. You could combine Keltner Channels with other indicators like RSI for extra entry confirmation.
- Feeling ready to trade for real? You can open an FXOpen account and put your strategy to the test.
- Expand your knowledge by reading up on related indicators, like Bollinger Bands and Average True Range.
This article represents the opinion of the Companies operating under the FXOpen brand only. It is not to be construed as an offer, solicitation, or recommendation with respect to products and services provided by the Companies operating under the FXOpen brand, nor is it to be considered financial advice.
Stay ahead of the market!
Subscribe now to our mailing list and receive the latest market news and insights delivered directly to your inbox.


Latest articles

NZD/USD Analysis: A Tug-of-War at the Critical Level
The kiwi has strengthened meaningfully against most peers this month. However, against the US dollar specifically, NZD/USD remains well below its 2026 highs, trading in the mid-0.58 area versus January's peak near 0.6075.
New Zealand's Q2 inflation

AUD/USD and USD/CAD React to Rising Geopolitical Risks
Commodity-linked currencies remain under pressure as geopolitical tensions in the Middle East continue to escalate. The United States has maintained strikes on targets in Iran, while the Tehran-backed Houthis have intensified threats to shipping in the Red Sea and near

GBP/CHF: Trendline or RSI — Which One Is Lying?
Sterling enters this week on firmer footing, with political uncertainty fading fast after Andy Burnham's confirmation as Labour leader eased investor concerns over the succession to Keir Starmer. Markets reacted further to reports pointing to Shabana Mahmood as the frontrunner