FXOpen

AUD/USD struggled to stay above 0.7000 and corrected lower. Similarly, NZD/USD is facing strong resistance near 0.6540.
Important Takeaways for AUD/USD and NZD/USD Analysis
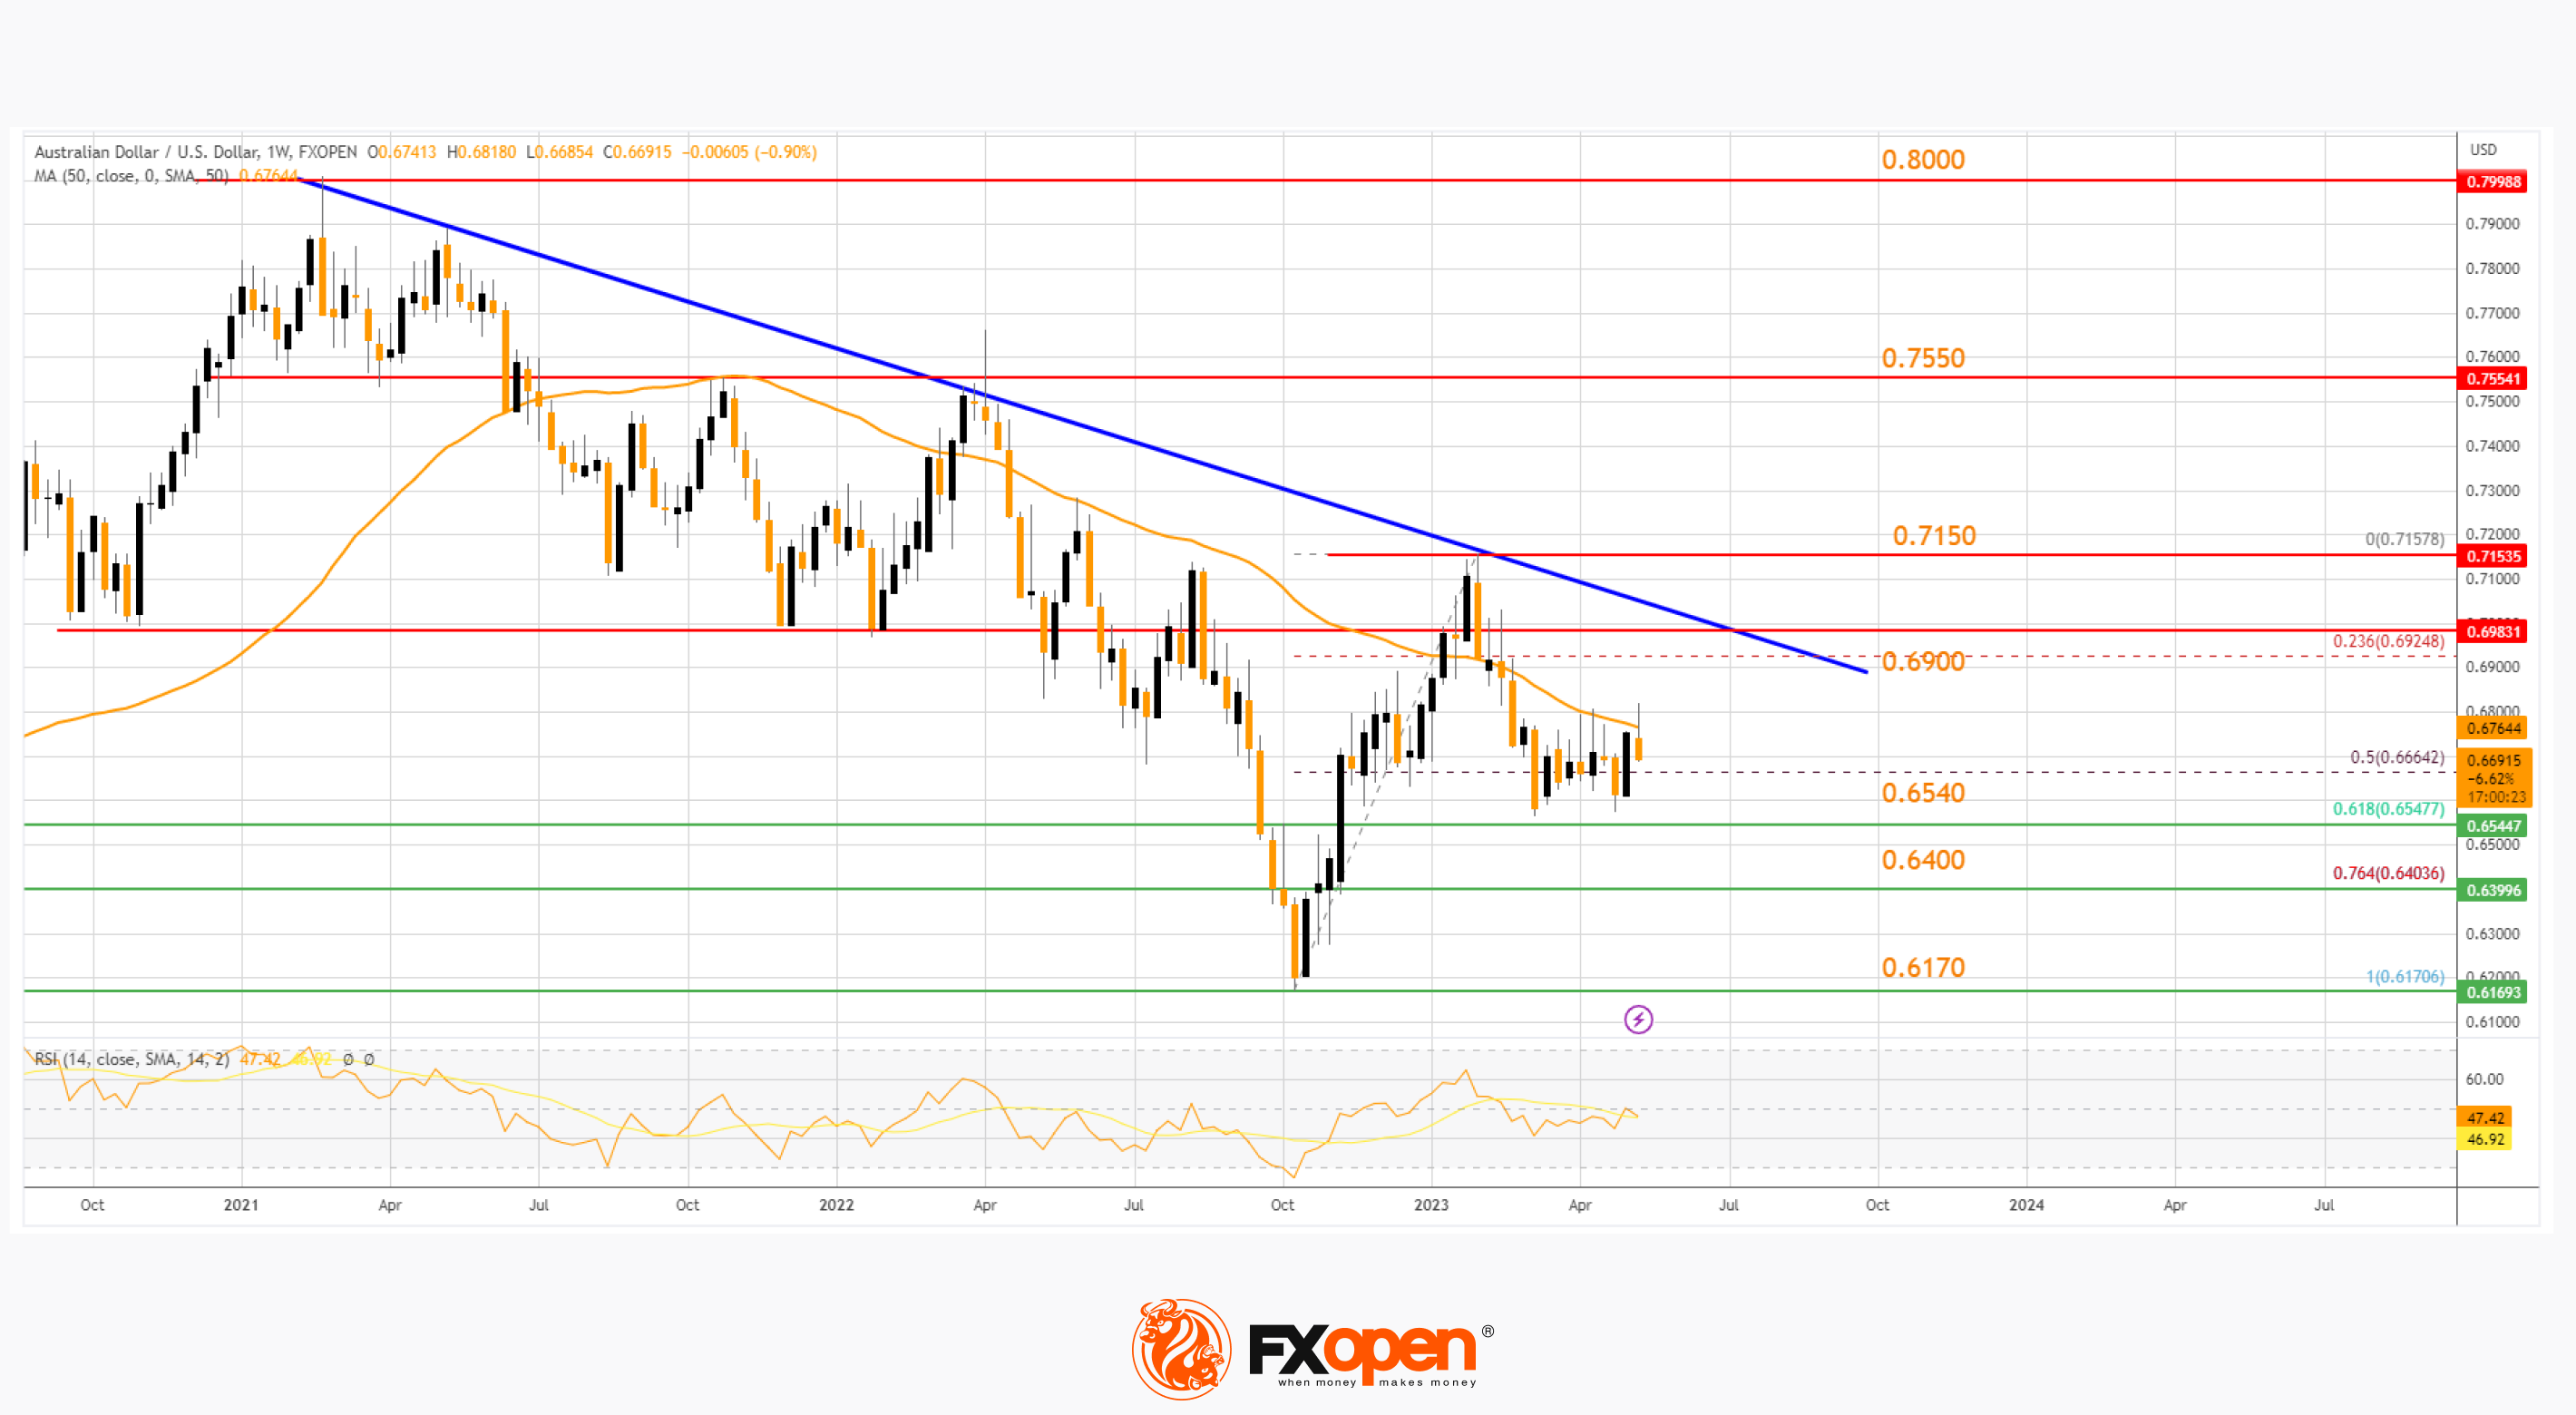
· The Aussie Dollar started a downside correction from the 0.7150 zone against the US Dollar.
· There is a crucial bearish trend line forming with resistance near 0.6900 on the weekly chart of AUD/USD at FXOpen.
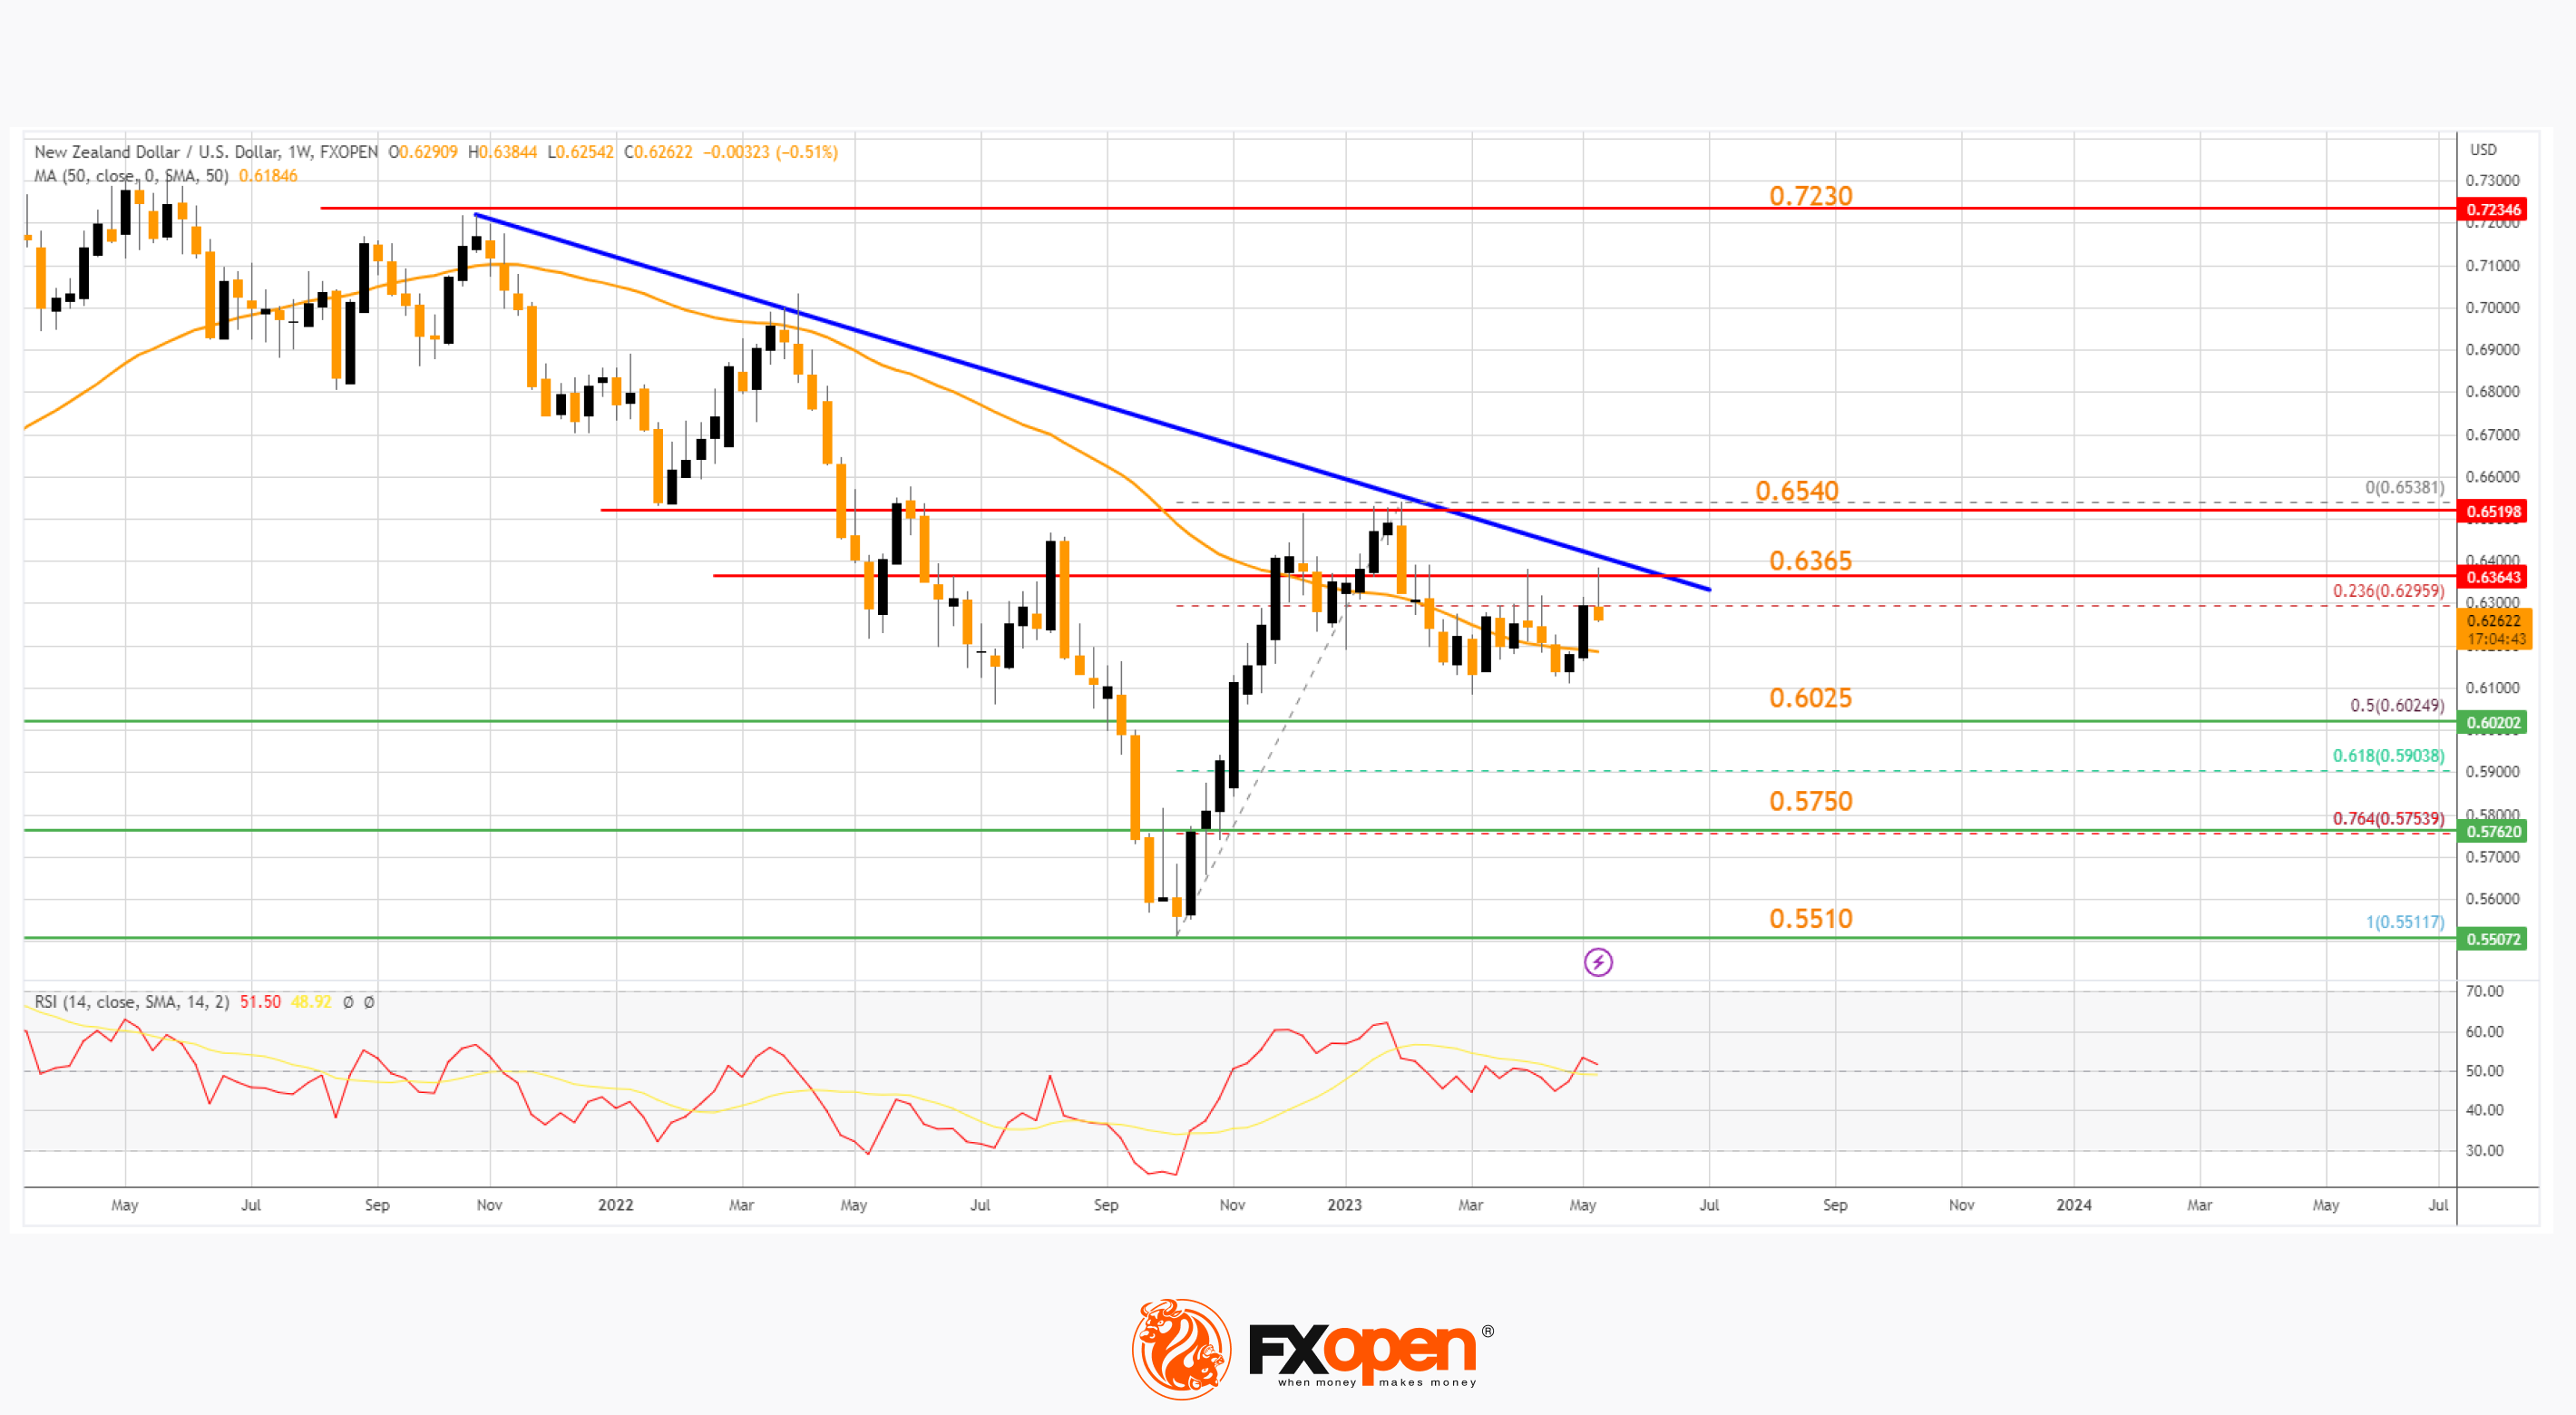
· NZD/USD also started a steady increase above the 0.5750 and 0.6000 levels.
· There is a key bearish trend line forming with resistance near 0.6365 on the weekly chart at FXOpen.
AUD/USD Technical Analysis
On the weekly chart of AUD/USD at FXOpen, the pair climbed higher above the 0.6540 and 0.6900 resistance levels. However, the Aussie Dollar failed to clear the 0.7150 zone against the US Dollar.
As a result, there was a bearish reaction from the 0.7150 zone. The pair corrected lower below the 0.6900 pivot level and the 50-week simple moving average. Besides, there was a spike below the 50% Fib retracement level of the upward move from the 0.6170 swing low to the 0.7157 high.

On the AUD/USD chart, the pair is now showing bearish signs below the 50-week simple moving average and a crucial bearish trend line with resistance near 0.6900. Only a successful daily close above 0.6900 might start a strong recovery toward the 0.7150 level.
Any more gains might send the pair toward the 0.7550 level. The next major resistance sits near the 0.8000 resistance. On the downside, the first major support is near the 61.8% Fib retracement level of the upward move from the 0.6170 swing low to the 0.7157 high at 0.6540.
The next major support is near the 0.6400 level, below which the pair may perhaps extend its decline toward the 0.6170 level. Any more losses might call for a move toward the 0.6000 level.
NZD/USD Technical Analysis
On the weekly chart of NZD/USD at FXOpen, the pair started a steady increase from the 0.5510 zone. The New Zealand Dollar was able to surpass the 0.5750 and 0.6025 resistance levels. There was also a close above the 50-week simple moving average and RSI settled above 50.
However, the pair failed to clear the 0.6540 level. A high is formed near 0.6538 and the pair is now showing a few bearish signs. It moved below the 23.6% Fibonacci retracement level of the upward move from the 0.5511 swing low to the 0.6538 high.

On the downside, the 0.6025 level is a decent support on the NZD/USD chart since it coincides with the 50% Fibonacci retracement level of the upward move from the 0.5511 swing low to the 0.6538 high.
The next major support is near 0.5750, below which NZD/USD might decline toward the 0.5510 support zone. Any more losses could open the doors for a drop toward the 0.5200 level.
Immediate resistance on the upside is near a key bearish trend line at 0.6365. The first major resistance on the upside is near the 0.6540 level. A successful close above 0.6540 could start a solid upward move toward the 0.7000 resistance. Any more gains might send the pair toward the 0.7230 level.
Trade over 50 forex markets 24 hours a day with FXOpen. Take advantage of low commissions, deep liquidity, and spreads from 0.0 pips (additional fees may apply). Open your FXOpen account now or learn more about trading forex with FXOpen.
This article represents the opinion of the Companies operating under the FXOpen brand only. It is not to be construed as an offer, solicitation, or recommendation with respect to products and services provided by the Companies operating under the FXOpen brand, nor is it to be considered financial advice.
Stay ahead of the market!
Subscribe now to our mailing list and receive the latest market news and insights delivered directly to your inbox.


