


FXOpen

EUR/USD started a decent recovery above the 1.0500 resistance. USD/JPY is showing positive signs but must clear 137.30 to start a fresh increase.
Important Takeaways for EUR/USD and USD/JPY Analysis
· The Euro broke a few hurdles near 1.0500 and 1.0820 against the US Dollar.
· There was a break above a key bearish trend line with resistance near 1.0500 on the weekly chart of EUR/USD at FXOpen.
· USD/JPY corrected lower from the 152.00 resistance and found support at 127.20.
· There is a connecting bullish trend line forming with support at 133.00 on the weekly chart at FXOpen.
EUR/USD Technical Analysis
On the weekly chart of EUR/USD at FXOpen, the pair started a decent recovery wave after it settled above the 1.0000 level. The Euro was able to gain pace above 1.0200 against the US Dollar.
During the increase, it traded above a key bearish trend line with resistance near 1.0500 and the 50-week simple moving average. Recently, there was a move above the 50% Fib retracement level of the last major decline from the 1.2266 swing high to the 0.9535 low.
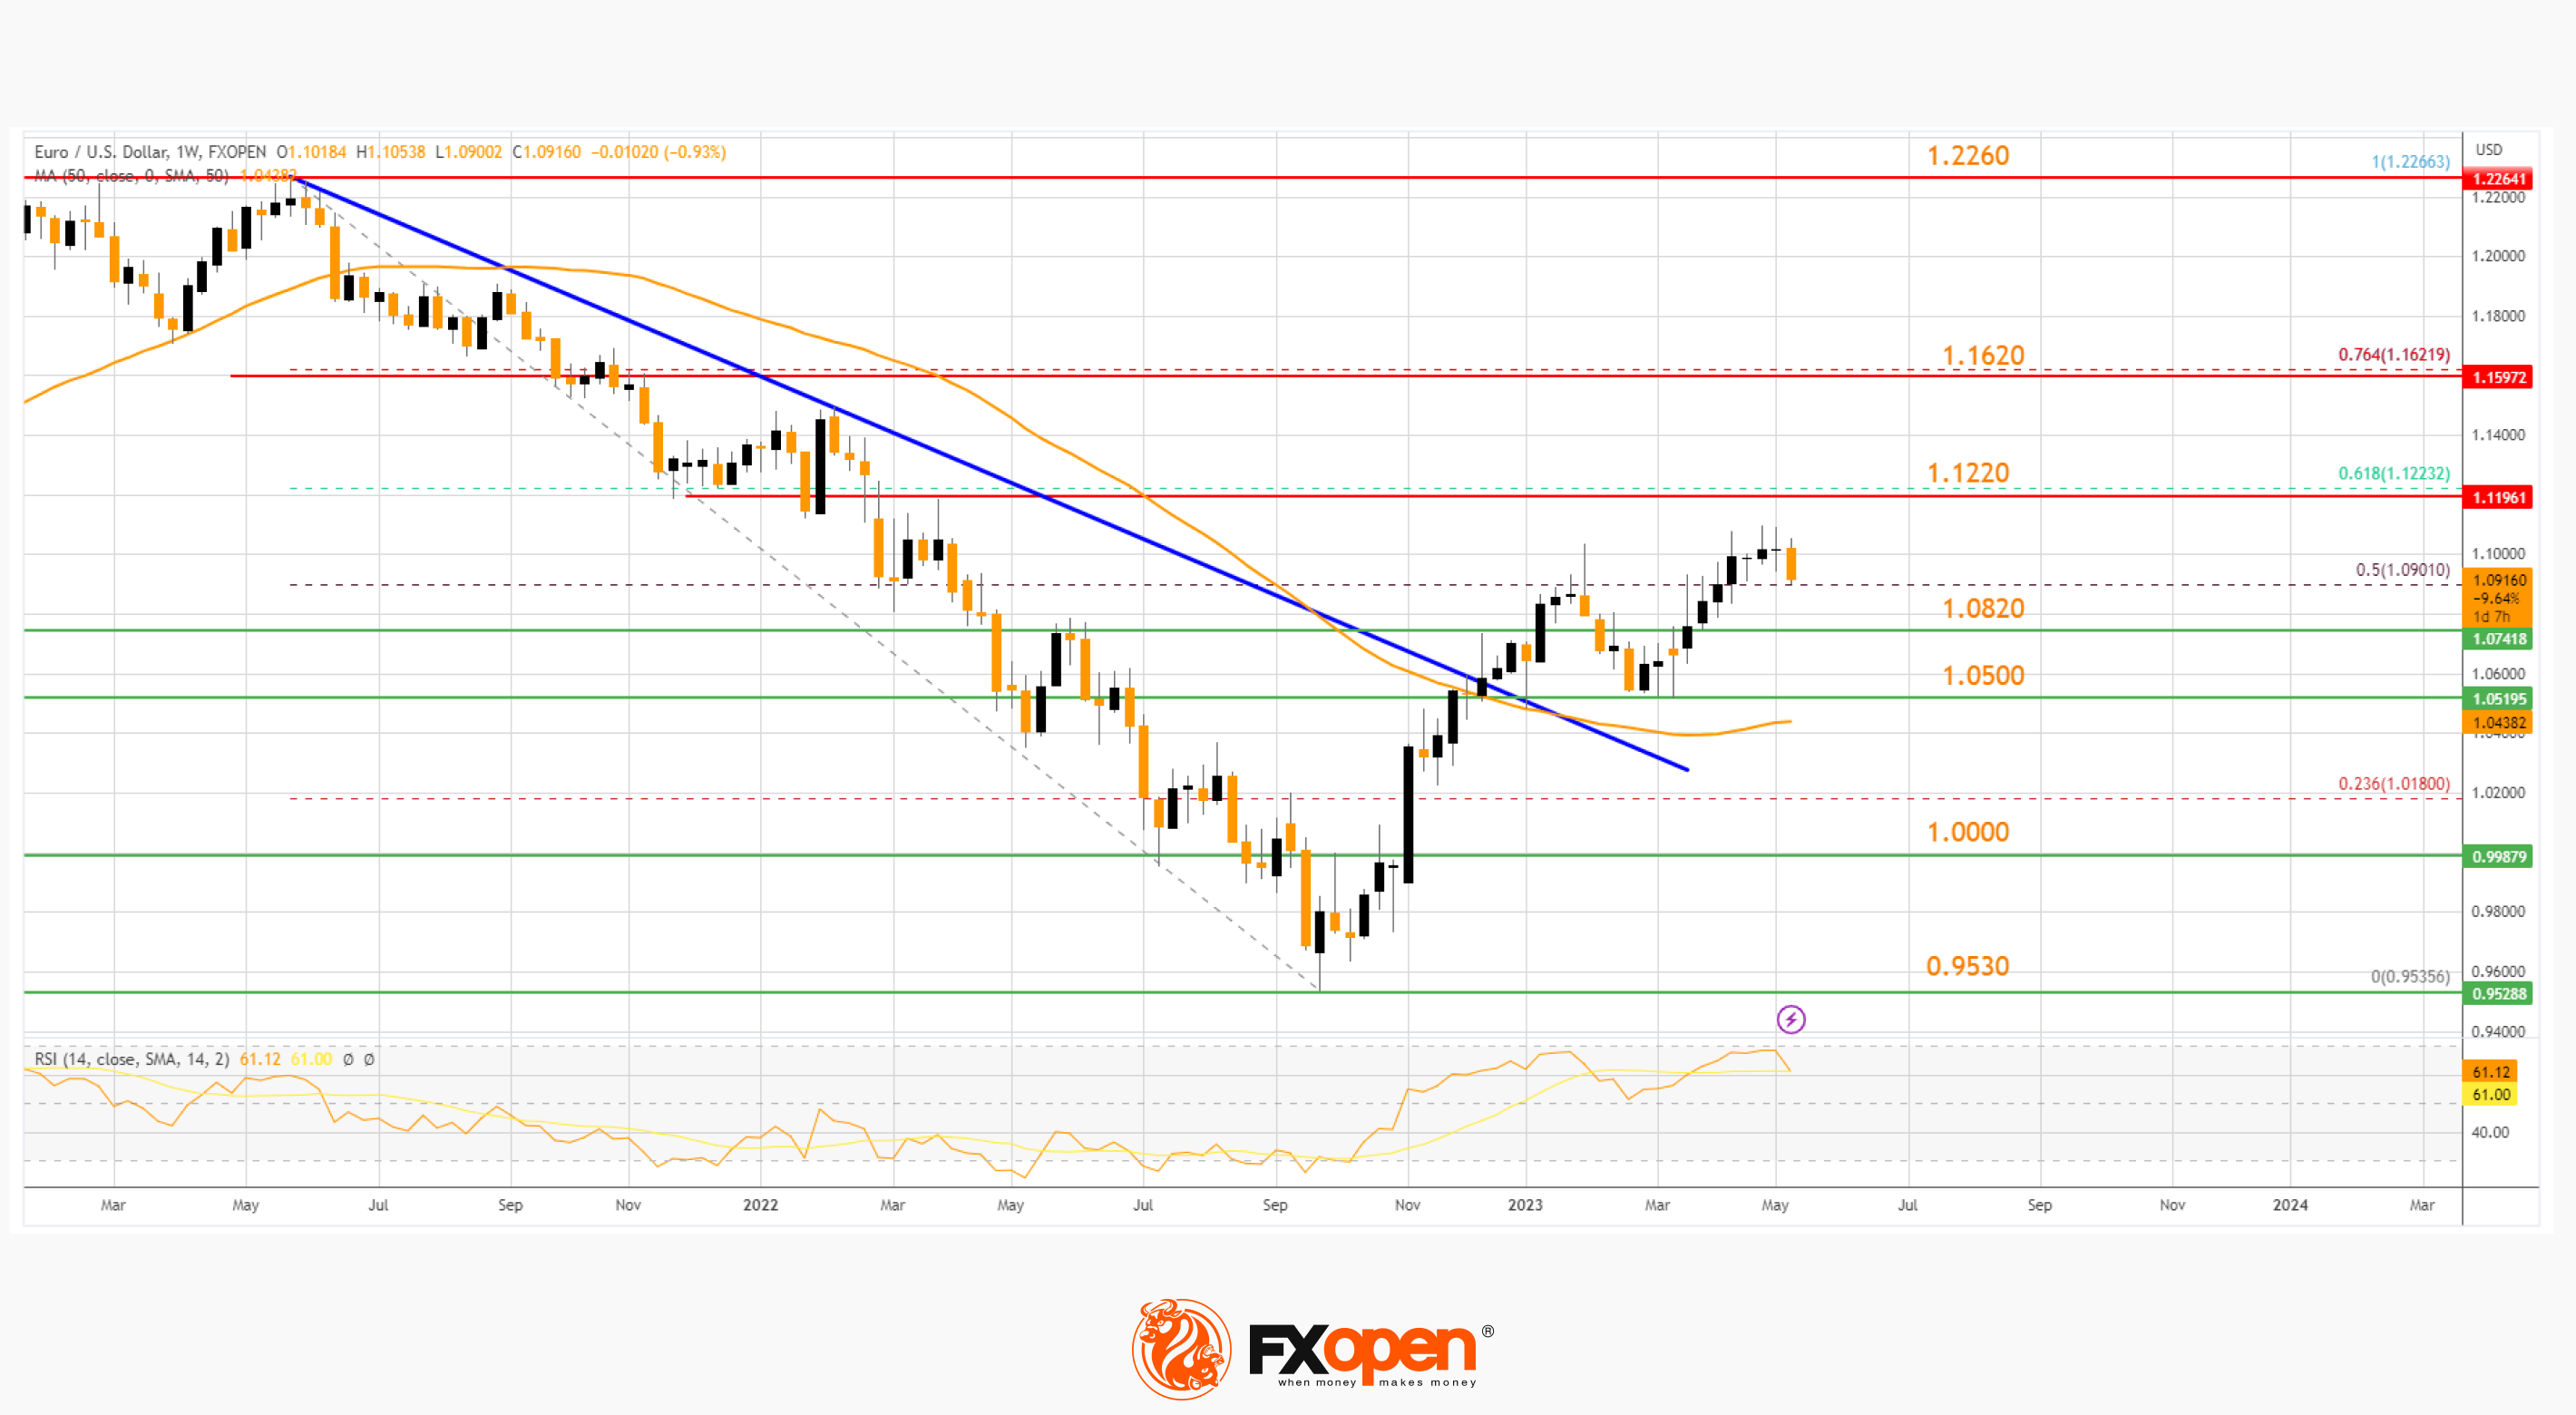
On the upside, the first major resistance is forming near the 61.8% Fib retracement level of the last major decline from the 1.2266 swing high to the 0.9535 low at 1.1220.
The next major resistance on the EUR/USD chart is near the 1.1620 level, above which the pair might revisit the 1.2260 resistance zone if the weekly RSI stays above 50.
Conversely, if EUR/USD fails to climb higher above the 1.1220 resistance, it could correct gains. Immediate support is near the 1.0820 level. The first major support is near the 1.0500 level, below which the pair could decline toward 1.0000.
USD/JPY Technical Analysis
On the weekly chart of USD/JPY, the pair faced strong rejection near the 152.00 level. The US Dollar started a downside correction below the 137.30 support against the Japanese Yen.
The pair tested the 127.20 support. A low was formed near 127.21 and the pair is now rising. It broke the 23.6% Fib retracement level of the downward move from the 151.94 swing high to the 127.21 low.
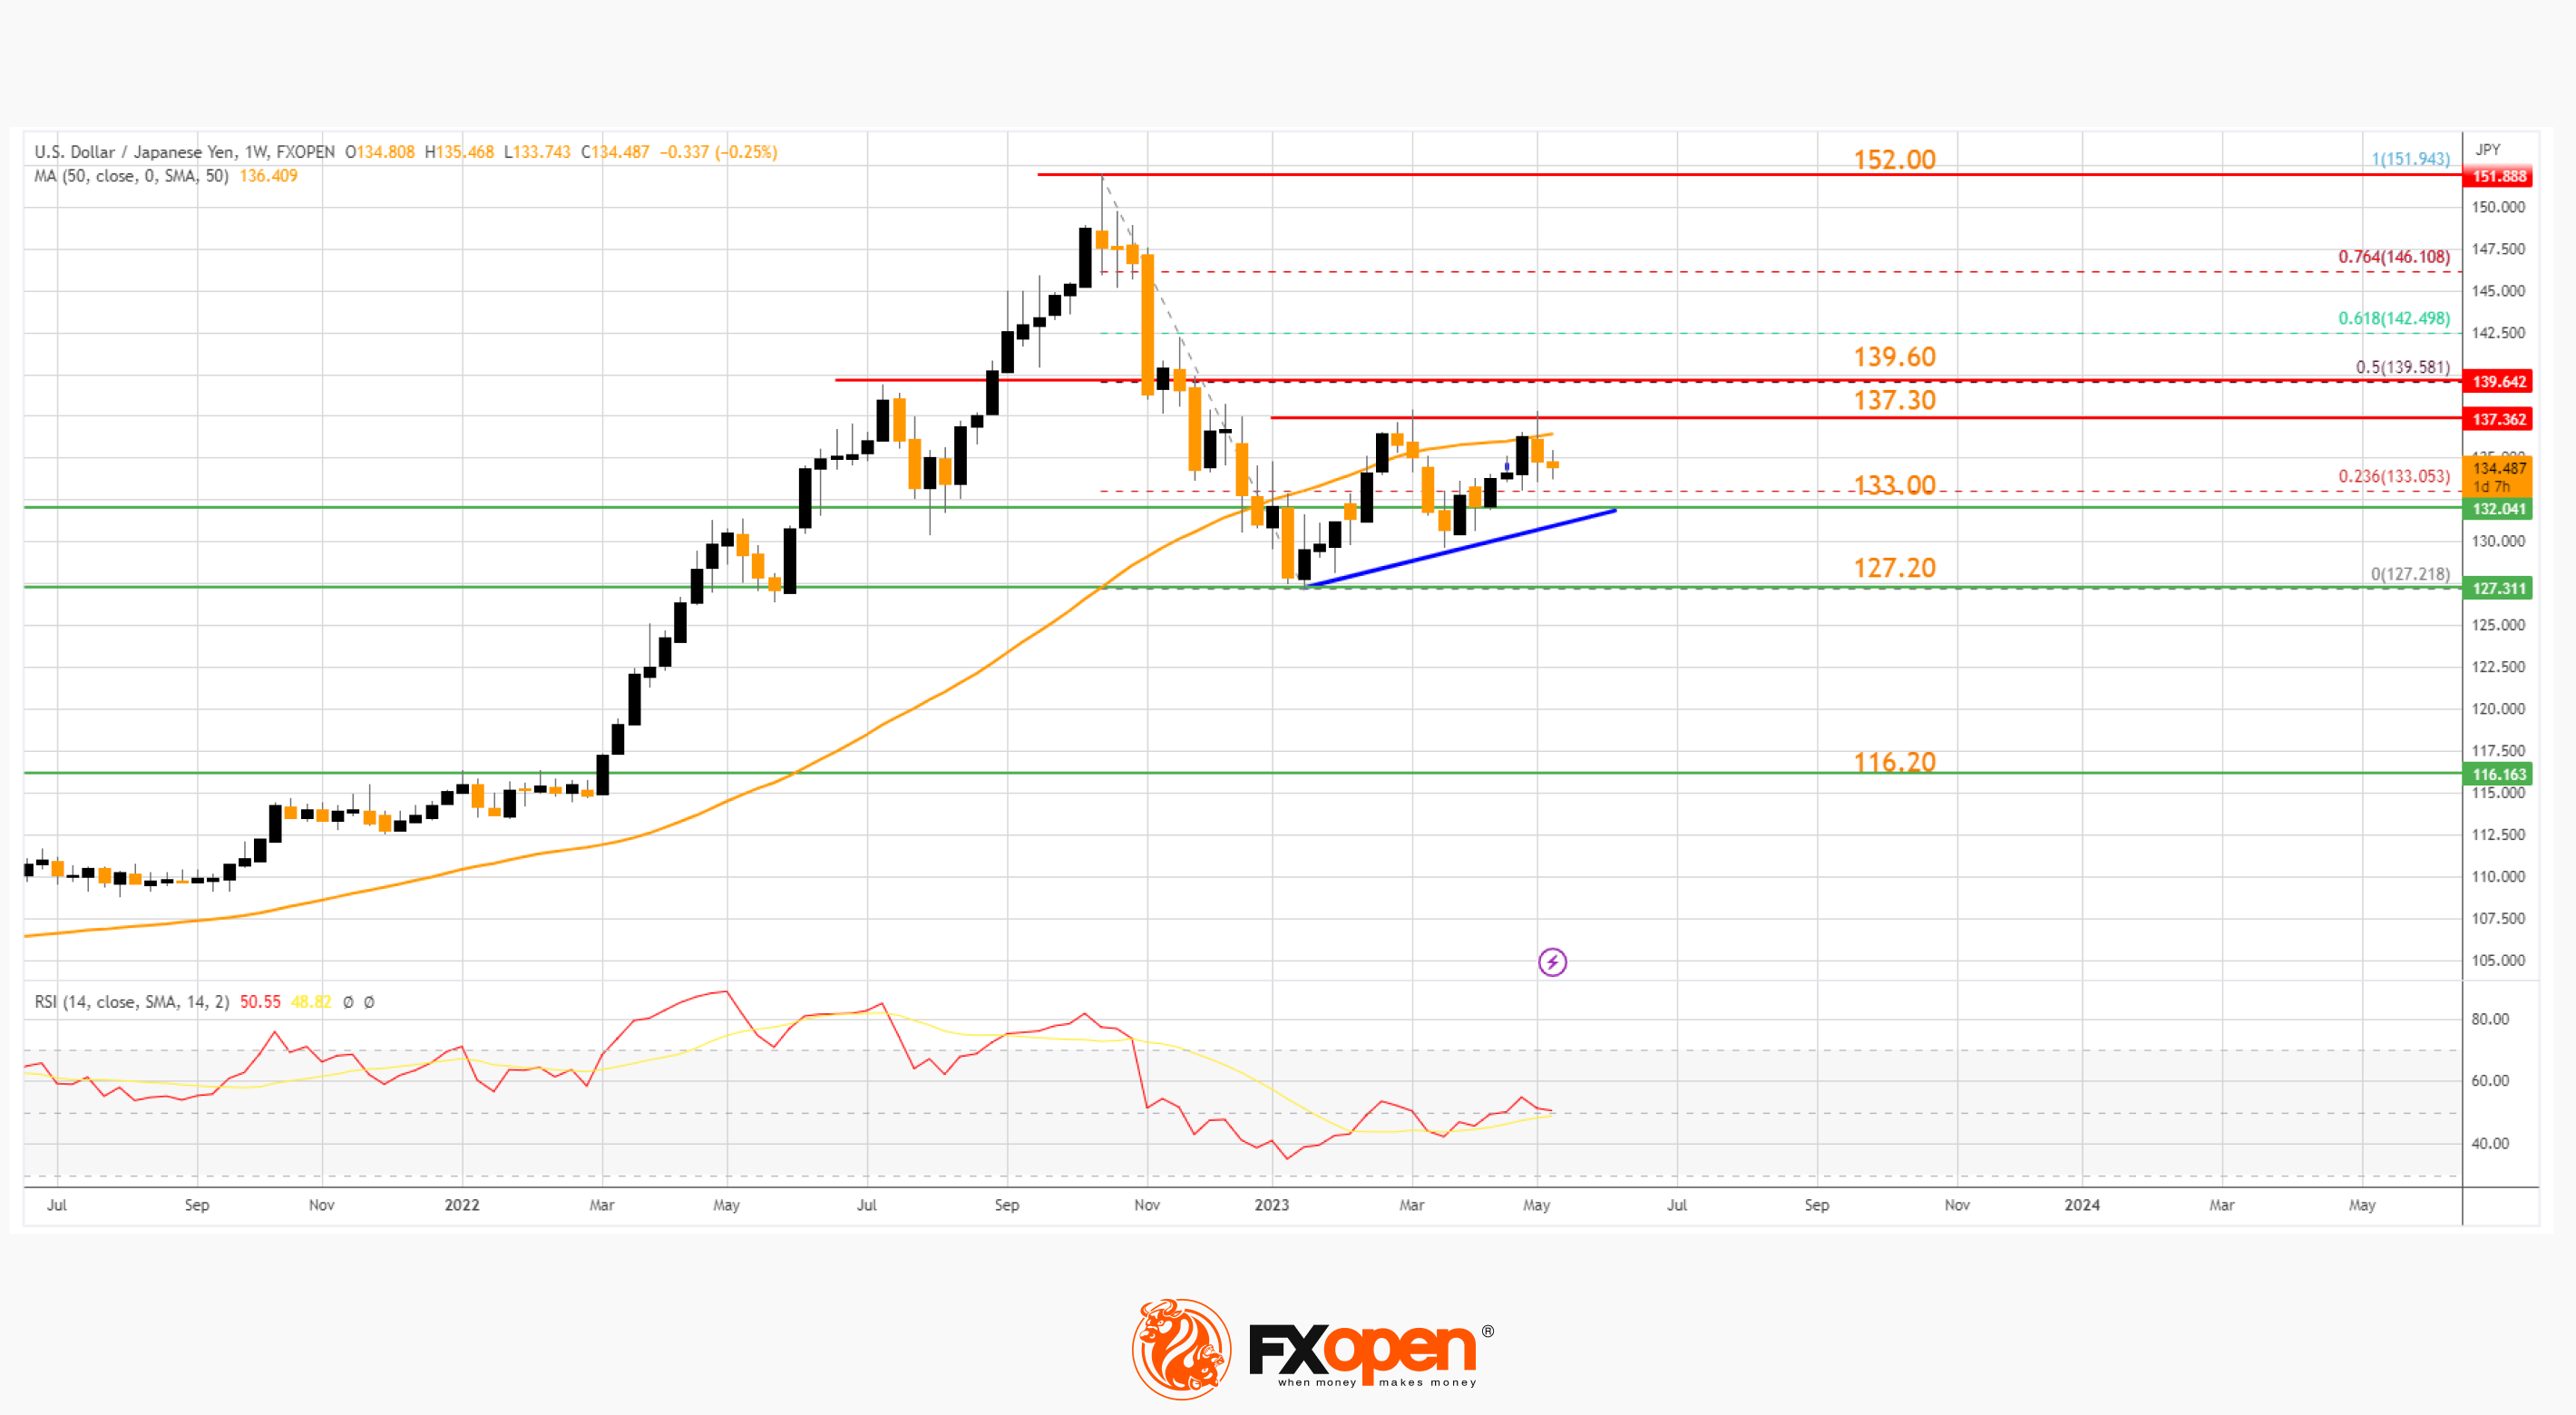
On the upside, the pair is facing resistance near the 50-week simple moving average and 137.20. The next major resistance on the USD/JPY chart is near the 50% Fib retracement level of the downward move from the 151.94 swing high to the 127.21 low at 139.60.
A successful close above 139.60 is likely to start a strong upward move toward 152.00 in the coming weeks. Conversely, if USD/JPY fails to break 139.60, it could retreat lower and revisit the 133.00 support area.
Besides, there is also a connecting bullish trend line forming with support at 133.00. A downside break below the trend line might send the pair toward 127.20.
Any more losses might push the pair into a bearish zone. In the stated case, there is a risk of a drop toward the 116.20 support zone in the medium term.
Trade over 50 forex markets 24 hours a day with FXOpen. Take advantage of low commissions, deep liquidity, and spreads from 0.0 pips (additional fees may apply). Open your FXOpen account now or learn more about trading forex with FXOpen.
This article represents the opinion of the Companies operating under the FXOpen brand only. It is not to be construed as an offer, solicitation, or recommendation with respect to products and services provided by the Companies operating under the FXOpen brand, nor is it to be considered financial advice.
Stay ahead of the market!
Subscribe now to our mailing list and receive the latest market news and insights delivered directly to your inbox.


Latest articles

Consolidation Ahead of NFP: Commodity Currencies Search for Direction
Commodity-linked currencies have entered a consolidation phase following recent directional moves, as market participants adopt a wait-and-see approach ahead of key US labour market data. Current price action reflects a balance between ongoing demand for the US dollar and attempts

The Real Driver Behind the Dollar Rally: Market Insights with Gary Thomson
The US dollar has been firm, but the drivers behind the move may be more complex than they first appear.
While geopolitical tension and shifts in risk sentiment play a role, current price behaviour seems increasingly influenced by inflation expectations

EUR/USD and USD/CHF Pull Back: Market Reacts to Fundamentals
European currencies have shown a recovery in recent trading sessions after their recent decline, displaying early signs of a reversal. The US dollar is weakening amid expectations surrounding upcoming US macroeconomic data, while market participants are reassessing their short-term positions