


GBP/USD Corrects Gains While USD/CAD Dips
FXOpen

GBP/USD started a downside correction from the 1.3450 zone. USD/CAD declined and now consolidates below the 1.3850 level.
Important Takeaways for GBP/USD and USD/CAD Analysis Today
· The British Pound rallied above 1.3200 and 1.3320 before the bears appeared.
· There is a key bearish trend line forming with resistance at 1.3375 on the hourly chart of GBP/USD at FXOpen.
· USD/CAD started a fresh decline after it failed to clear the 1.3900 resistance.
· There is a major bearish trend line forming with resistance at 1.3815 on the hourly chart at FXOpen.
GBP/USD Technical Analysis
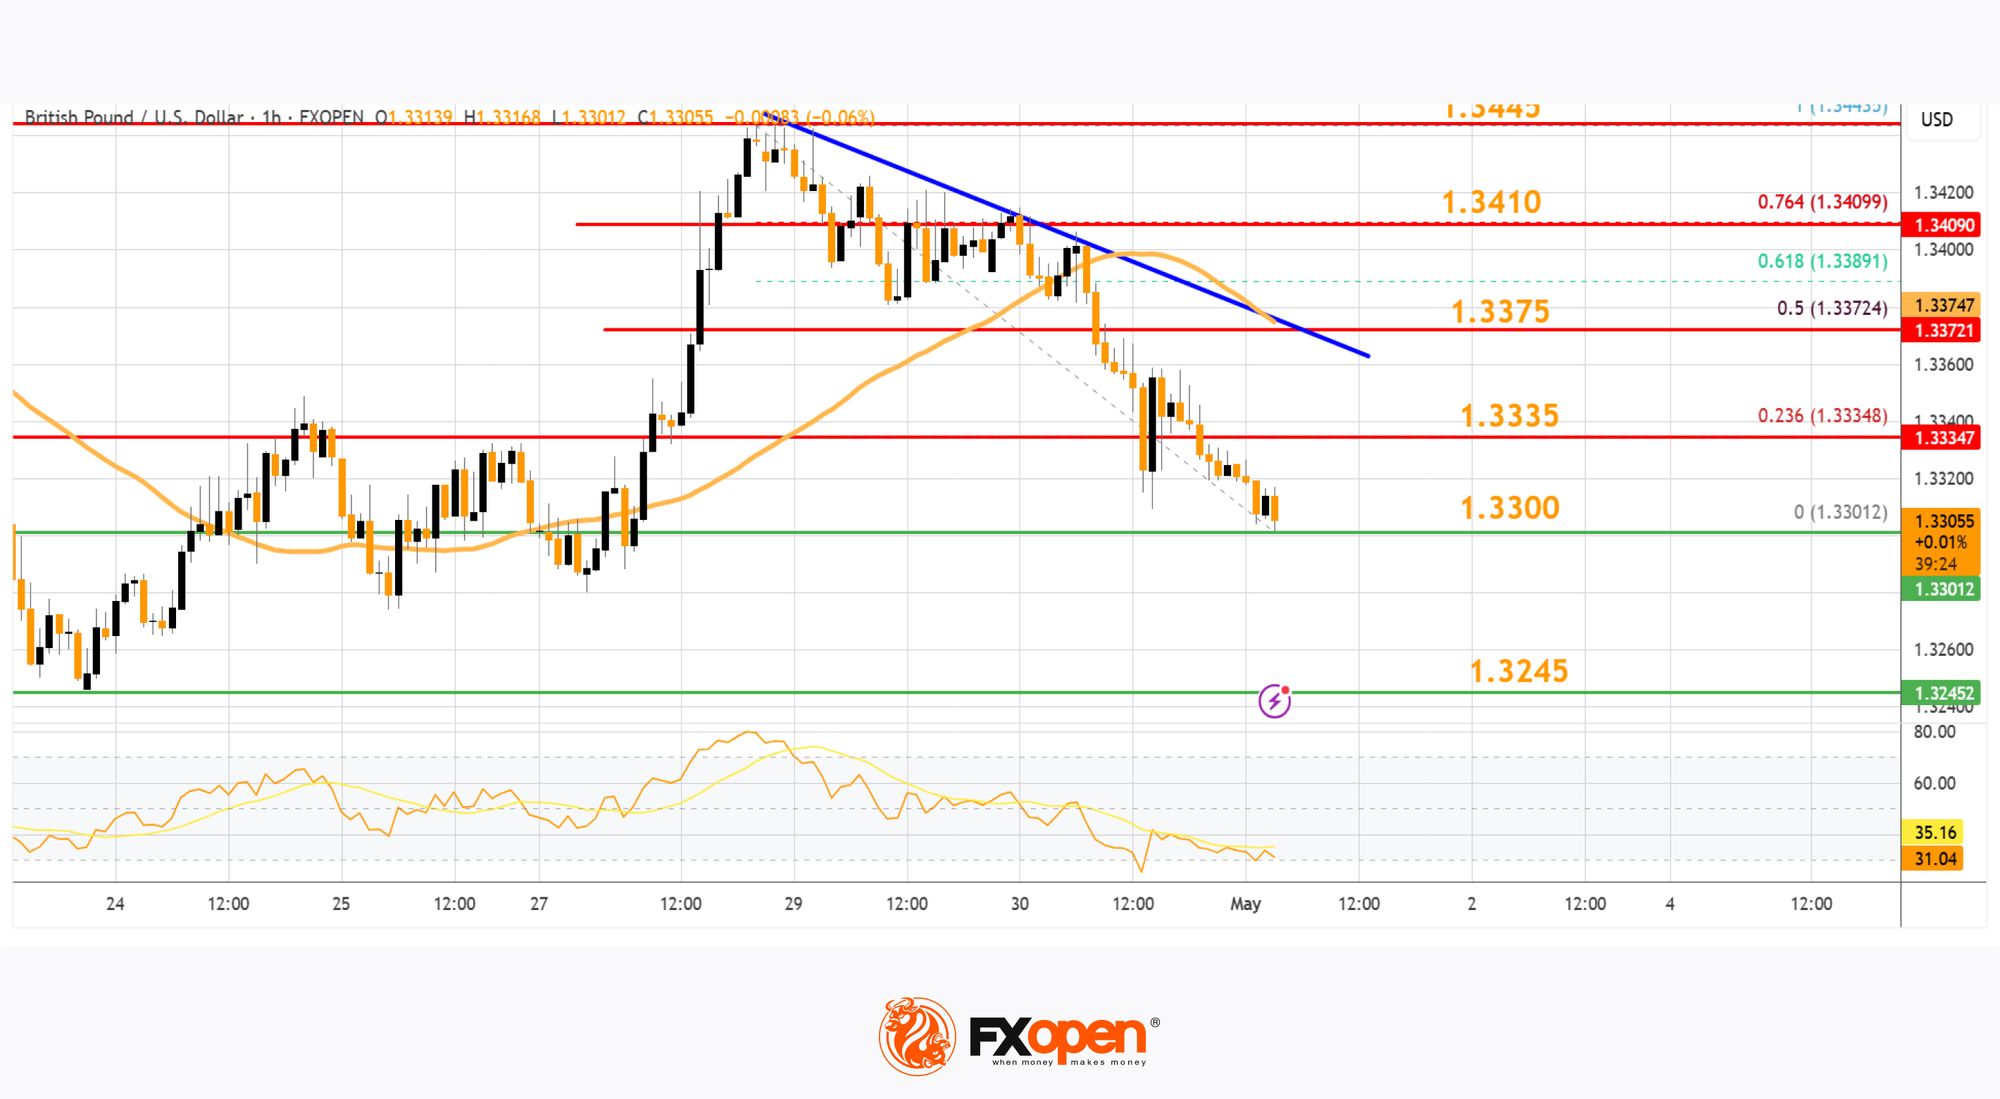
On the hourly chart of GBP/USD at FXOpen, the pair formed a base above the 1.3200 level. The British Pound started a steady increase above the 1.3320 resistance zone against the US Dollar, as discussed in the previous analysis.
The pair even cleared 1.3400 before the bears appeared. A high was formed at 1.3443 before there was a downside correction. There was a move below the 1.3400 and 1.3350 levels.
A low was formed at 1.3301 and the pair is now consolidating losses. On the upside, the pair is facing resistance near the 1.3335 level and the 23.6% Fib retracement level of the downward move from the 1.3443 swing high to the 1.3301 low.
The next key resistance near the 1.3375 level. There is also a key bearish trend line forming with resistance at 1.3375. The trend line is near the 50% Fib retracement level of the downward move from the 1.3443 swing high to the 1.3301 low.
An upside break above the 1.3375 zone could send the pair toward 1.3410. Any more gains might open the doors for a test of 1.3445.
If there is another decline, the pair could find support near the 1.3300 level. The first major support sits near the 1.3245 zone. The next major support is 1.3200. If there is a break below 1.3200, the pair could extend the decline. The next key support is near the 1.3150 level. Any more losses might call for a test of the 1.3080 support.
USD/CAD Technical Analysis
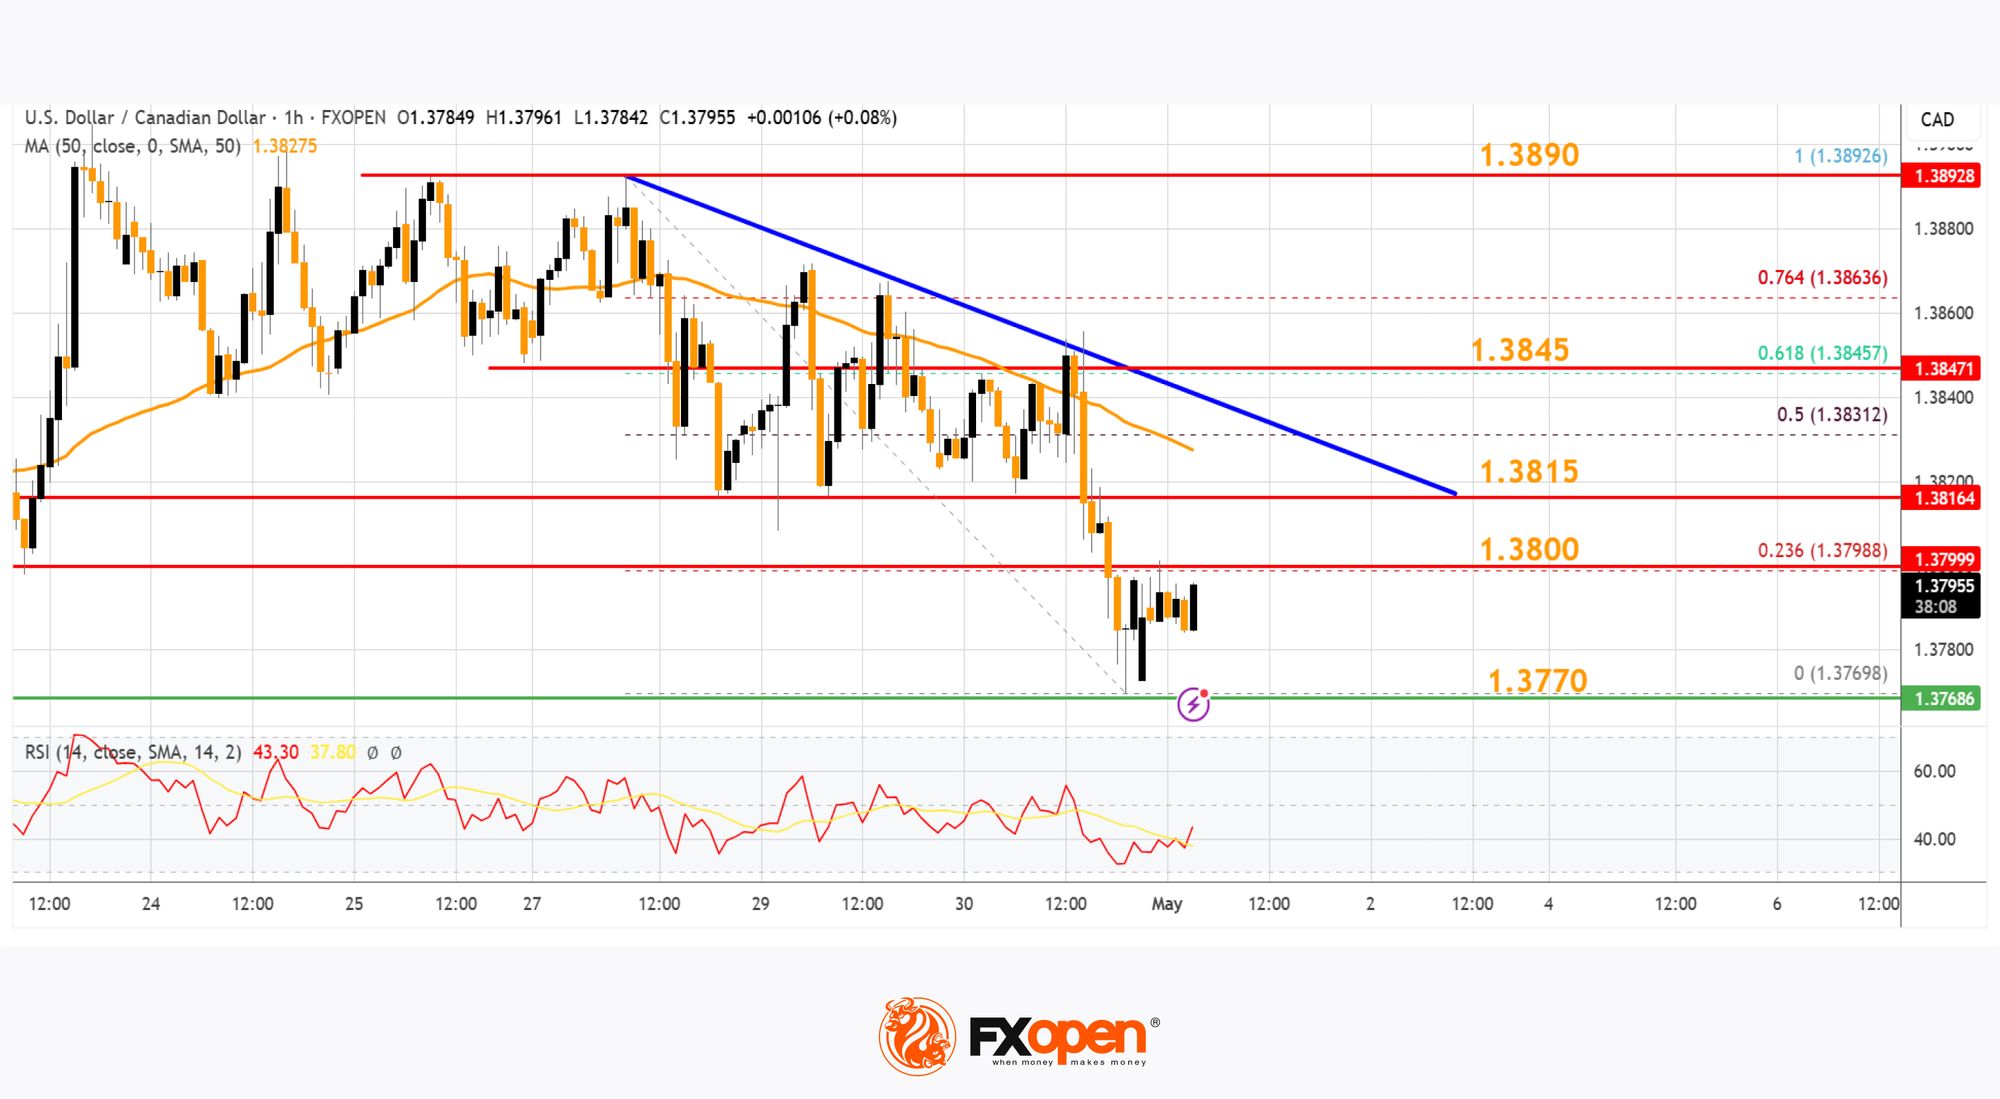
On the hourly chart of USD/CAD at FXOpen, the pair climbed toward the 1.4000 resistance zone before the bears appeared. The US Dollar formed a swing high near 1.3890 and recently declined below the 1.3850 support against the Canadian Dollar.
There was also a close below the 50-hour simple moving average and 1.3820. The bulls are now active near the 1.3770 level. The pair is now consolidating losses below the 23.6% Fib retracement level of the downward move from the 1.3892 swing high to the 1.3768 low.
If there is a fresh increase, the pair could face resistance near the 1.3800 level. The next key resistance on the USD/CAD chart is near the 1.3815 level.
There is also a major bearish trend line forming with resistance at 1.3815. If there is an upside break above 1.3815, the pair could rise toward the 1.3845 resistance or the 61.8% Fib retracement level of the downward move from the 1.3892 swing high to the 1.3768 low.
The next major resistance is near the 1.3890 zone, above which it could rise steadily toward the 1.3950 resistance zone. Immediate support is near the 1.3770 level.
The first major support is near 1.3720. A close below the 1.3720 level might trigger a strong decline. In the stated case, USD/CAD might test 1.3640. Any more losses may possibly open the doors for a drop toward the 1.3550 support.
Trade over 50 forex markets 24 hours a day with FXOpen. Take advantage of low commissions, deep liquidity, and spreads from 0.0 pips (additional fees may apply). Open your FXOpen account now or learn more about trading forex with FXOpen.
This article represents the opinion of the Companies operating under the FXOpen brand only. It is not to be construed as an offer, solicitation, or recommendation with respect to products and services provided by the Companies operating under the FXOpen brand, nor is it to be considered financial advice.
Stay ahead of the market!
Subscribe now to our mailing list and receive the latest market news and insights delivered directly to your inbox.


Latest articles

GBP/CHF: Trendline or RSI — Which One Is Lying?
Sterling enters this week on firmer footing, with political uncertainty fading fast after Andy Burnham's confirmation as Labour leader eased investor concerns over the succession to Keir Starmer. Markets reacted further to reports pointing to Shabana Mahmood as the frontrunner

Silver Attempts to Break Out of Its Range
Silver continues to balance between its dual role as an industrial metal and so-called refuge asset, and this combination largely explains the lack of a clear trend in recent weeks. Shifting expectations for central bank interest rates can influence the

Nasdaq 100: Is This the Correction Traders Have Been Waiting For?
The Nasdaq 100 (US Tech 100 Mini on FXOpen) remains caught between two opposing forces: cooling inflation on one side, and persistent geopolitical instability on the other. On 14 July, June's CPI print came in softer than expected, easing near-term