


FXOpen

Important Takeaways for AUD/USD and NZD/USD Analysis Today
- The Aussie Dollar started a fresh decline from well above the 0.6750 level against the US Dollar.
- There is a key bearish trend line forming with resistance near 0.6630 on the hourly chart of AUD/USD at FXOpen.
- NZD/USD declined heavily below the 0.6125 support zone and tested 0.6050.
- There was a break above a major bearish trend line with resistance near 0.6070 on the hourly chart of NZD/USD at FXOpen.
AUD/USD Technical Analysis
On the hourly chart of AUD/USD at FXOpen, the pair started a fresh decline from the 0.6720 zone. The Aussie Dollar traded below the 0.6670 support to enter a bearish zone against the US Dollar.
The pair even settled below the 50-hour simple moving average at 0.6630. A low is formed near 0.6595 and the pair is now consolidating losses. It is testing the 23.6% Fib retracement level of the downward move from the 0.6750 swing high to the 0.6595 low.
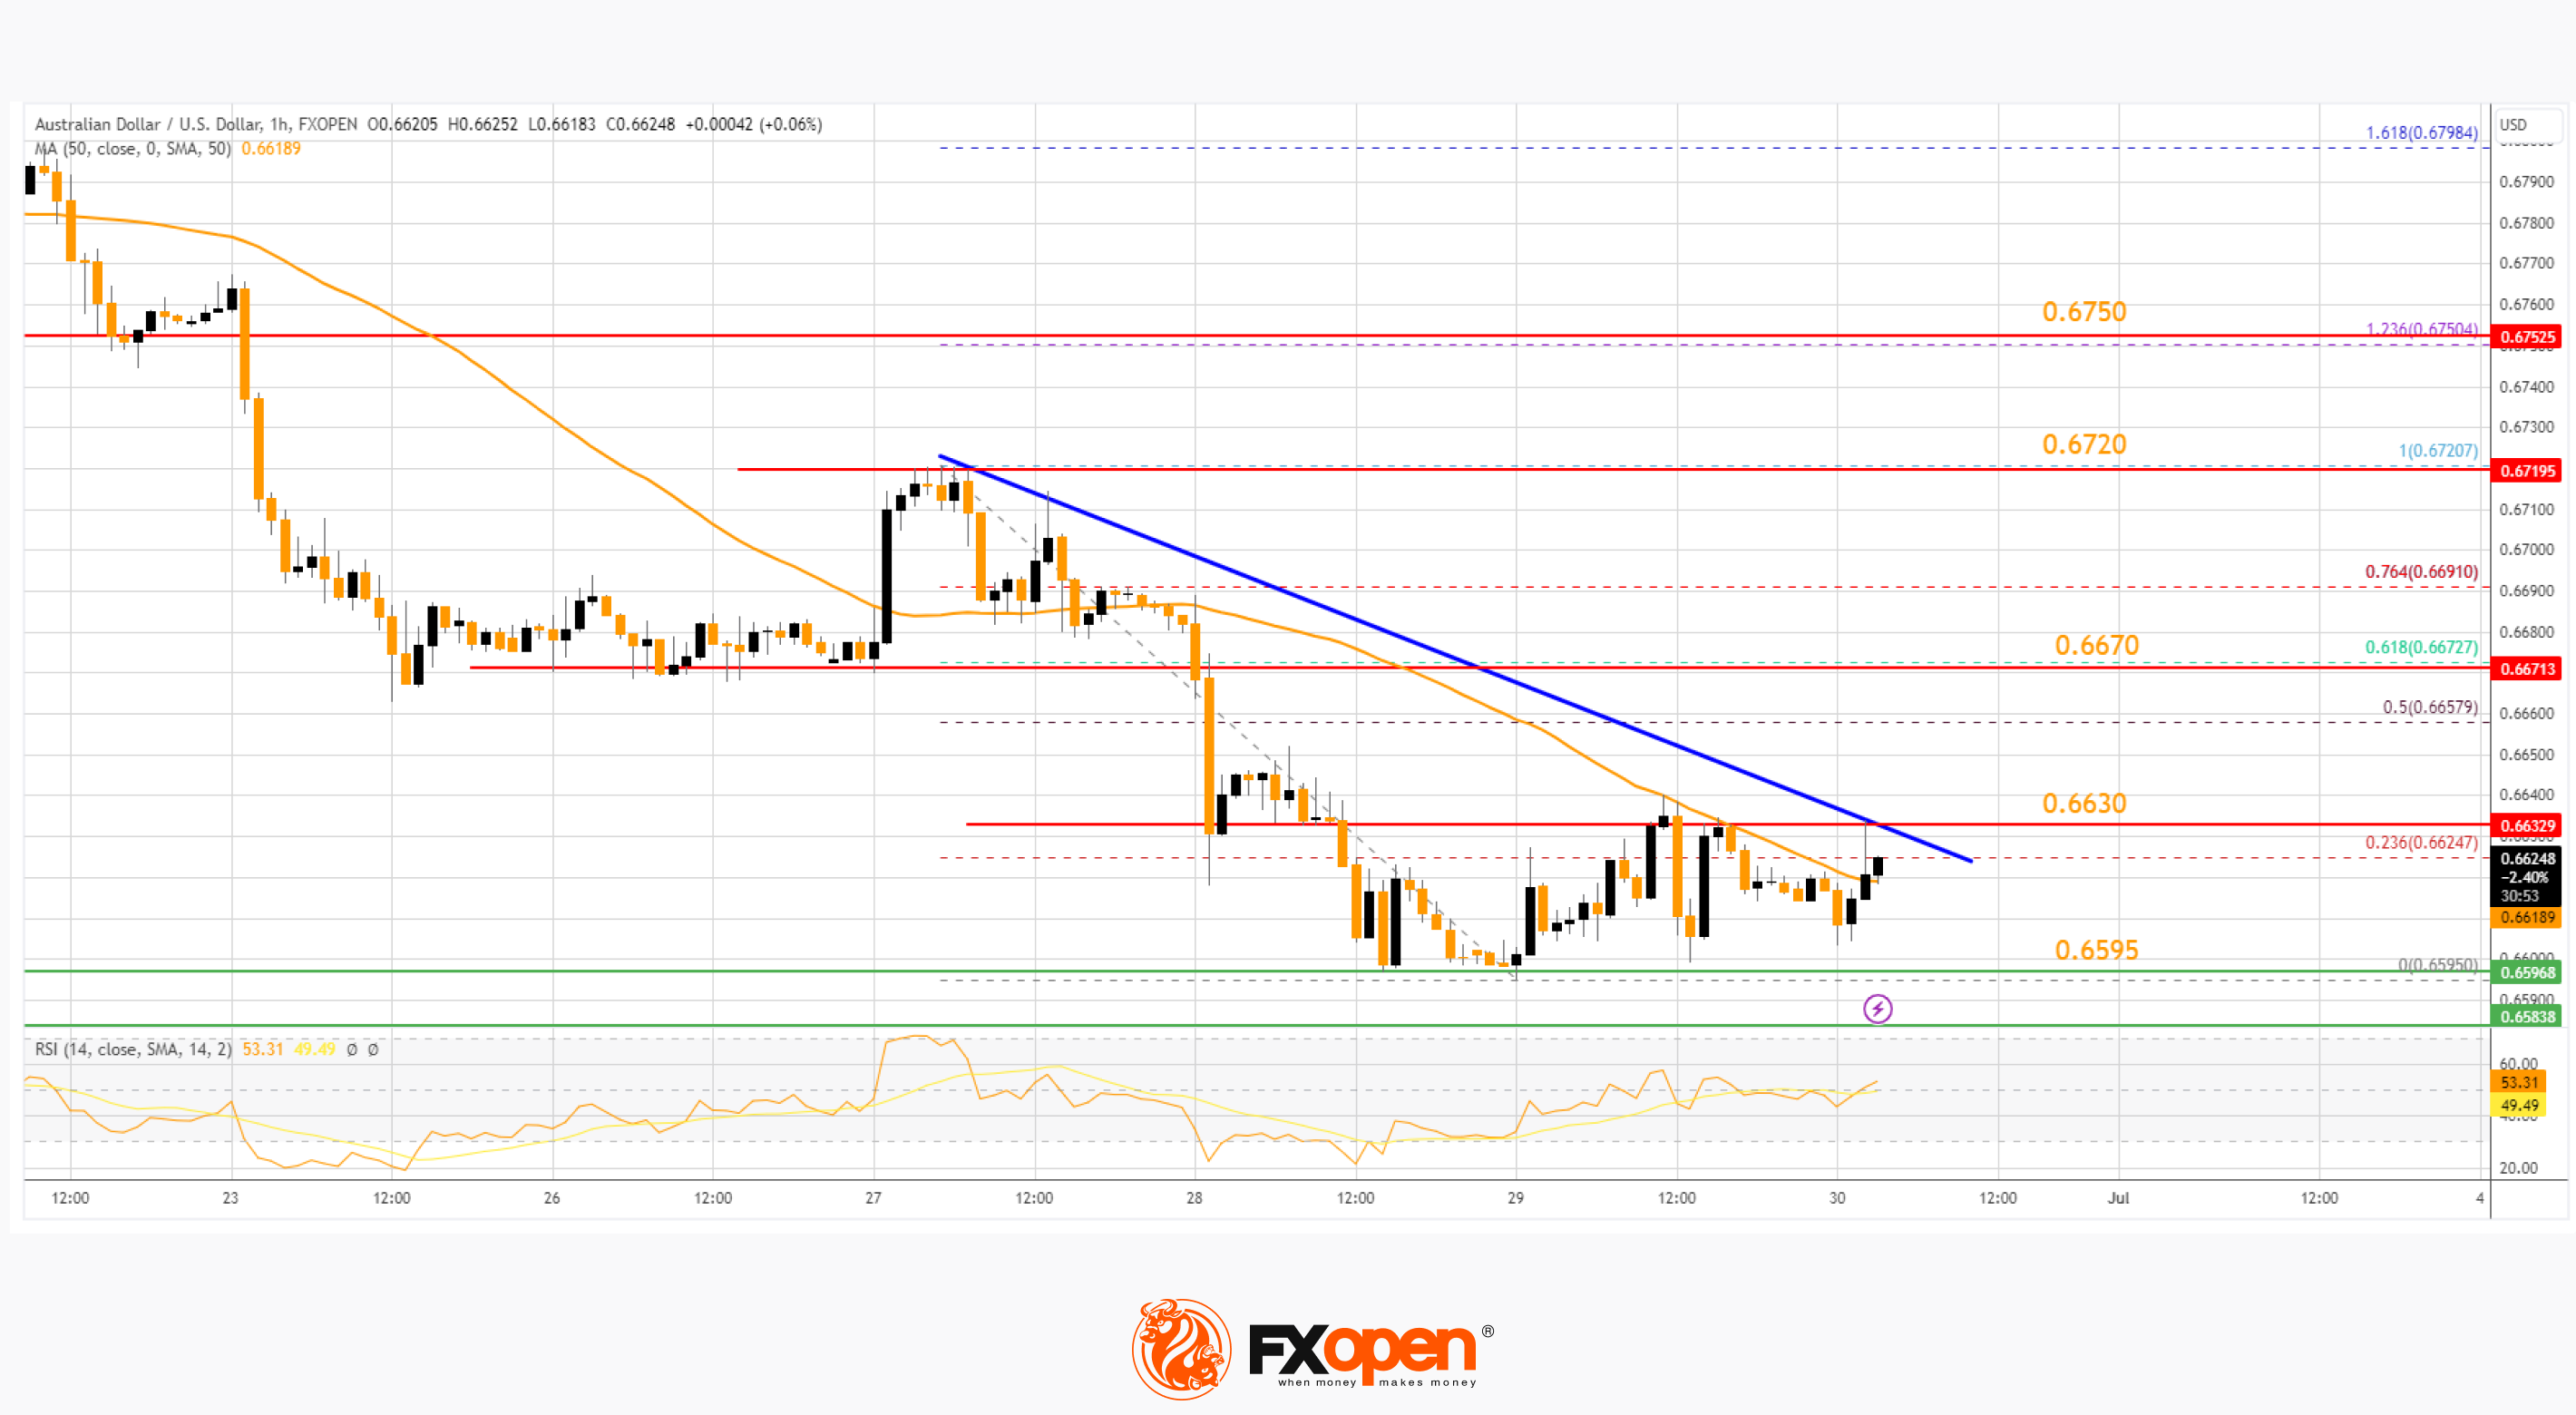
On the upside, the AUD/USD pair is facing resistance near a key bearish trend line at 0.6630. The next major resistance is near the 61.8% Fib retracement level of the downward move from the 0.6750 swing high to the 0.6595 low at 0.6670. A close above the 0.6670 level could start another steady increase in the near term. The next major resistance on the AUD/USD chart could be 0.6750.
On the downside, initial support is near the 0.6595 level. The next support could be the 0.6550 level. If there is a downside break below the 0.6550 support, the pair could extend its decline toward the 0.6500 level. Any more losses might send the pair toward the 0.6440 support.
NZD/USD Technical Analysis
On the hourly chart of NZD/USD at FXOpen, the pair also followed a similar pattern and declined below 0.6125. The New Zealand Dollar gained bearish momentum and traded below 0.6085 against the US Dollar.
A low is formed near 0.6050 and the pair is now attempting a recovery wave. It broke a major bearish trend line with resistance near 0.6070 and the 50-hour simple moving average.
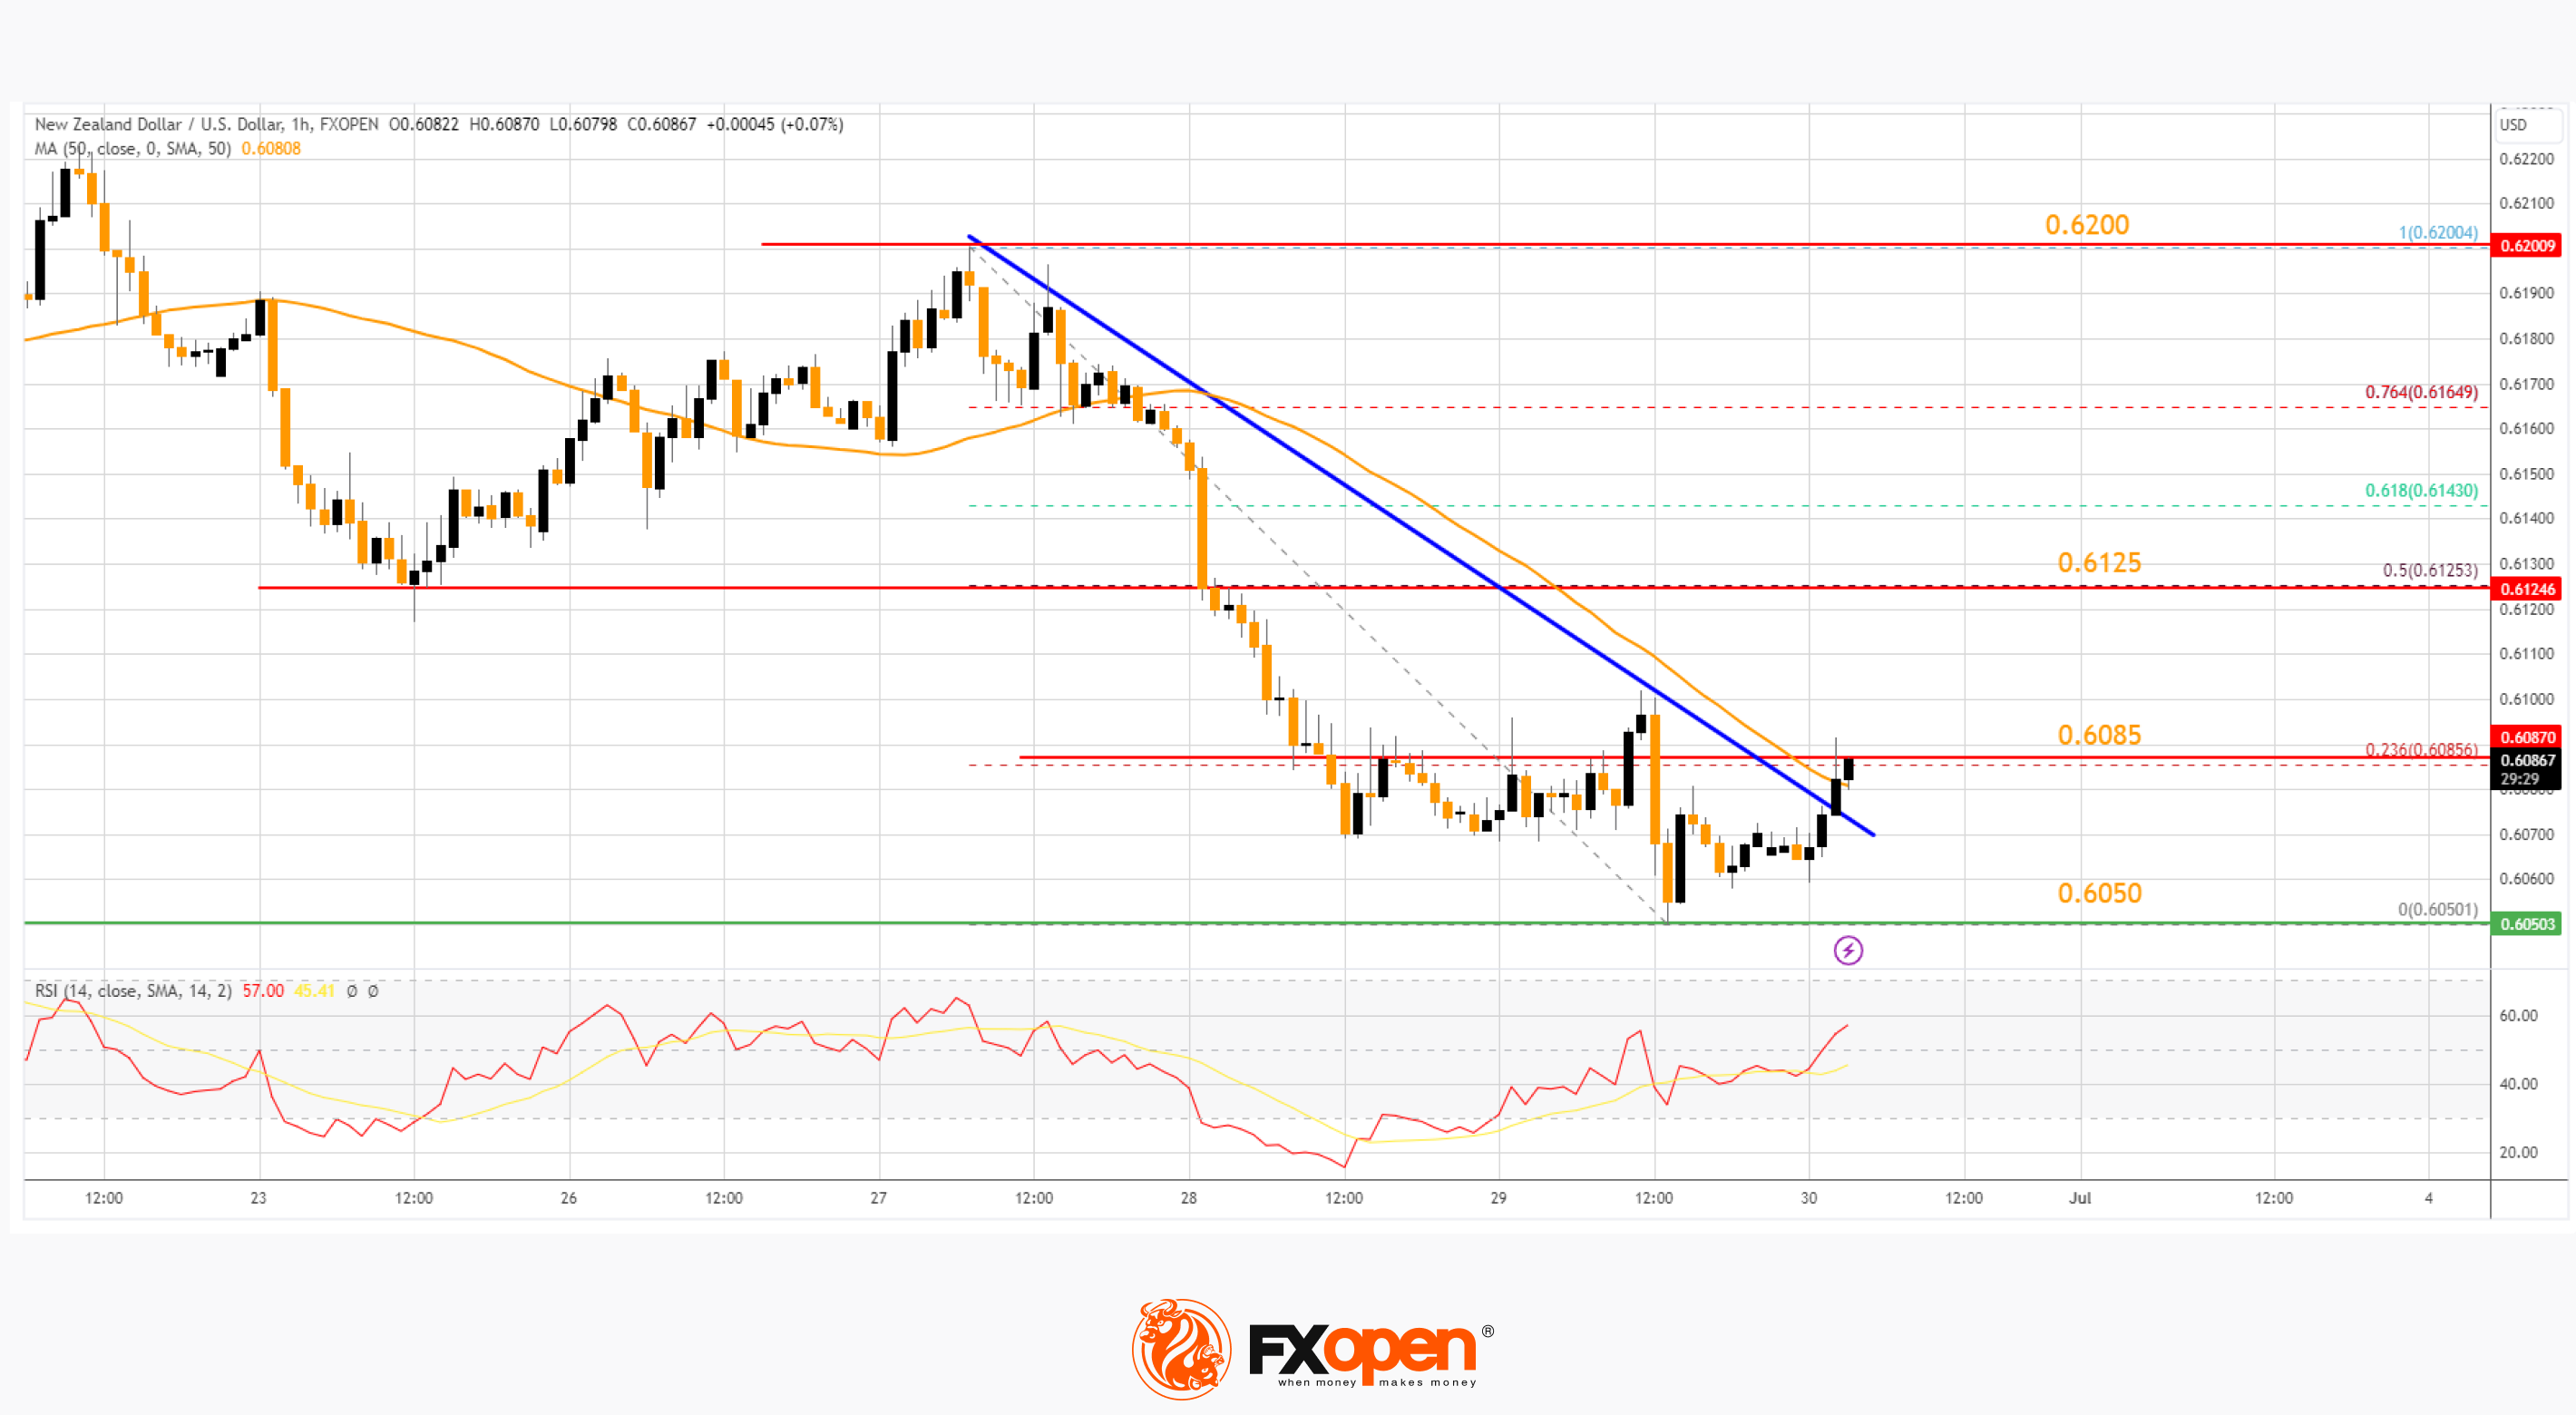
The pair is now testing the 23.6% Fib retracement level of the downward move from the 0.6200 swing high to the 0.6050 low. If there is a move above the 0.6085 resistance, the pair could rise toward 0.6125.
The 50% Fib retracement level of the downward move from the 0.6200 swing high to the 0.6050 low is also near 0.6125 to act as a barrier. Any more gains might open the doors for a move toward the 0.6200 resistance zone in the coming days.
On the downside, immediate support on the NZD/USD chart is near the 0.6050 level. The first major support is near the 0.6020 zone. The next support could be 0.6000. If there is a downside break below it, the pair could extend its decline toward the 0.5950 level.
Trade over 50 forex markets 24 hours a day with FXOpen. Take advantage of low commissions, deep liquidity, and spreads from 0.0 pips (additional fees may apply). Open your FXOpen account now or learn more about trading forex with FXOpen.
This article represents the opinion of the Companies operating under the FXOpen brand only. It is not to be construed as an offer, solicitation, or recommendation with respect to products and services provided by the Companies operating under the FXOpen brand, nor is it to be considered financial advice.
Stay ahead of the market!
Subscribe now to our mailing list and receive the latest market news and insights delivered directly to your inbox.


Latest articles

Market Insights with Gary Thomson: Where Are Oil, Gas & Global Indices Heading?
In this video, we’ll explore the key economic events and market trends, shaping the financial landscape. Get ready for insights into financial markets to help you navigate the week ahead. Let’s dive in!
In this episode of Market

Netflix (NFLX) Shares Pull Back After a 30% Surge
On 21 January, while analysing the NFLX chart, we:
→ identified a descending channel and a resistance zone around the $100 level;
→ noted that Netflix shares were showing a sustained downtrend. Selling pressure had been triggered primarily by reports of a

US Dollar Index (DXY) Rises Above the 100 Level
Today the US Dollar Index (DXY) climbed above the psychological 100 mark for the first time in 2026, supported by a tense fundamental backdrop, with the military conflict in the Middle East acting as the main driver.
→ Financial market participants