


FXOpen

AUD/USD is attempting a fresh increase from 0.7015. NZD/USD is consolidating and could aim for a move above 0.6000 in the short term.
Important Takeaways for AUD/USD and NZD/USD Analysis Today
· The Aussie Dollar remained supported above 0.7000 and recovered losses against the US Dollar.
· There was a break above a key declining channel with resistance at 0.7070 on the hourly chart of AUD/USD at FXOpen.
· NZD/USD is consolidating above 0.5965 and 0.5950.
· There was a break above a declining channel with resistance at 0.5960 on the hourly chart of NZD/USD at FXOpen.
AUD/USD Technical Analysis
On the hourly chart of AUD/USD at FXOpen, the pair formed a base above 0.7000. The Aussie Dollar started a decent increase above 0.7035 against the US Dollar to enter a short-term positive zone.
There was a break above a key declining channel with resistance at 0.7070. The bulls even pushed the pair above the 61.8% Fib retracement level of the downward move from the 0.7147 swing high to the 0.7015 low and the 50-hour simple moving average.
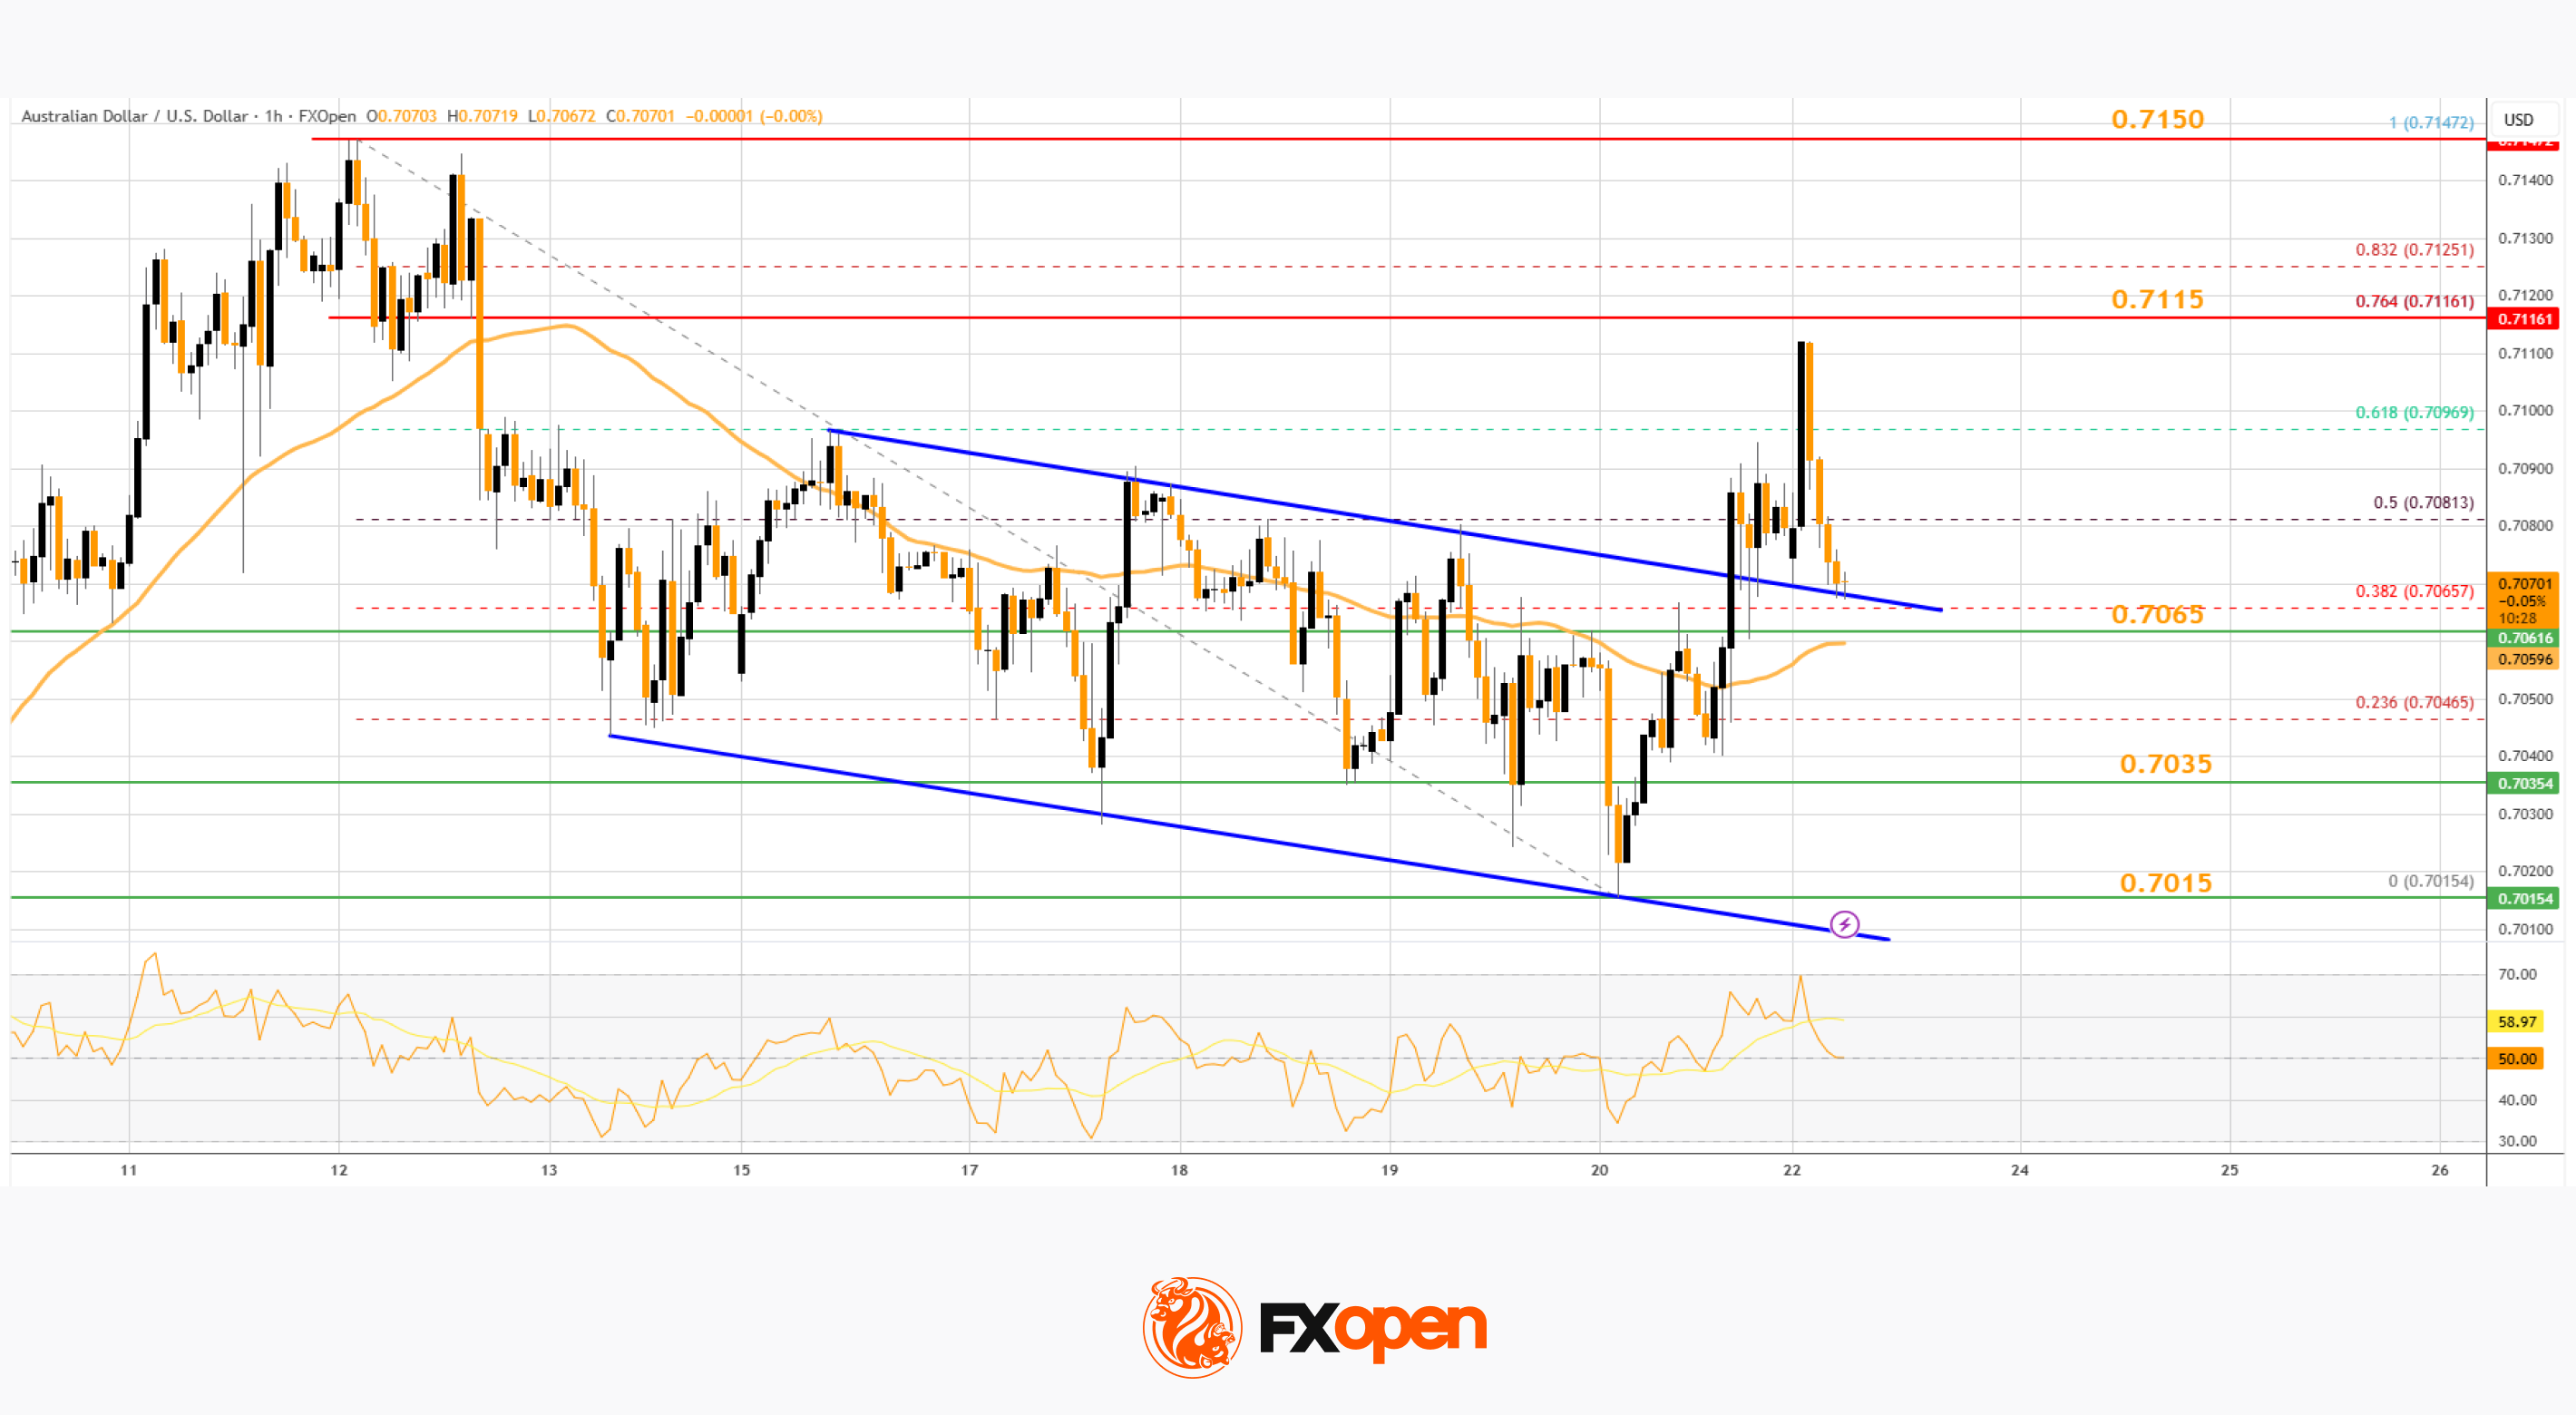
The AUD/USD chart indicates that the pair could struggle to clear the 76.4% Fib retracement at 0.7115. The first major hurdle for the bulls could be 0.7150.
An upside break above 0.7150 might send the pair further higher. The next major target might be 0.7220. Any more gains could clear the path for a move toward 0.7300. If there is no close above 0.7115, the pair might start a fresh decline.
Immediate bid zone could be near 0.7065 and the 50-hour simple moving average. The next area of interest is 0.7035. If there is a downside break below 0.7035, the pair could extend its decline toward 0.7015. Any more losses might signal a move toward 0.6965.
NZD/USD Technical Analysis
On the hourly chart of NZD/USD on FXOpen, the pair also followed AUD/USD. The New Zealand Dollar failed to stay above 0.6020 and corrected gains against the US Dollar.
The pair dipped below 0.5965 and the 50-hour simple moving average and 0.5830. A low was formed at 0.5937, and the pair is now attempting to recover losses. There was a move above the 50% Fib retracement level of the downward move from the 0.6052 swing high to the 0.5937 low.
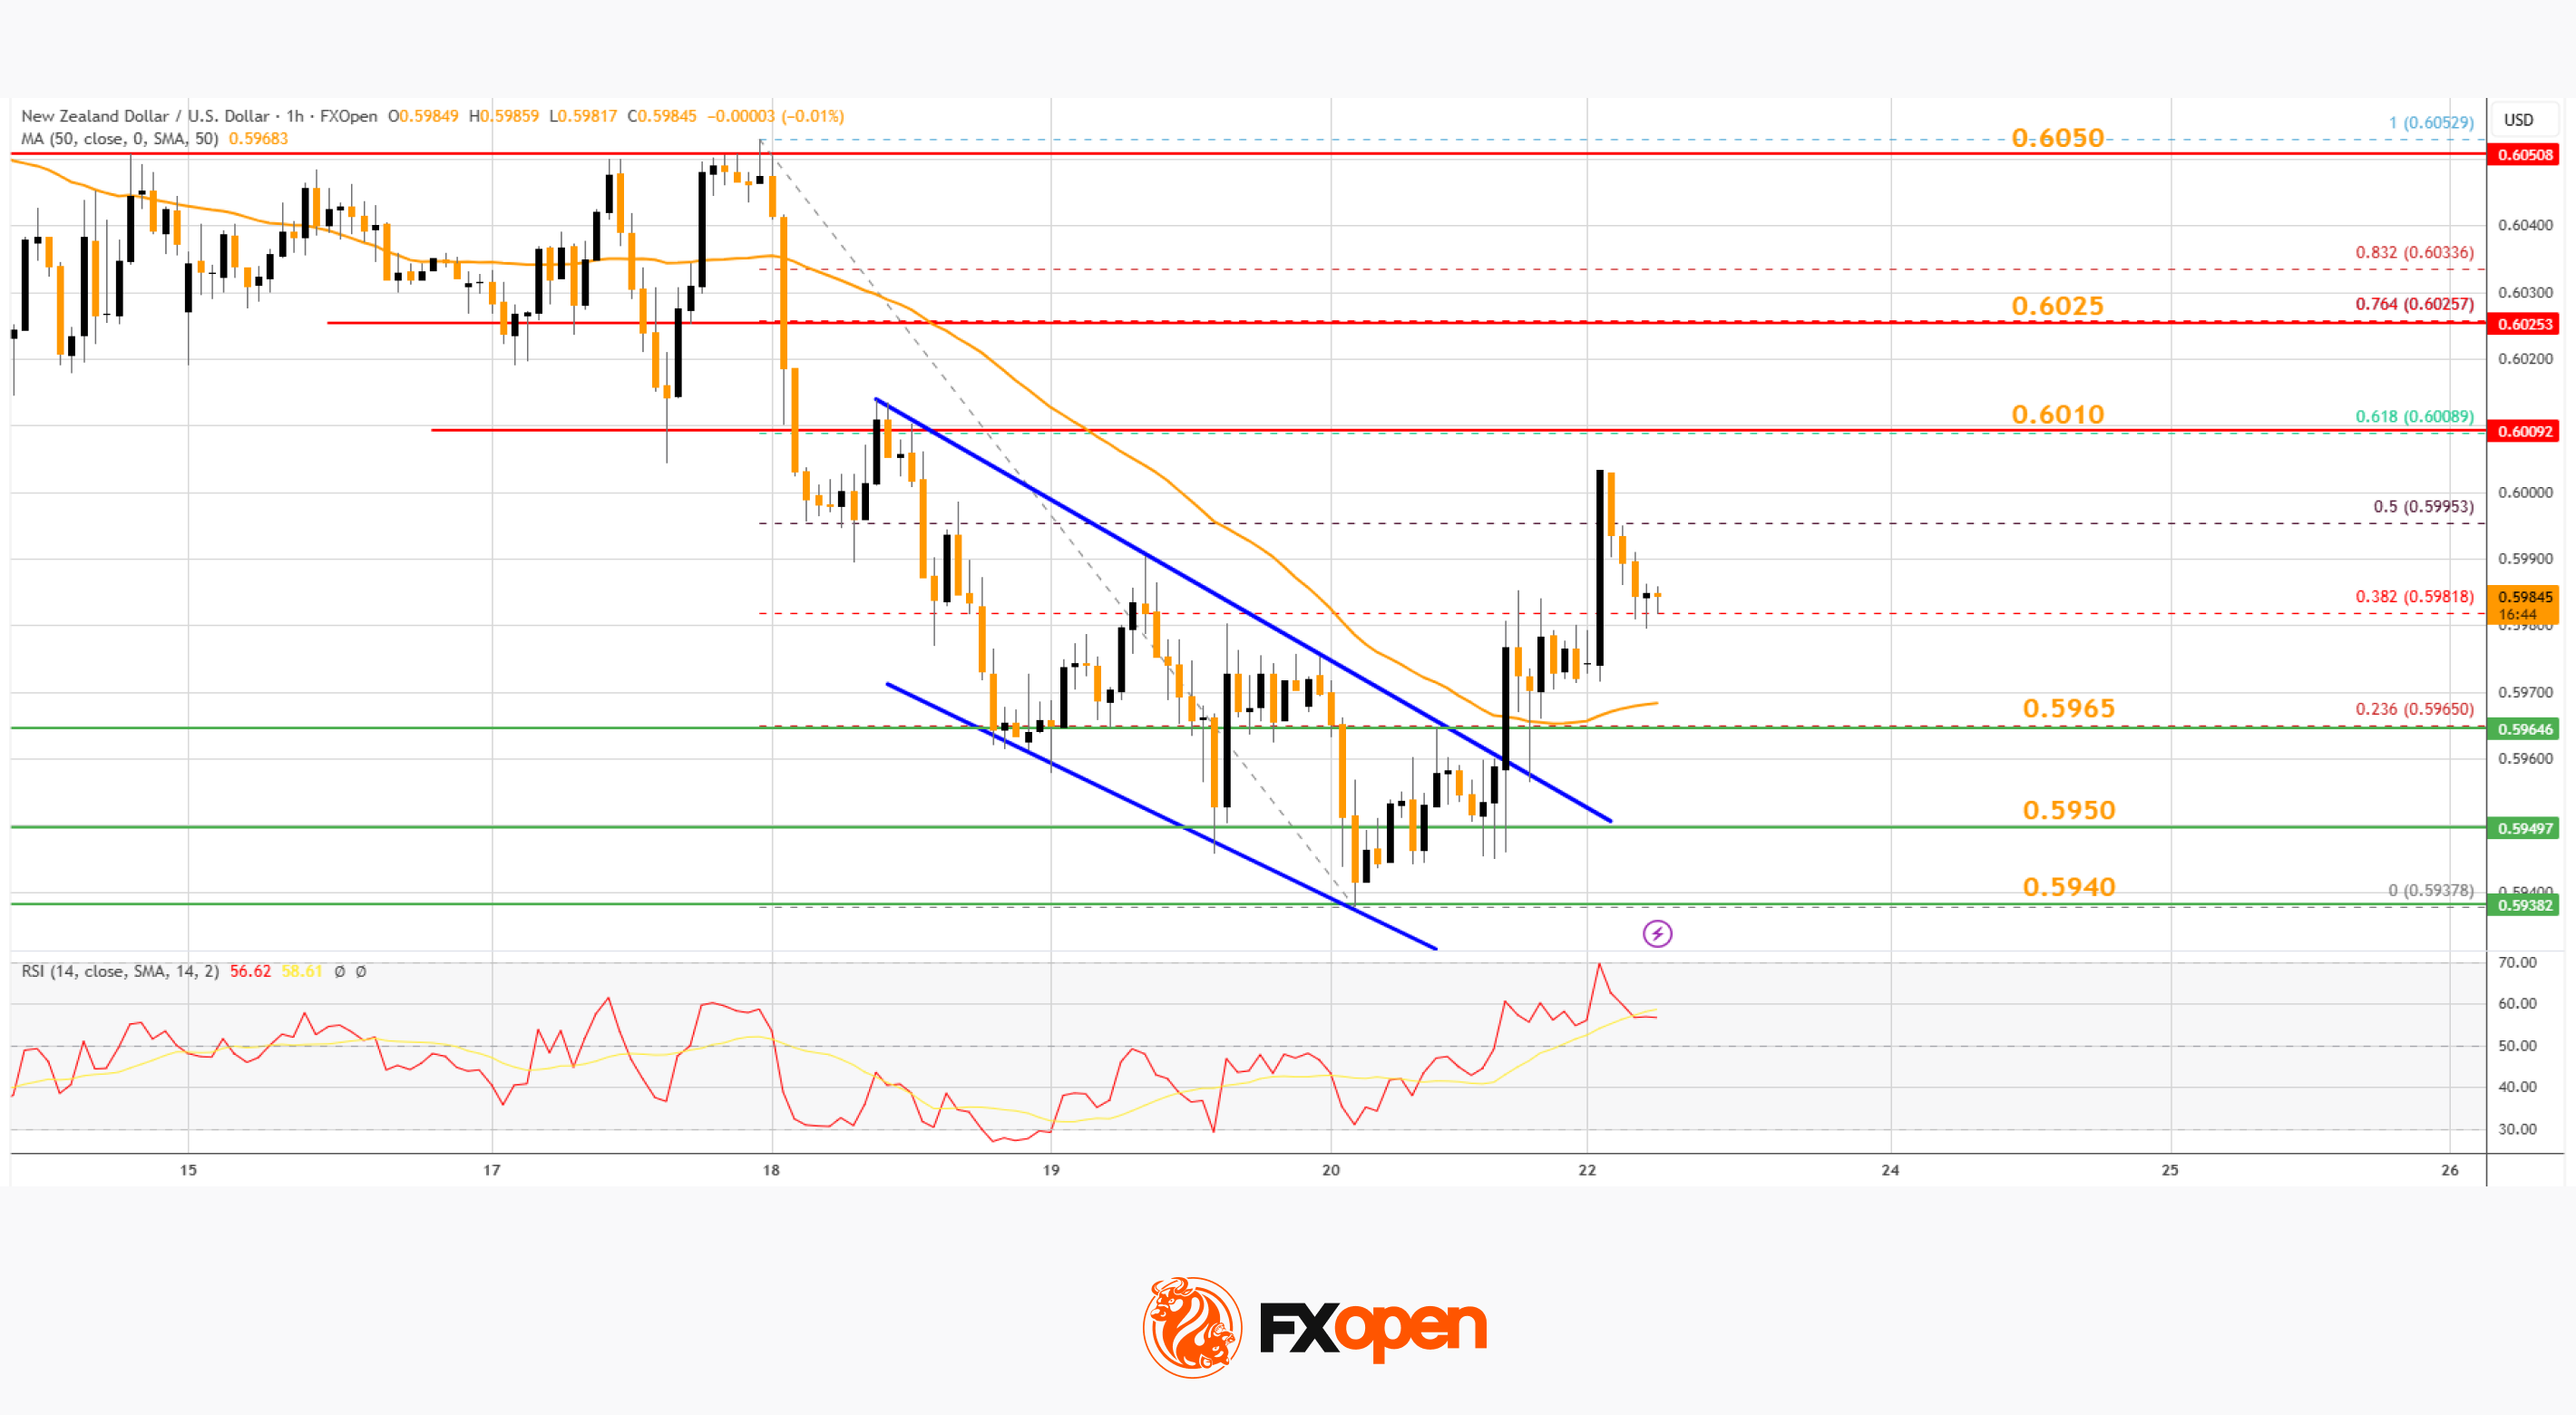
Besides, there was a break above a declining channel with resistance at 0.5960. The NZD/USD chart suggests that the RSI is above 50, signaling a short-term positive bias. On the upside, the pair is facing resistance near 0.6010.
The next major hurdle for buyers could be near the 76.4% Fib retracement at 0.6025. A clear move above 0.6025 might even push the pair toward 0.6050. Any more gains might clear the path for a move toward the 0.6122 pivot zone in the coming sessions.
On the downside, there is support forming near 0.5965 and the 50-hour simple moving average. If there is a downside break below 0.5965, the pair might slide toward 0.5940. Any more losses could lead NZD/USD into a bearish zone to 0.5900.
Trade over 50 forex markets 24 hours a day with FXOpen. Take advantage of low commissions, deep liquidity, and spreads from 0.0 pips (additional fees may apply). Open your FXOpen account now or learn more about trading forex with FXOpen.
This article represents the opinion of the Companies operating under the FXOpen brand only. It is not to be construed as an offer, solicitation, or recommendation with respect to products and services provided by the Companies operating under the FXOpen brand, nor is it to be considered financial advice.
Stay ahead of the market!
Subscribe now to our mailing list and receive the latest market news and insights delivered directly to your inbox.


Latest articles

NVDA Shares Approach Key Resistance
Nvidia’s chip production is concentrated with Taiwanese contractor TSMC, increasing the company’s exposure to geopolitical risks and US export policy. Restrictions on shipments to China, including decisions related to H20-series chips, have led to significant financial adjustments, which

EUR/USD and GBP/USD at Range Boundaries Ahead of Geopolitical Decisions
European currencies are entering a consolidation phase following an attempted recovery, while market participants adopt a wait-and-see approach amid uncertainty surrounding the geopolitical landscape. Current price action reflects a balance between a softer US dollar and a lack of sustained

Market Analysis: Gold Price Slips Back, WTI Crude Oil Rally Gains Fresh Strength
Gold price rallied above $4,750 before correcting lower. Crude oil prices are rising and could climb further higher toward $110.00.
Important Takeaways for Gold and WTI Crude Oil Prices Analysis Today
· Gold price gained pace for a move