


Market Analysis: AUD/USD And NZD/USD Shift Bullish, Can Buyers Extend Gains?
FXOpen

AUD/USD started a fresh increase above 0.7175 and 0.7200. NZD/USD is also rising and might aim for more gains above 0.5950.
Important Takeaways for AUD USD and NZD USD Analysis Today
· The Aussie Dollar started a steady increase above 0.7150 against the US Dollar.
· There was a break above a bearish trend line with resistance at 0.7190 on the hourly chart of AUD/USD at FXOpen.
· NZD/USD is consolidating gains above the 0.5925 pivot zone.
· There was a break above a bearish trend line with resistance at 0.5900 on the hourly chart of NZD/USD at FXOpen.
AUD/USD Technical Analysis
On the hourly chart of AUD/USD at FXOpen, the pair started a fresh increase from 0.7100. The Aussie Dollar was able to clear 0.7100 to move into a positive zone against the US Dollar.
There was a break above a bearish trend line with resistance at 0.7190. There was a close above 0.7200 and the 50-hour simple moving average. Finally, the pair tested 0.7245. A high was formed near 0.7245 and the pair remains elevated for more gains.
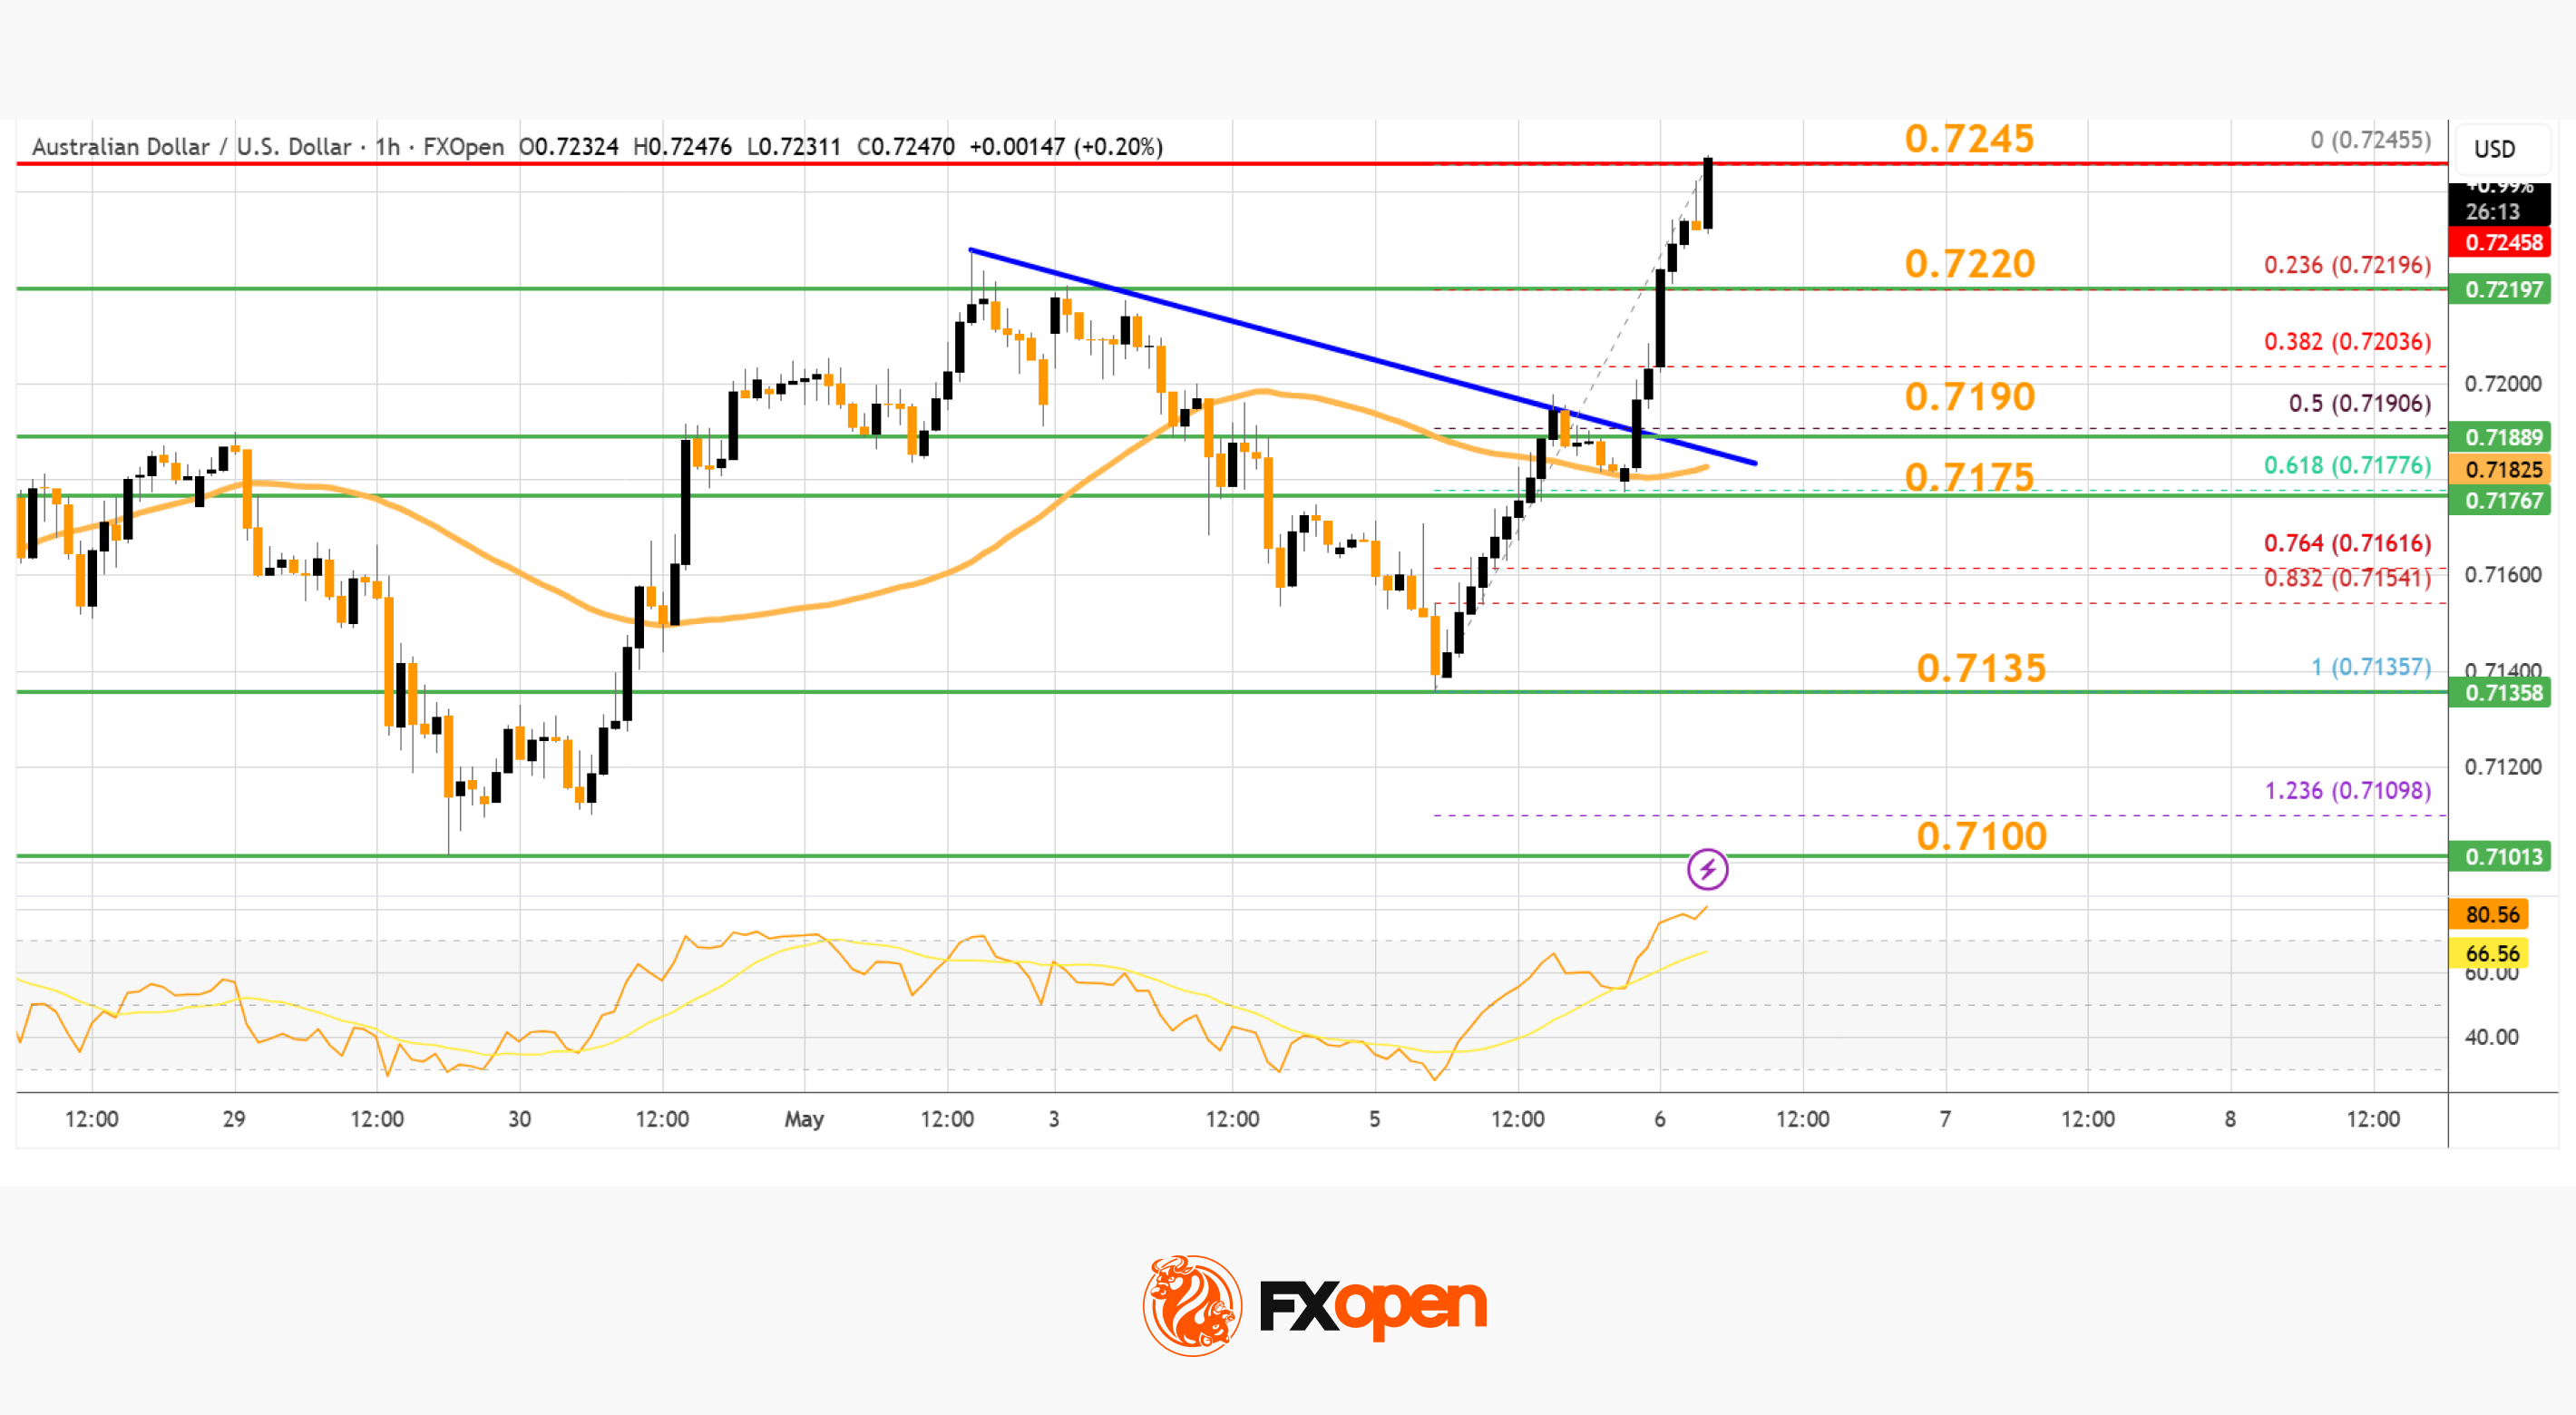
On the downside, initial support is near the 23.6% Fib retracement level of the upward move from the 0.7135 swing low to the 0.7245 high at 0.7220. The next area of interest could be near 0.7190 and the 50% Fib retracement.
If there is a downside break below 0.7190, the pair could extend its decline toward the 0.7175 zone and the 50-hour simple moving average. Any more losses might signal a move toward 0.7135.
On the upside, the AUD/USD chart indicates that the pair is now facing resistance near 0.7245. The first major hurdle for the bulls might be 0.7260. An upside break above 0.7260 might send the pair further higher. The next stop is near 0.7320. Any more gains could clear the path for a move toward 0.7350.
NZD/USD Technical Analysis
On the hourly chart of NZD/USD on FXOpen, the pair started a fresh increase from 0.5855. The New Zealand Dollar broke the 0.5875 barrier to start the recent rally against the US Dollar.
More importantly, there was a break above a bearish trend line with resistance at 0.5900. The pair settled above 0.5925 and the 50-hour simple moving average.
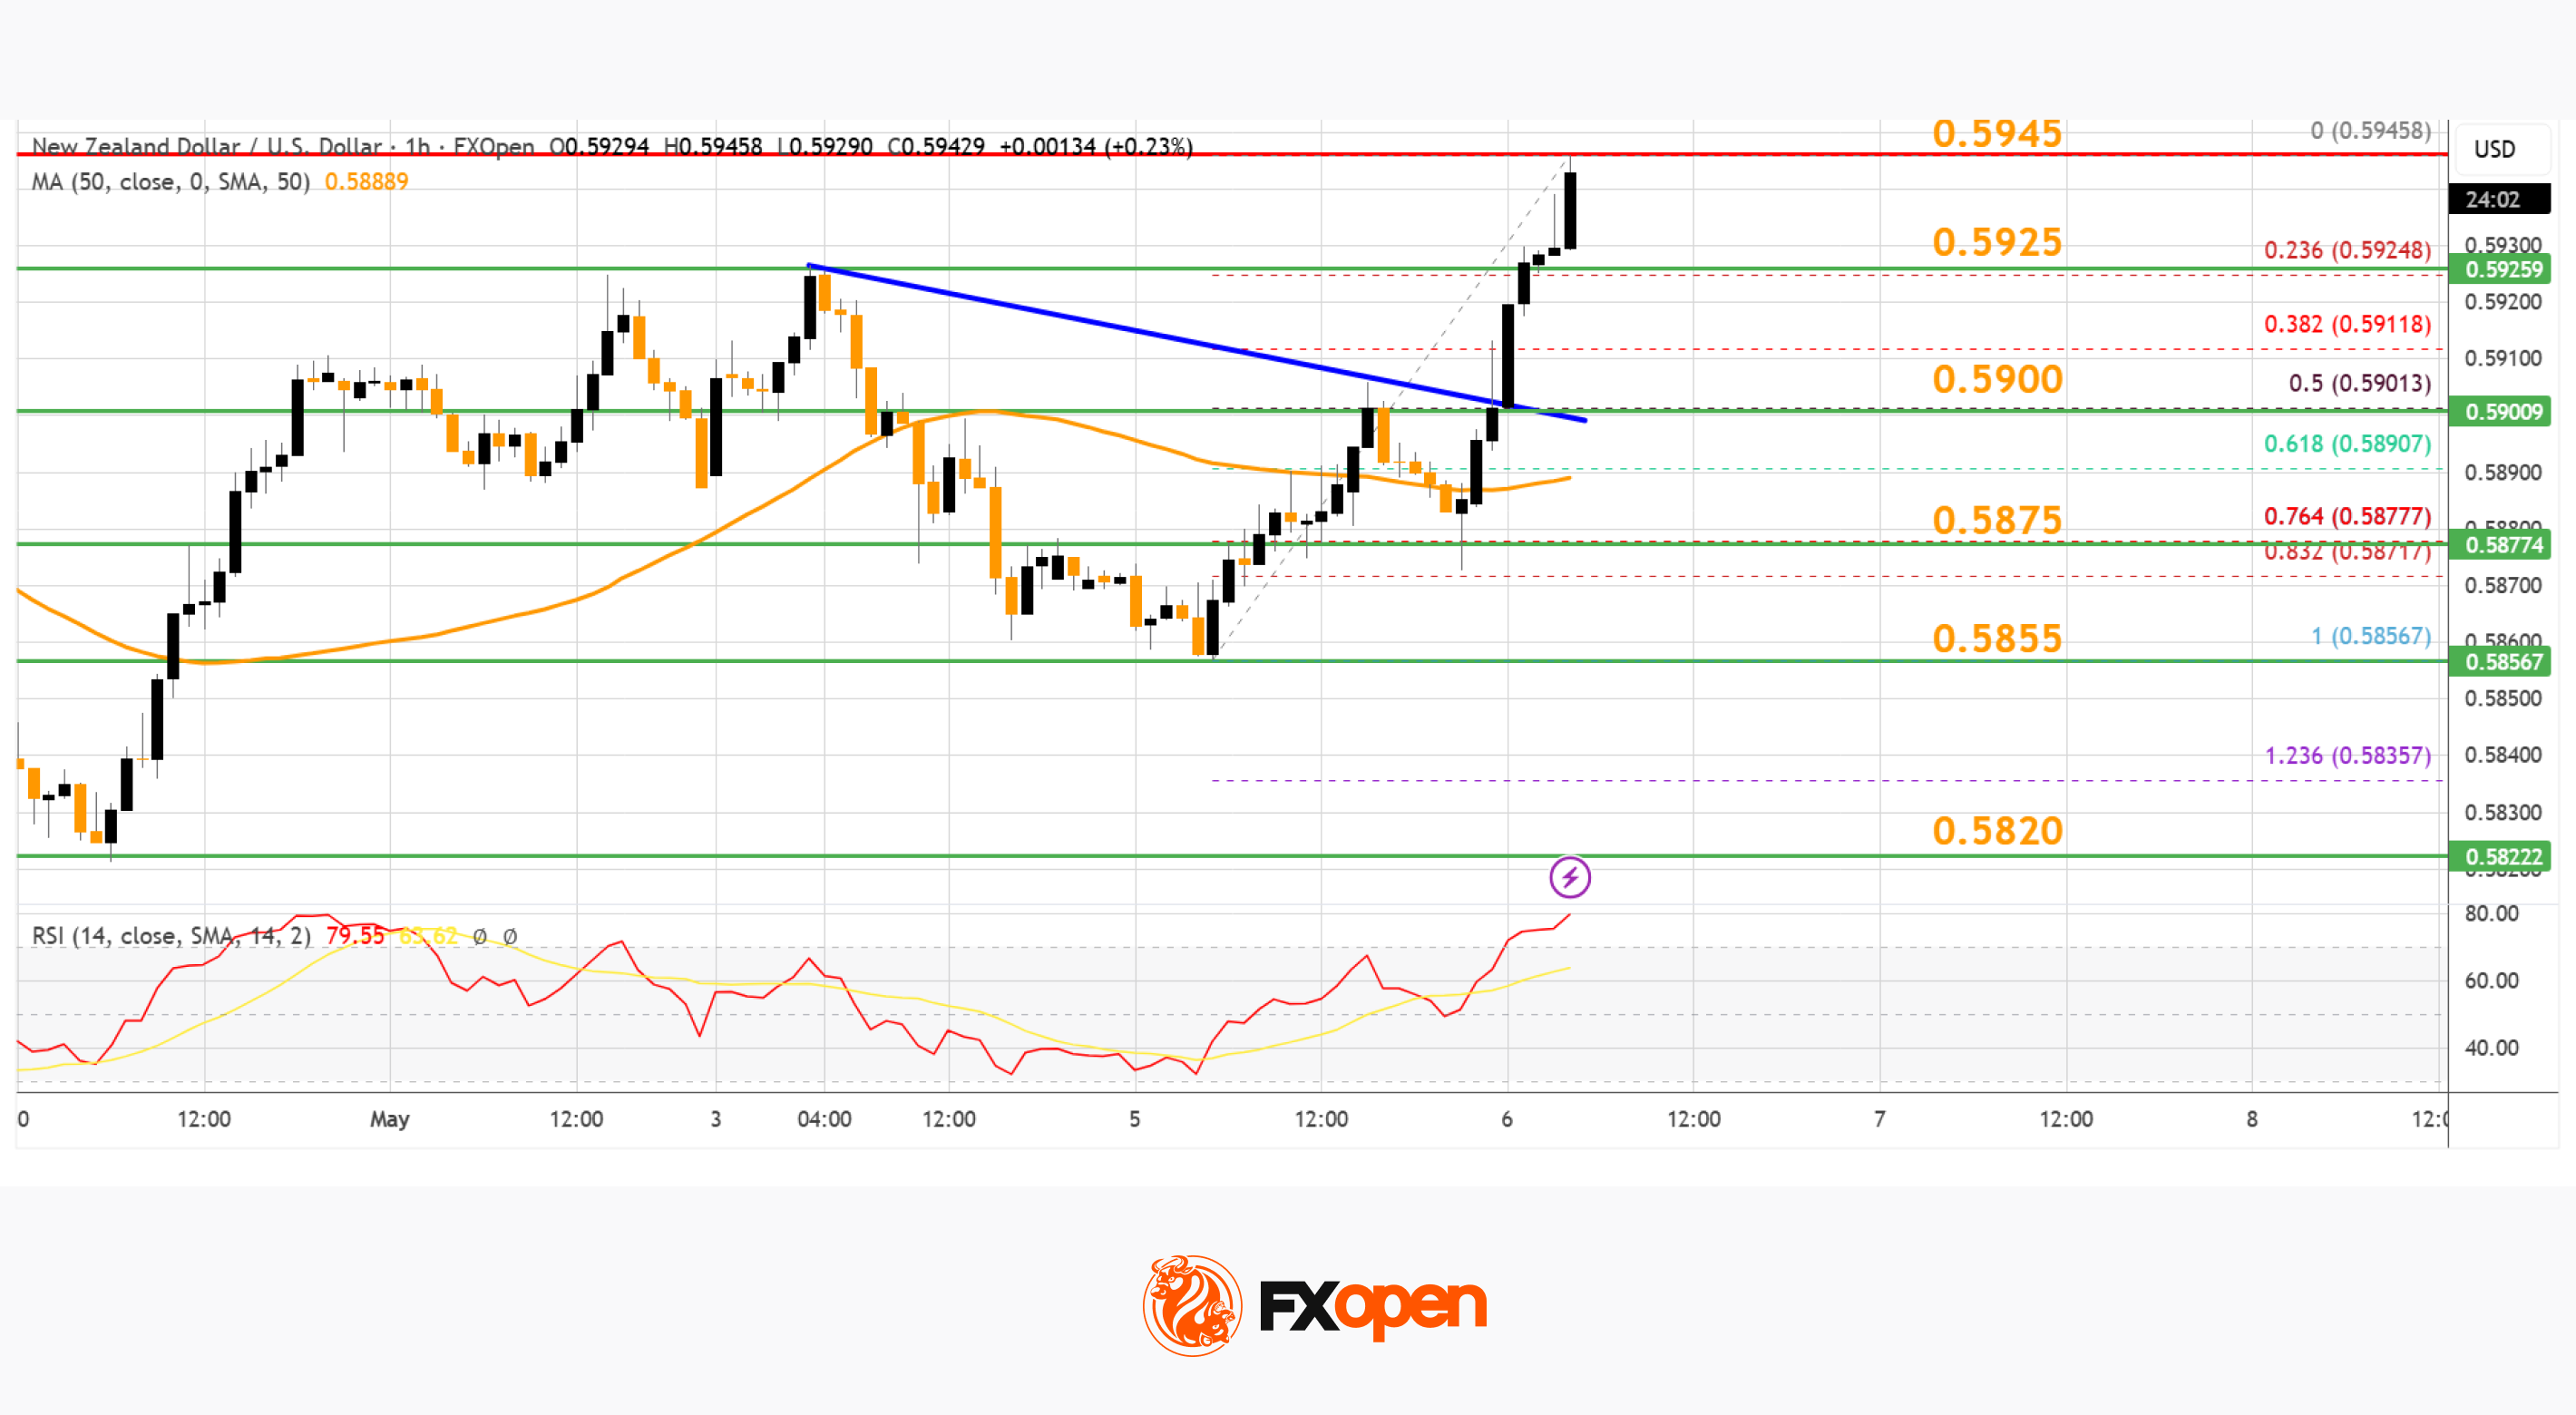
It tested 0.5945 and is currently showing signs of more gains. The NZD/USD chart suggests that the RSI is now just above 70. On the upside, the pair might struggle near 0.5945. The next major hurdle is near the 0.6000 pivot level.
A clear move above 0.6000 might even push the pair toward 0.6050. Any more gains might clear the path for a move toward the 0.6140 zone in the coming days.
On the downside, immediate support is near the 0.5925 level and the 23.6% Fib retracement level of the upward move from the 0.5856 swing low to the 0.5945 high.
The first key zone for the bulls sits at 0.5900 and the 50% Fib retracement. The next important level is 0.5875 and or 50-hour simple moving average. If there is a downside break below 0.5875, the pair might slide toward 0.5855. Any more losses could lead NZD/USD into a bearish zone to 0.5820.
Trade over 50 forex markets 24 hours a day with FXOpen. Take advantage of low commissions, deep liquidity, and spreads from 0.0 pips (additional fees may apply). Open your FXOpen account now or learn more about trading forex with FXOpen.
This article represents the opinion of the Companies operating under the FXOpen brand only. It is not to be construed as an offer, solicitation, or recommendation with respect to products and services provided by the Companies operating under the FXOpen brand, nor is it to be considered financial advice.
Stay ahead of the market!
Subscribe now to our mailing list and receive the latest market news and insights delivered directly to your inbox.


Latest articles

CAD/JPY: The Yen's Most Historic Move in 30 Years Meets a Fragile Support
Two central banks are heading in genuinely opposite directions this week, and the tension is unmistakable. The Bank of Canada held rates steady at 2.25% on September 2, with a mildly hawkish tilt as policymakers acknowledged a broadening economic

USD/JPY and USD/CAD Await Key Fed Decision
The US dollar is consolidating against the yen and Canadian dollar ahead of the key event of the week — the Federal Reserve meeting. The Fed is widely expected to raise its policy rate by 25 basis points to a range

UnitedHealth: Fundamentals Are Healing, Now the Chart Must Agree
UnitedHealth finds itself in a genuinely split narrative right now, trading near $388, down about 15.9% from its 52-week high, even as the fundamental picture keeps improving. Q2 earnings beat expectations, with revenue of $112.03 billion, and the