


CAD/JPY: The Yen's Most Historic Move in 30 Years Meets a Fragile Support
FXOpen

Two central banks are heading in genuinely opposite directions this week, and the tension is unmistakable. The Bank of Canada held rates steady at 2.25% on September 2, with a mildly hawkish tilt as policymakers acknowledged a broadening economic recovery alongside rising inflation risks. Since then, Canadian data has stayed firm, August CPI held at 3.0% year-on-year, and elevated oil prices, boosted by Middle East tensions, continue to provide the loonie with structural support given Canada's status as a major crude exporter.
The yen, meanwhile, is the real story of the week. The Bank of Japan is widely expected to hike its policy rate to 1.25% on Friday, its highest level since April 1995, after Treasury Secretary Scott Bessent's public pressure campaign pushed markets to price in an 80% probability of the move. The yen has already surged to seven-month highs in anticipation, with August export data beating forecasts on strong AI-chip demand, even as Bloomberg warns the scale of tightening now expected risks disrupting markets should the BOJ fail to deliver.
The result: a resilient, oil-backed loonie facing off against a yen riding its most significant policy shift in three decades, leaving CAD/JPY's next move to hinge almost entirely on Friday's BOJ decision.
Technical Analysis of CAD/JPY
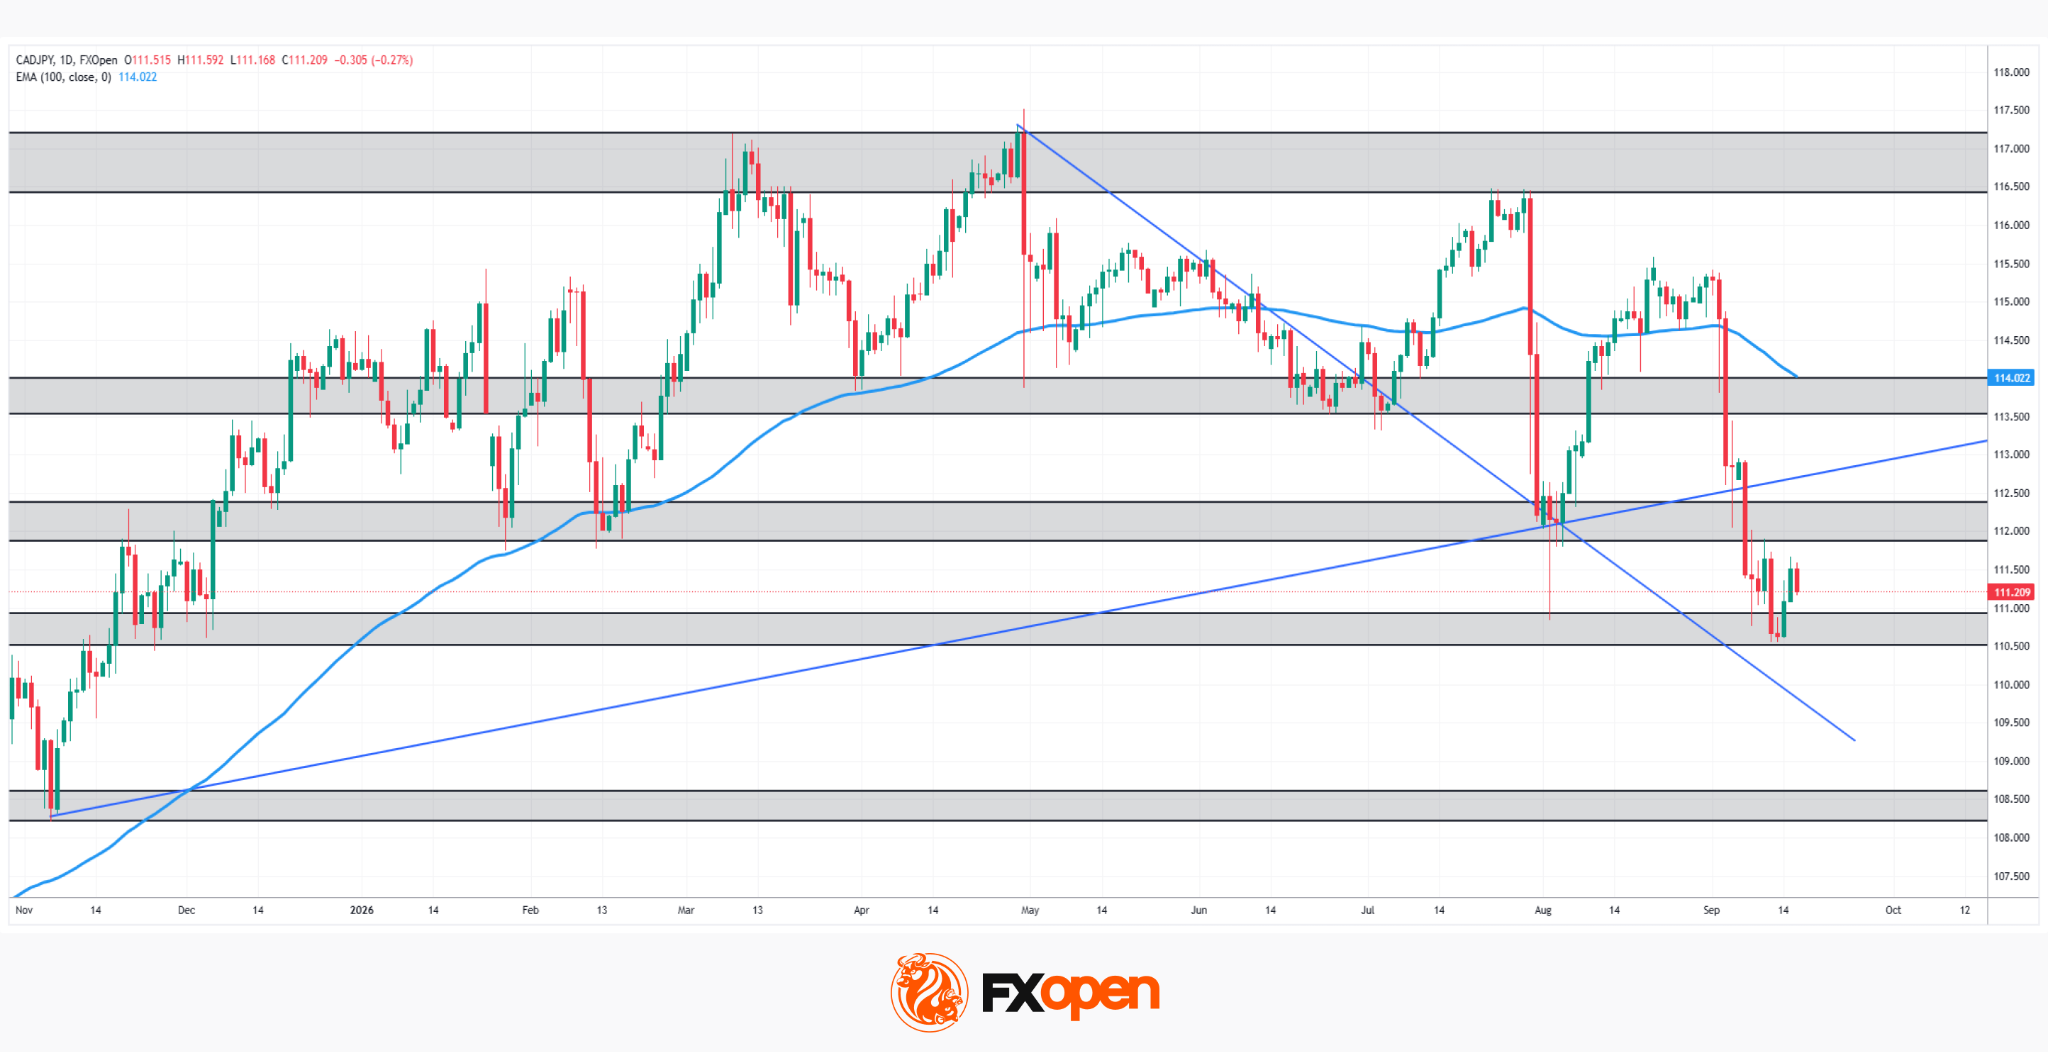
As the CAD/JPY daily chart shows, the pair has broken below its long-term ascending trendline from last November's lows, with price now trading well below the 100-period EMA at 114.02, inside the 110.50–112.00 support zone that has held since early August. The descending trendline from May's highs near 117.50 now sits below current price, positioning it as a potential support level should the pair extend lower.
Bullish Scenario
Should buyers defend the 110.50–111.00 support and stage a recovery, the first real test becomes the 112.00–112.50 resistance zone, with a stronger push potentially reaching the 113.50–113.75 area, where the broken long-term ascending trendline and the 100-period EMA converge.
Bearish Scenario
Conversely, a break below the 110.50–111.00 support would bring the descending trendline from May's highs into play as a possible support level, with a confirmed break below that also exposing the 108.00–108.50 zone, the level that anchored the entire late-2025 recovery.
With price trading beneath both its EMA and its former long-term uptrend, and the old descending trendline now positioned as potential support below, CAD/JPY's next move looks set to hinge on Friday's BOJ decision. Will the yen's historic tightening push the pair into fresh multi-month lows, or does support finally hold?
Trade over 50 forex markets 24 hours a day with FXOpen. Take advantage of low commissions, deep liquidity, and spreads from 0.0 pips (additional fees may apply). Open your FXOpen account now or learn more about trading forex with FXOpen.
This article represents the opinion of the Companies operating under the FXOpen brand only. It is not to be construed as an offer, solicitation, or recommendation with respect to products and services provided by the Companies operating under the FXOpen brand, nor is it to be considered financial advice.
Stay ahead of the market!
Subscribe now to our mailing list and receive the latest market news and insights delivered directly to your inbox.


Latest articles

USD/JPY and USD/CAD Await Key Fed Decision
The US dollar is consolidating against the yen and Canadian dollar ahead of the key event of the week — the Federal Reserve meeting. The Fed is widely expected to raise its policy rate by 25 basis points to a range

UnitedHealth: Fundamentals Are Healing, Now the Chart Must Agree
UnitedHealth finds itself in a genuinely split narrative right now, trading near $388, down about 15.9% from its 52-week high, even as the fundamental picture keeps improving. Q2 earnings beat expectations, with revenue of $112.03 billion, and the

NVIDIA Analysis: Attempted Rising Wedge Breakout Amid Pressure on the AI Sector
Nvidia’s short-term fundamental backdrop has deteriorated. On 14 September, the company’s shares fell 3.4% amid a sell-off in AI-related stocks driven by concerns over a potential slowdown in the pace of artificial intelligence development. However, Nvidia’s