


UnitedHealth: Fundamentals Are Healing, Now the Chart Must Agree
FXOpen

UnitedHealth finds itself in a genuinely split narrative right now, trading near $388, down about 15.9% from its 52-week high, even as the fundamental picture keeps improving. Q2 earnings beat expectations, with revenue of $112.03 billion, and the company followed through with a significant policy shift: lifting prior-authorization requirements on roughly 1,700 diagnostic codes starting October 1, a move that could meaningfully ease administrative friction with providers and support margins going forward.
Wall Street's conviction has only grown stronger as a result. Wells Fargo and Bernstein both reaffirmed Buy ratings this month, with price targets near $526 and $512 respectively, while the broader consensus, a Moderate Buy across 27 analysts, points to an average target of $456.56, implying roughly 17% upside from current levels.
The stock has nonetheless struggled to find sustained momentum, weighed down by lingering concerns over Medicare Advantage margin recovery and, more recently, the shock of losing a senior executive, an event that has triggered internal restructuring and closer scrutiny of governance and security practices.
The result: a company delivering genuinely solid operational improvement, but one whose stock price has yet to fully reflect it.
Technical Analysis of UnitedHealth
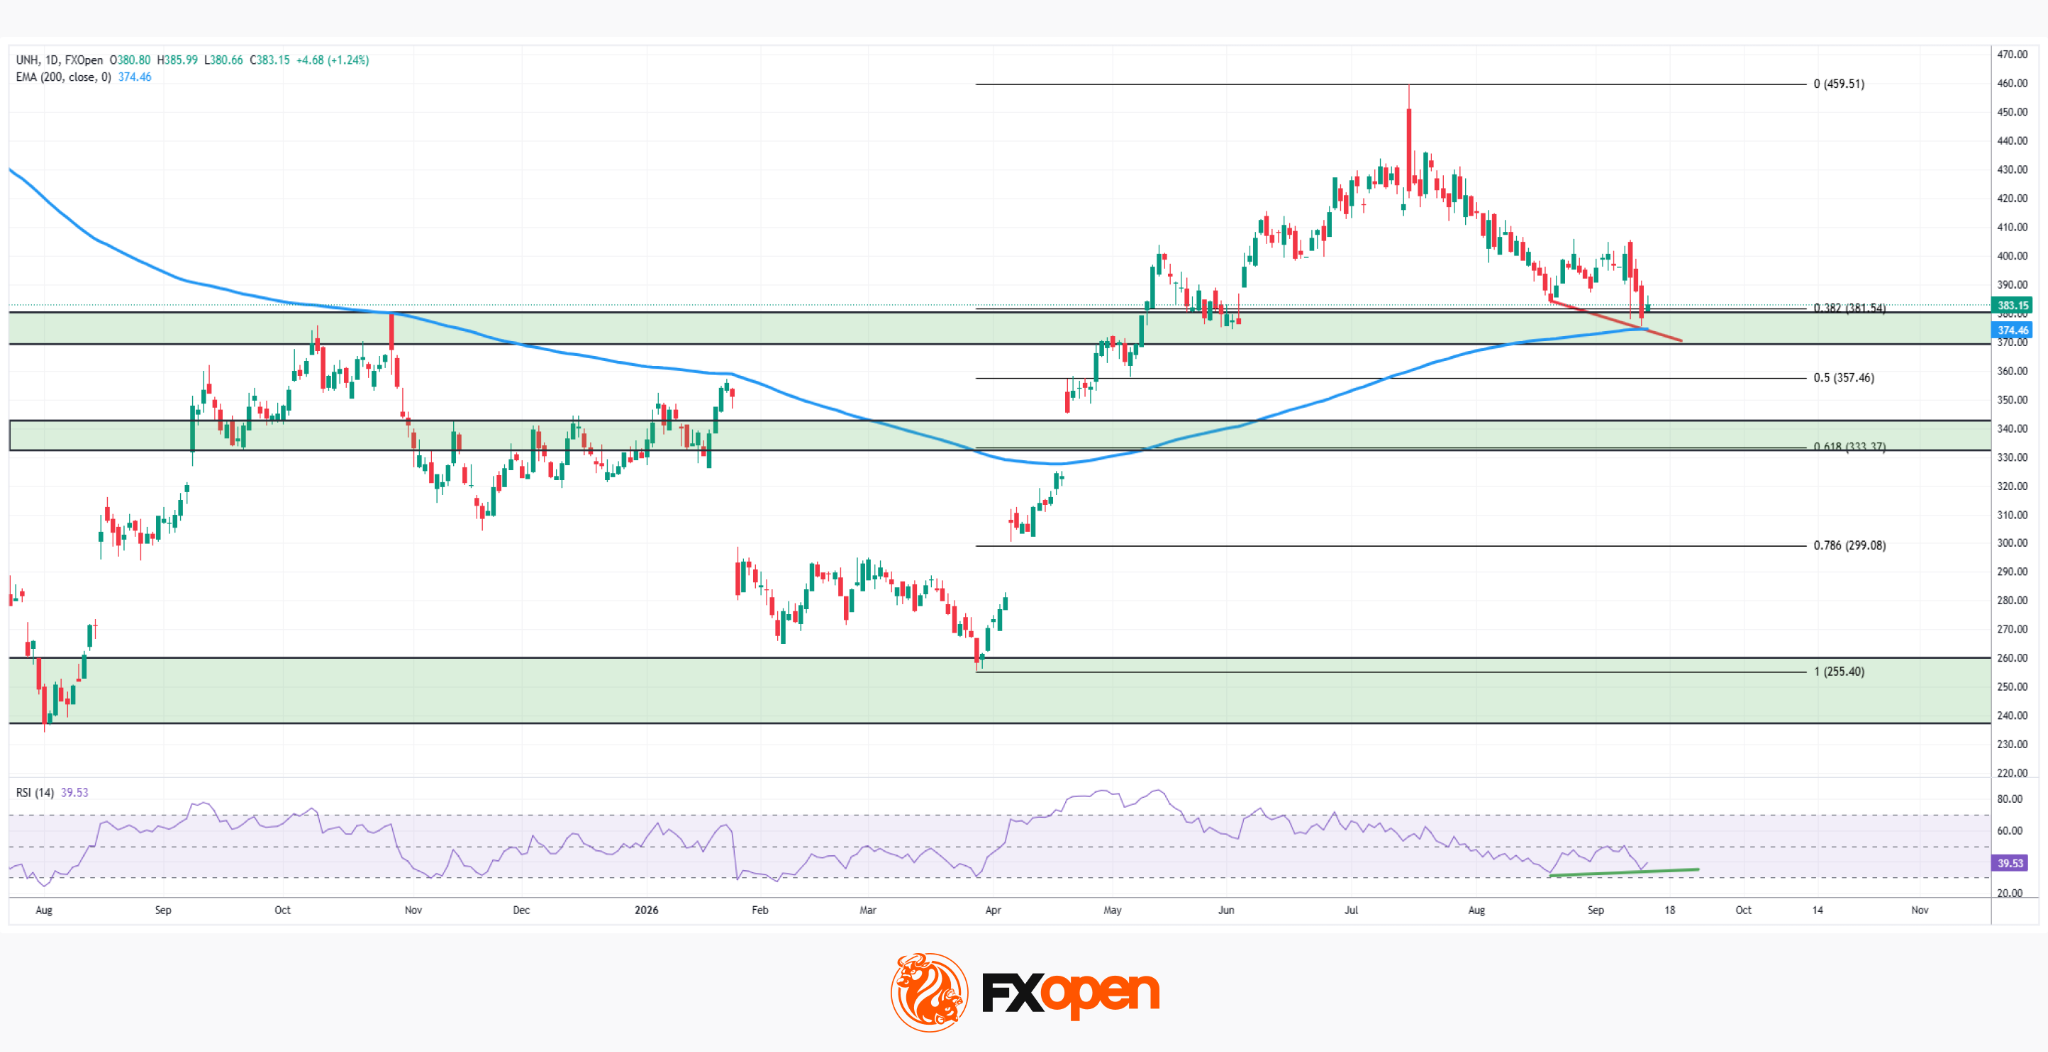
As the UNH daily chart shows, the stock remains in a broader downtrend from July's highs near $459.51, currently testing a critical confluence near $374–383, where the 0.382 Fibonacci retracement and the 200-period EMA all converge. Adding intrigue to the setup, the RSI is forming a bullish divergence, printing higher highs even as price carved a fresh low in recent sessions.
Bullish Scenario
Should buyers break above this EMA-Fibonacci confluence, the divergence would gain real technical credibility, opening the path towards a retest of the broader downtrend structure and potentially challenging the $450–$460 area, where the stock has its recent high in July.
Bearish Scenario
Conversely, a rejection at this confluence would keep sellers in control, invalidating the divergence and exposing the 0.5 retracement near $357.46, with a deeper slide risking a retest of the 0.618 level around $333.37, the support zone that held throughout last autumn and winter.
With price testing a stubborn multi-factor confluence while the RSI quietly hints at fading downside momentum, UnitedHealth's next move looks set to determine whether the fundamental recovery story finally gains technical confirmation, or whether the broader downtrend still has room to run.
Buy and sell stocks of the world's biggest publicly-listed companies with CFDs on FXOpen’s trading platform. Open your FXOpen account now or learn more about trading share CFDs with FXOpen.
This article represents the opinion of the Companies operating under the FXOpen brand only. It is not to be construed as an offer, solicitation, or recommendation with respect to products and services provided by the Companies operating under the FXOpen brand, nor is it to be considered financial advice.
Stay ahead of the market!
Subscribe now to our mailing list and receive the latest market news and insights delivered directly to your inbox.


Latest articles

CAD/JPY: The Yen's Most Historic Move in 30 Years Meets a Fragile Support
Two central banks are heading in genuinely opposite directions this week, and the tension is unmistakable. The Bank of Canada held rates steady at 2.25% on September 2, with a mildly hawkish tilt as policymakers acknowledged a broadening economic

USD/JPY and USD/CAD Await Key Fed Decision
The US dollar is consolidating against the yen and Canadian dollar ahead of the key event of the week — the Federal Reserve meeting. The Fed is widely expected to raise its policy rate by 25 basis points to a range
NVIDIA Analysis: Attempted Rising Wedge Breakout Amid Pressure on the AI Sector
Nvidia’s short-term fundamental backdrop has deteriorated. On 14 September, the company’s shares fell 3.4% amid a sell-off in AI-related stocks driven by concerns over a potential slowdown in the pace of artificial intelligence development. However, Nvidia’s