


Market Analysis: AUD/USD and NZD/USD Sink Further
FXOpen

AUD/USD declined below the 0.6400 and 0.6375 support levels. NZD/USD is also moving lower and might extend losses below 0.57350.
Important Takeaways for AUD/USD and NZD/USD Analysis Today
- The Aussie Dollar started a fresh decline from well above the 0.6400 level against the US Dollar.
- There is a connecting bearish trend line forming with resistance at 0.6340 on the hourly chart of AUD/USD at FXOpen.
- NZD/USD declined steadily from the 0.5790 resistance zone.
- There is a short-term bearish trend line forming with resistance at 0.5750 on the hourly chart of NZD/USD at FXOpen.
AUD/USD Technical Analysis
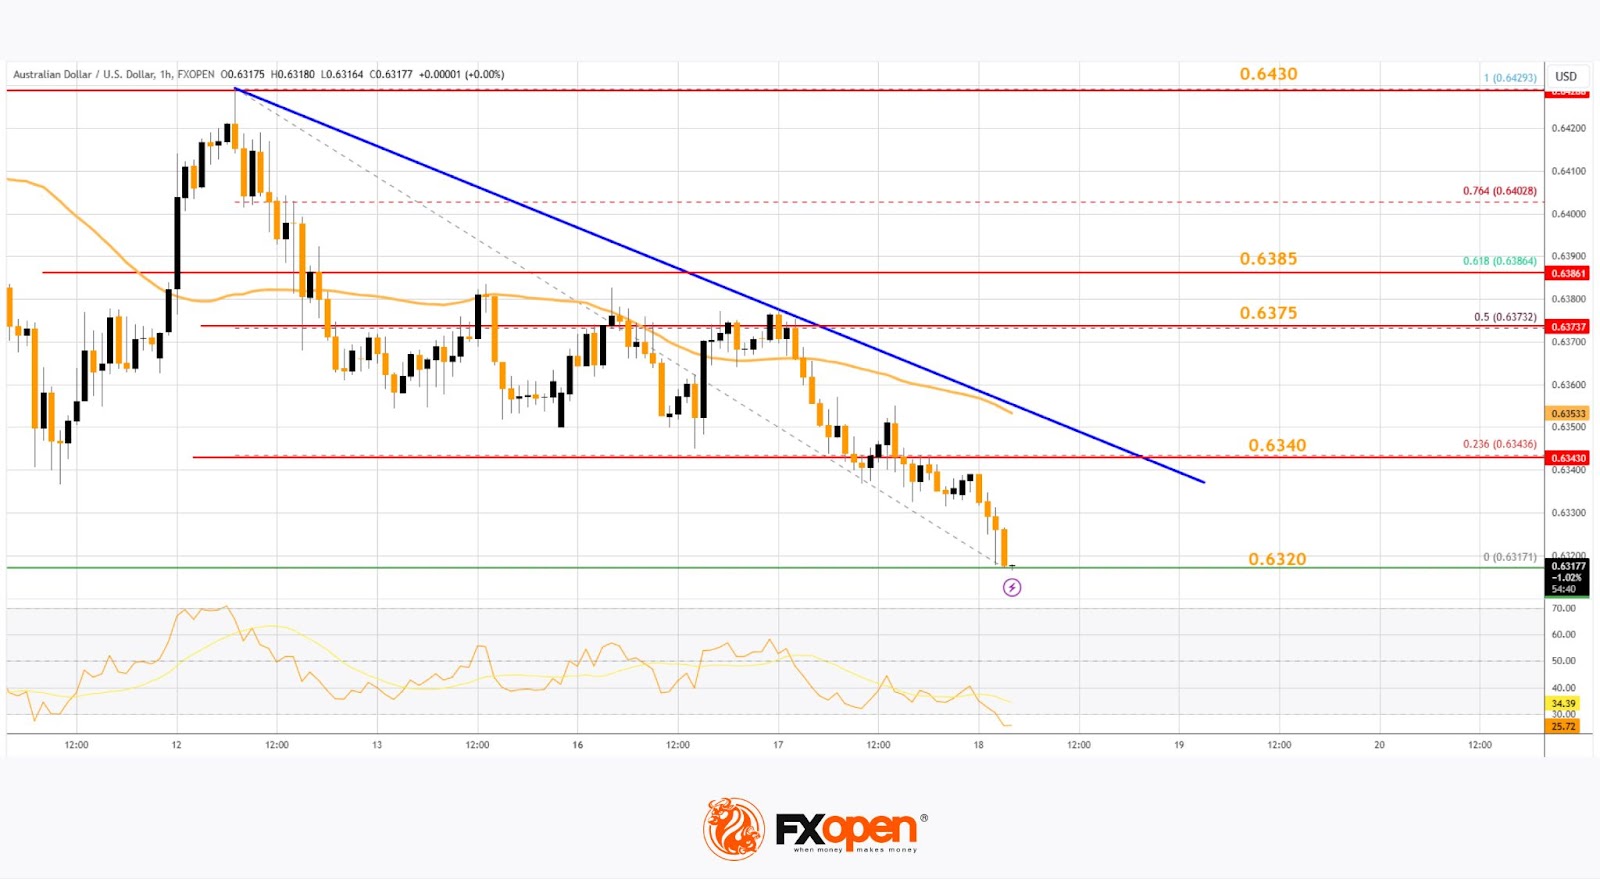
On the hourly chart of AUD/USD at FXOpen, the pair struggled to clear the 0.6430 zone. The Aussie Dollar started a fresh decline below the 0.6400 support against the US Dollar, as discussed in the previous analysis.
The pair even settled below 0.6375 and the 50-hour simple moving average. There was a clear move below 0.6340. A low was formed at 0.6317 and the pair is now consolidating losses. On the upside, an immediate resistance is near the 0.6340 level.
There is also a connecting bearish trend line forming with resistance at 0.6340. It is close to the 23.6% Fib retracement level of the downward move from the 0.6429 swing high to the 0.6317 low.
The next major resistance is near the 0.6375 zone or the 50% Fib retracement level of the downward move from the 0.6429 swing high to the 0.6317 low, above which the price could rise toward 0.6385. Any more gains might send the pair toward the 0.6430 resistance.
A close above the 0.6430 level could start another steady increase in the near term. The next major resistance on the AUD/USD chart could be 0.6500.
On the downside, initial support is near the 0.6320 zone. The next support sits at 0.6350. If there is a downside break below 0.6350, the pair could extend its decline. The next support could be 0.6320. Any more losses might send the pair toward the 0.6300 support.
NZD/USD Technical Analysis
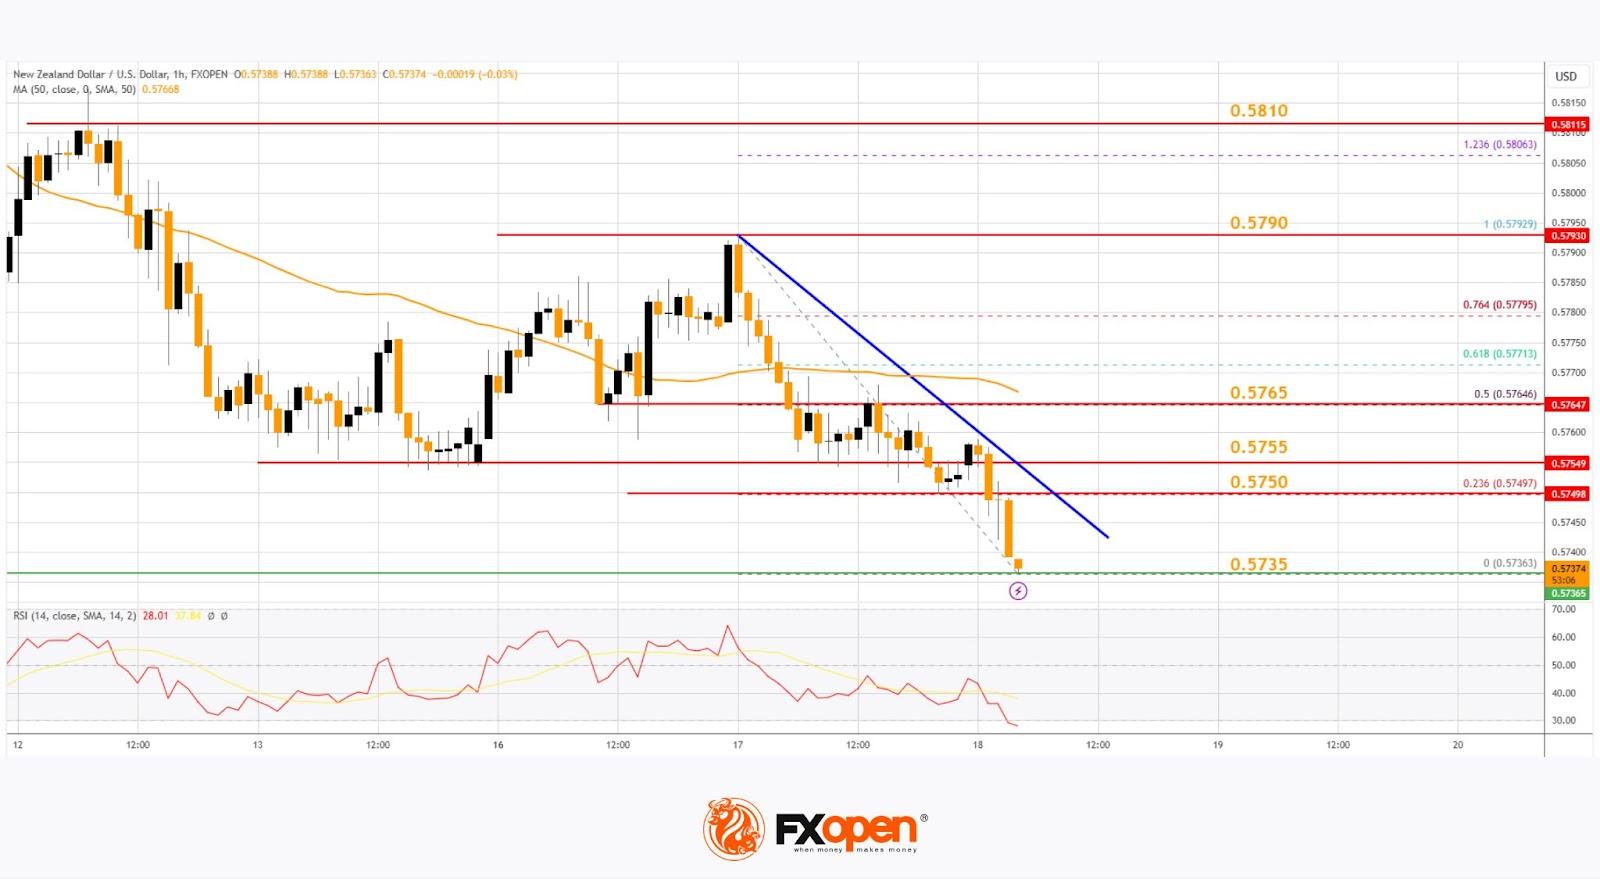
On the hourly chart of NZD/USD on FXOpen, the pair also followed a similar pattern and declined from the 0.5790 zone. The New Zealand Dollar gained bearish momentum and traded below 0.5765 against the US Dollar.
The pair settled below the 0.5755 level and the 50-hour simple moving average. Finally, it tested the 0.5735 zone and is currently consolidating losses.
Immediate resistance on the upside is near the 23.6% Fib retracement level of the downward move from the 0.5792 swing high to the 0.5736 low at 0.5750. There is also a short-term bearish trend line forming with resistance at 0.5750.
The next resistance is the 0.5765 level or the 50% Fib retracement level of the downward move from the 0.5792 swing high to the 0.5736 low. If there is a move above 0.5765, the pair could rise toward 0.5790.
Any more gains might open the doors for a move toward the 0.5810 resistance zone in the coming days. On the downside, immediate support on the NZD/USD chart is near the 0.5735 level.
The next major support is near the 0.5710 zone. If there is a downside break below 0.5710, the pair could extend its decline toward the 0.5665 level. The next key support is near 0.5640.
Trade over 50 forex markets 24 hours a day with FXOpen. Take advantage of low commissions, deep liquidity, and spreads from 0.0 pips (additional fees may apply). Open your FXOpen account now or learn more about trading forex with FXOpen.
This article represents the opinion of the Companies operating under the FXOpen brand only. It is not to be construed as an offer, solicitation, or recommendation with respect to products and services provided by the Companies operating under the FXOpen brand, nor is it to be considered financial advice.
Stay ahead of the market!
Subscribe now to our mailing list and receive the latest market news and insights delivered directly to your inbox.


Latest articles

Weekly Market Insights with Gary Thomson: US Inflation, UK GDP, Chair Warsh Testimony, and Earnings
In this video, we’ll explore the key economic events and market trends, shaping the financial landscape. Get ready for insights into financial markets to help you navigate the week ahead. Let’s dive in!
In this episode of Market

GBP/AUD Analysis: The Tug-of-War Begins
Oil is back in the driver's seat, and both the pound and the aussie are feeling its grip. The Bank of England held rates at 3.75% in June, but with UK inflation at 2.8% and crude oil climbing

Australian Dollar Holds Above the Current Market Profile
The minutes from the Reserve Bank of Australia's (RBA) June meeting, released on 30 June, suggested that policymakers are not yet ready to rule out further policy tightening. Board members noted persistent excess demand and broad-based inflationary pressures across the