


Market Analysis: AUD/USD and NZD/USD Target Additional Gains
FXOpen

AUD/USD is moving higher and might surge if it clears 0.6610. NZD/USD is also rising and could extend its increase above the 0.6110 resistance zone.
Important Takeaways for AUD USD and NZD USD Analysis Today
· The Aussie Dollar is attempting a fresh increase from the 0.6570 zone against the US Dollar.
· There is a key contracting triangle forming with resistance near 0.6595 on the hourly chart of AUD/USD at FXOpen.
· NZD/USD is showing positive signs above the 0.6100 support.
· There is a major bearish trend line forming with resistance near 0.6110 on the hourly chart of NZD/USD at FXOpen.
AUD/USD Technical Analysis
On the hourly chart of AUD/USD at FXOpen, the pair corrected lower but remained well-bid above the 0.6570 support. The Aussie Dollar is forming a base above 0.6570 and now attempting a fresh increase against the US Dollar, as discussed in the previous analysis.
The bulls pushed the pair above the 50% Fib retracement level of the downward move from the 0.6609 swing high to the 0.6570 low. There was a close above the 0.6590 resistance and the 50-hour simple moving average.
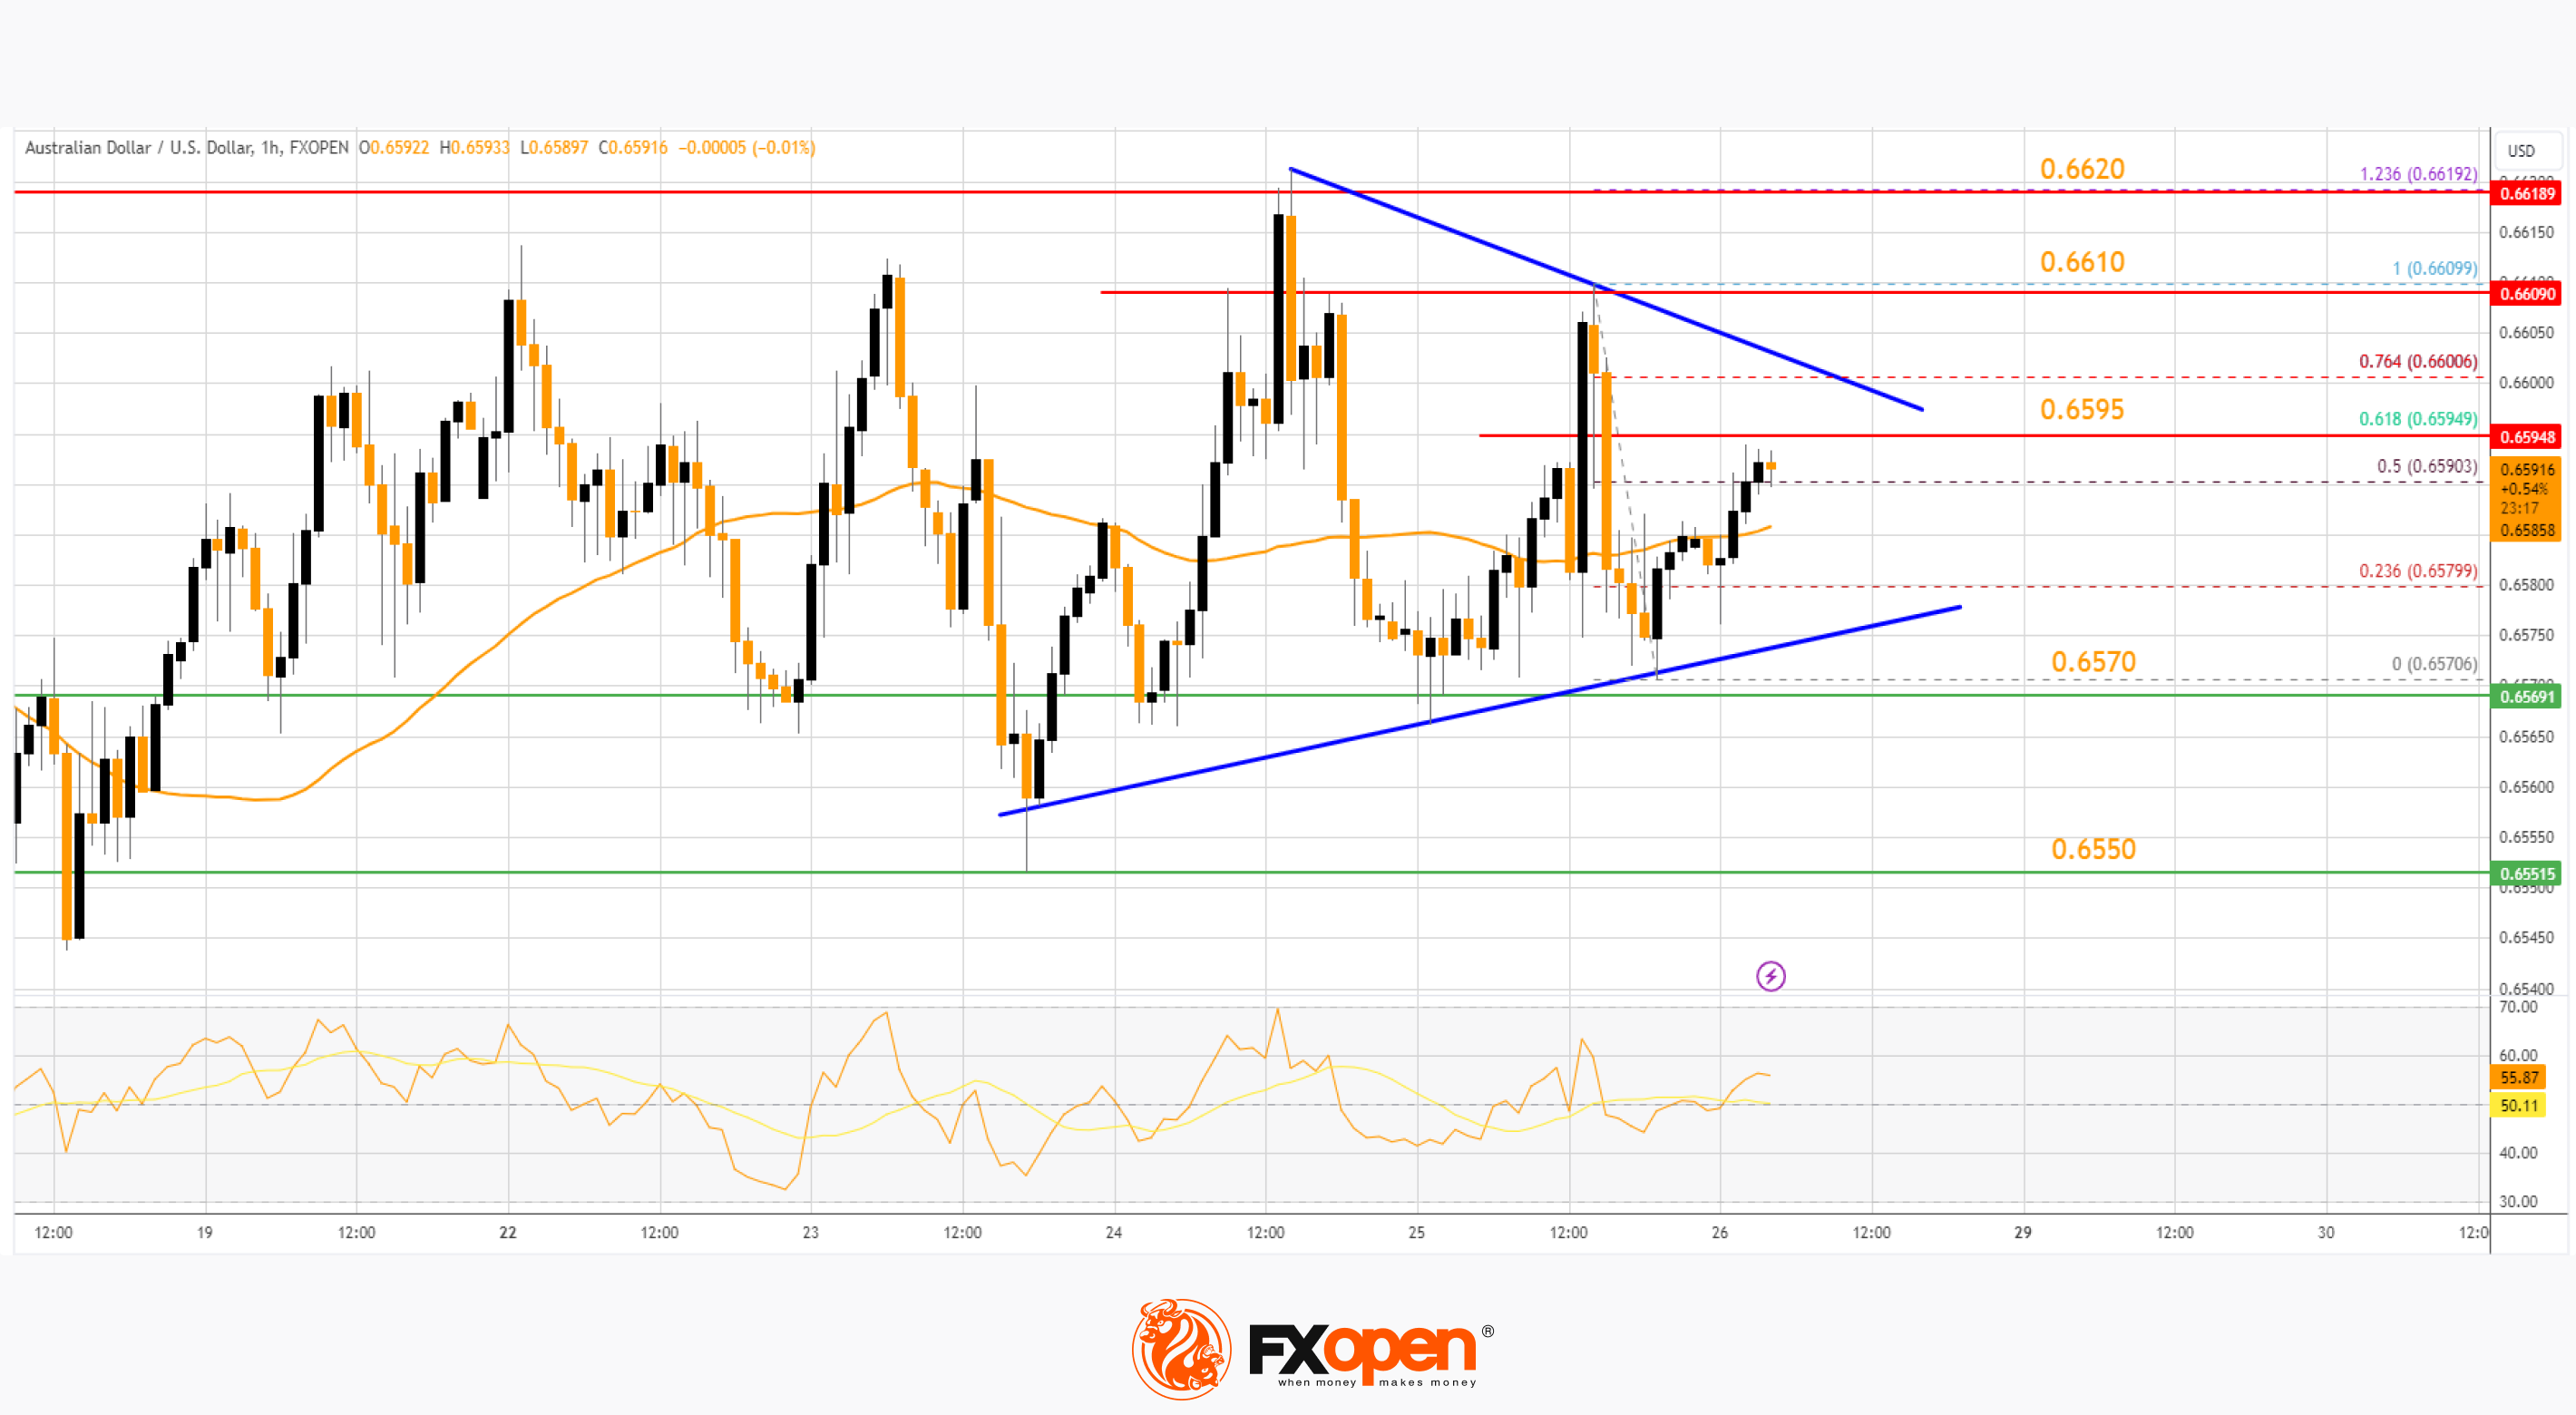
On the upside, the AUD/USD chart indicates that the pair is now facing resistance near a key contracting triangle at 0.6595. It is close to the 61.8% Fib retracement level of the downward move from the 0.6609 swing high to the 0.6570 low.
The first major resistance might be 0.6610. An upside break above the 0.6610 resistance might send the pair further higher. The next major resistance is near the 0.6650 level. Any more gains could clear the path for a move toward the 0.6720 resistance zone.
If not, the pair might correct lower below the 50-hour simple moving average at 0.6585. The next support could be 0.6570. If there is a downside break below the 0.6570 support, the pair could extend its decline toward the 0.6550 zone. Any more losses might signal a move toward 0.6515.
NZD/USD Technical Analysis
On the hourly chart of NZD/USD on FXOpen, the pair corrected lower from the 0.6150 zone. The New Zealand Dollar is now holding the 0.6100 support and eyeing a fresh increase against the US Dollar.
A low has formed near 0.6102 and the pair is consolidating in a range. On the upside, the pair is facing resistance near the 50-hour simple moving average at 0.6610. There is also a major bearish trend line forming with resistance at 0.6110.
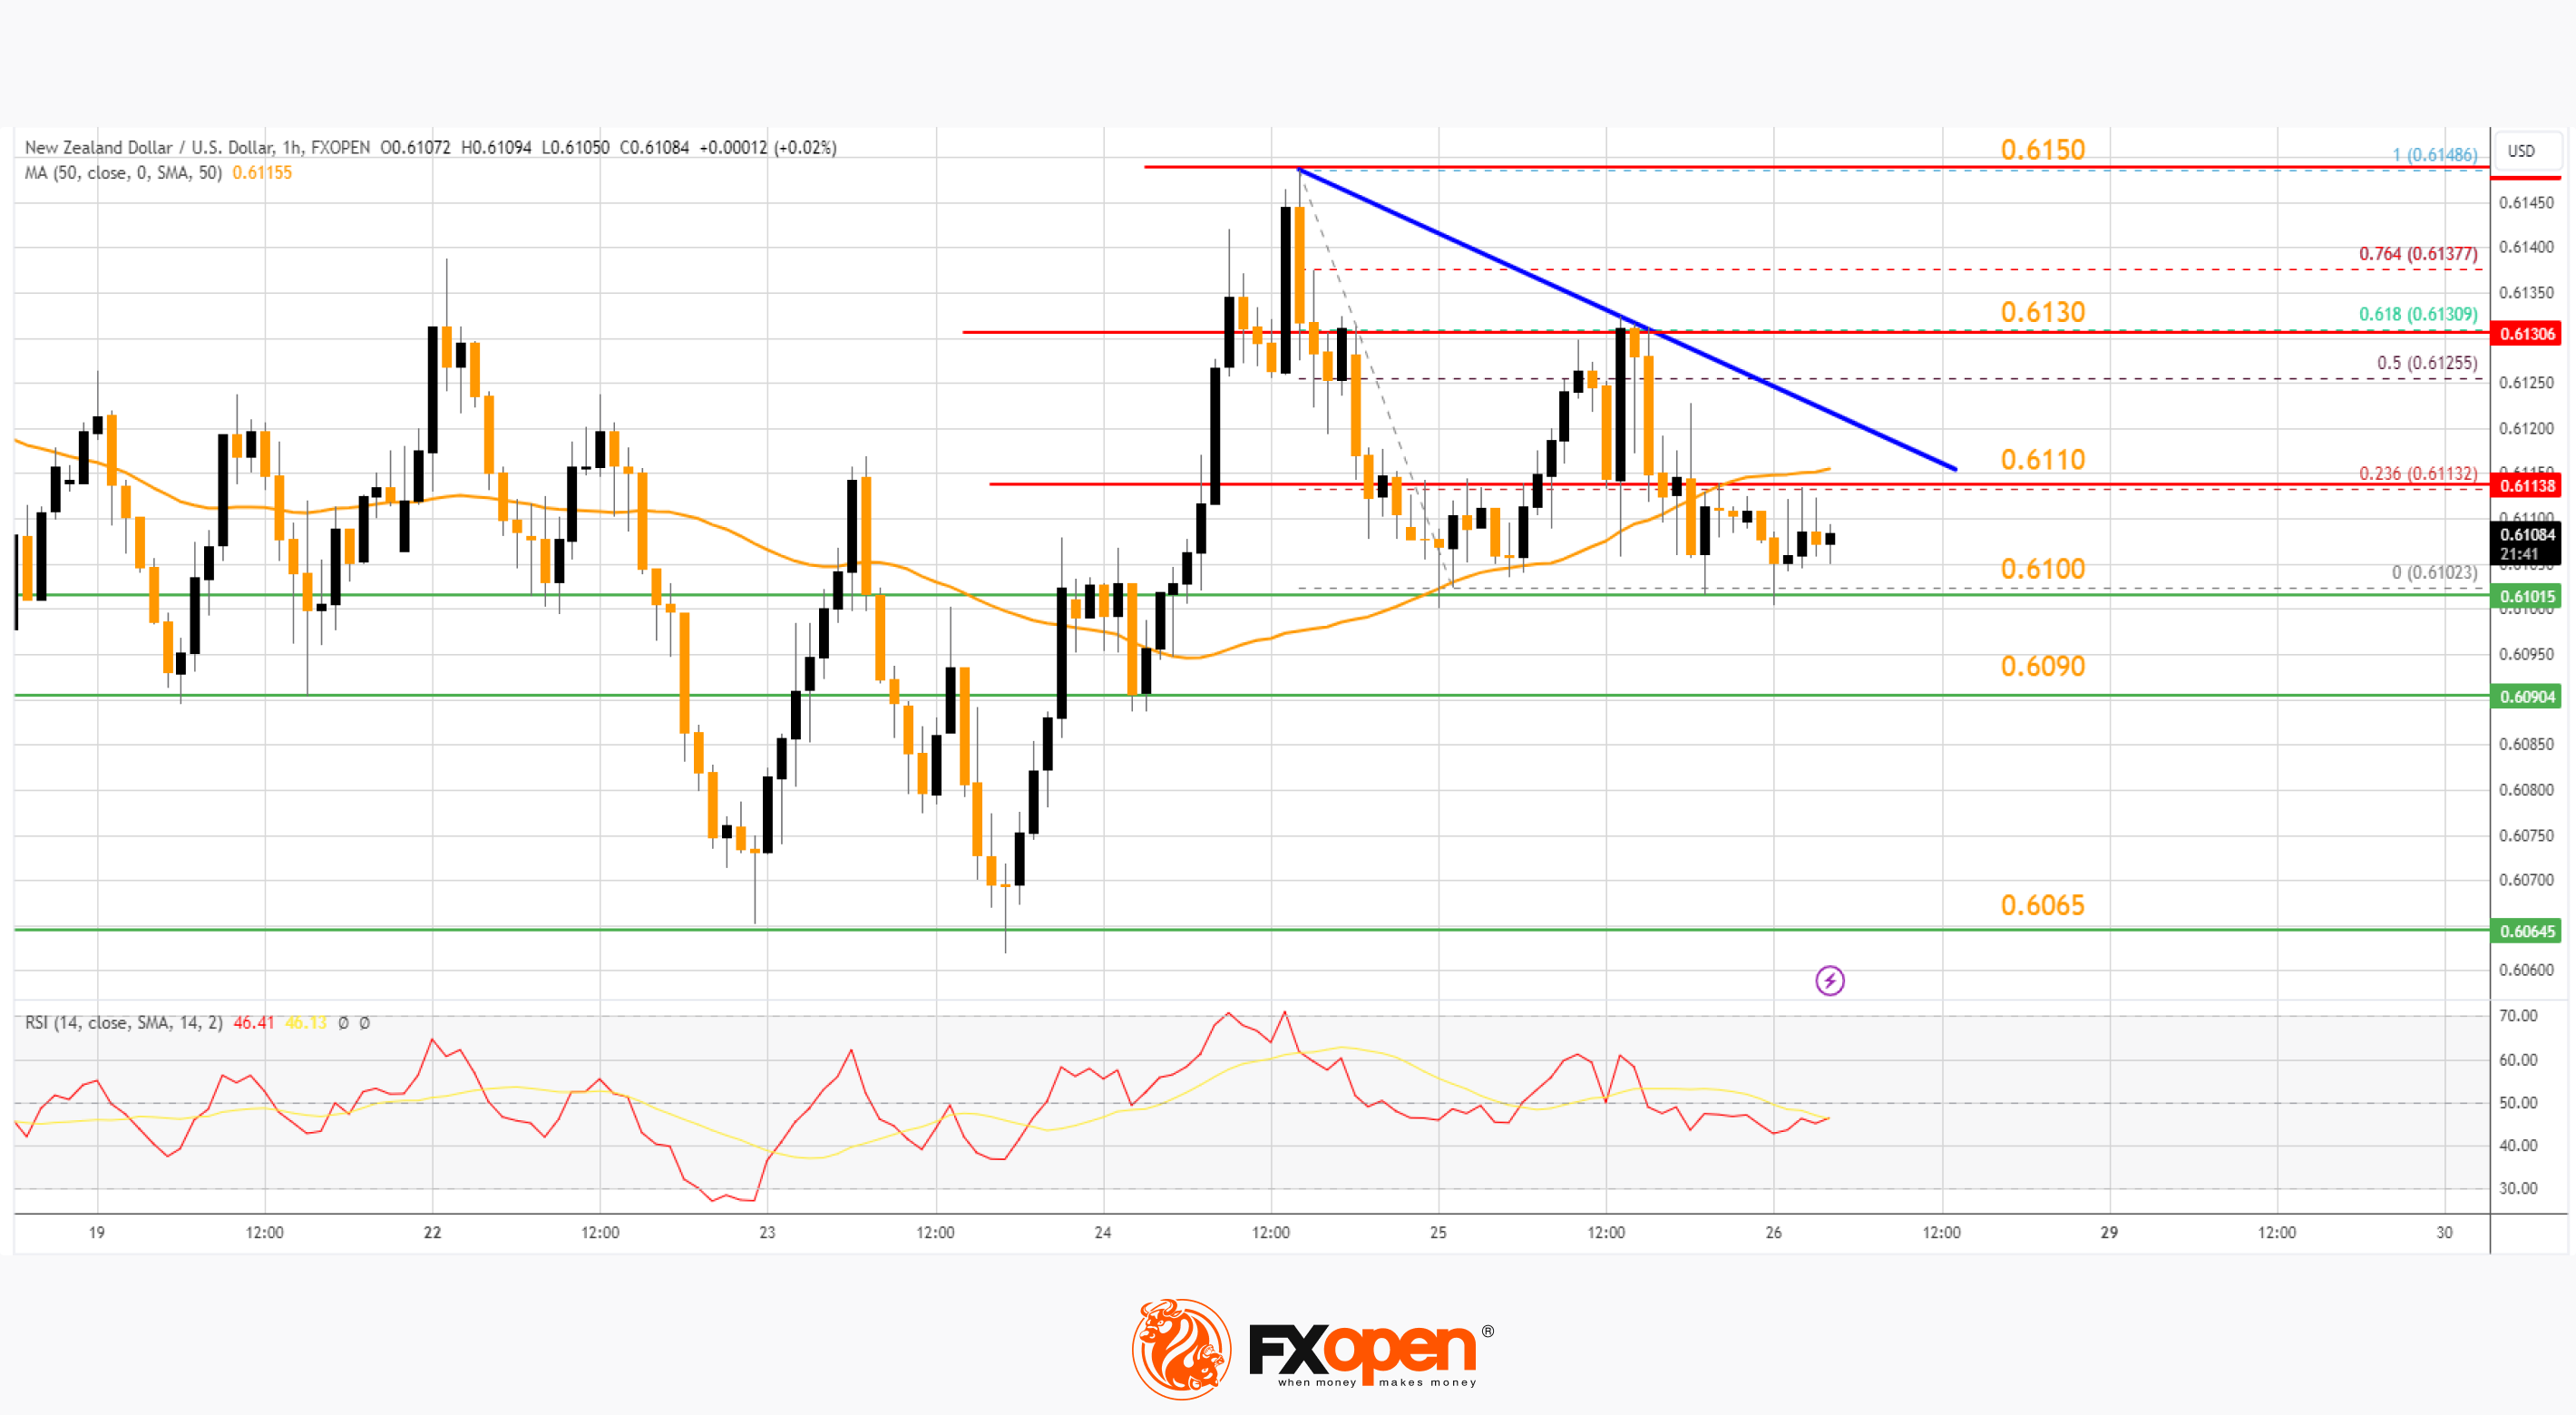
The trend line is close to the 23.6% Fib retracement level of the downward move from the 0.6148 swing high to the 0.6102 low. The NZD/USD chartsuggests that the RSI could move above 50.
The next major resistance is near the 50% Fib retracement level of the downward move from the 0.6148 swing high to the 0.6102 low at 0.6130. A clear move above the 0.6130 level might even push the pair toward the 0.6150 level. Any more gains might clear the path for a move toward the 0.6200 resistance zone in the coming days.
On the downside, there is a support forming near 0.6110. The next major support is 0.6090. If there is a downside break below the 0.6090 support, the pair might slide toward the 0.6040 support. Any more losses could lead NZD/USD in a bearish zone to 0.6000.
Trade over 50 forex markets 24 hours a day with FXOpen. Take advantage of low commissions, deep liquidity, and spreads from 0.0 pips (additional fees may apply). Open your FXOpen account now or learn more about trading forex with FXOpen.
This article represents the opinion of the Companies operating under the FXOpen brand only. It is not to be construed as an offer, solicitation, or recommendation with respect to products and services provided by the Companies operating under the FXOpen brand, nor is it to be considered financial advice.
Stay ahead of the market!
Subscribe now to our mailing list and receive the latest market news and insights delivered directly to your inbox.


Latest articles

EUR/USD and GBP/USD consolidate ahead of the Fed decision
European currencies are showing subdued dynamics, entering a consolidation phase following their previous advance. Earlier, EUR/USD and GBP/USD broke out of their ranges and strengthened; however, the subsequent correction has led both pairs to retest the previously breached

Meta: V-Shaped Recovery Meets Heavy Volume Resistance
The movement in Meta Platforms shares is being driven by two competing narratives. On one hand, advertising revenue is benefiting from AI-based tools: the Advantage+ platform continues to support strong advertiser demand, and the analyst consensus for Q1 2026 revenue

Commodity Currencies Test Key Levels Ahead of Major Macro Data
Commodity-linked currencies are trading near key levels, showing restrained price action as market participants adopt a wait-and-see approach. The fundamental backdrop is shaped by expectations surrounding the release of Australia’s inflation data and the Bank of Canada’s interest