


FXOpen

EUR/USD is recovering losses from 1.1500. USD/JPY is correcting gains from 159.00 and might decline further if it stays below 158.30.
Important Takeaways for EUR/USD and USD/JPY Analysis Today
· The Euro struggled to stay in a positive zone and declined below 1.1700 before finding support.
· There was a break above a connecting bearish trend line with resistance at 1.1580 on the hourly chart of EUR/USD at FXOpen.
· USD/JPY started a decent increase above 157.00 before the bears appeared near 158.90.
· There is a key contracting triangle forming with resistance near 158.30 on the hourly chart at FXOpen.
EUR/USD Technical Analysis
On the hourly chart of EUR/USD at FXOpen, the pair started a fresh decline from 1.1825. The Euro declined below 1.1750 and 1.1700 against the US Dollar.
The pair even declined below 1.1665 and the 50-hour simple moving average. Finally, it tested the 1.1500 zone. A low was formed at 1.1507, and the pair is now recovering losses. There was a move above 1.1550 and a connecting bearish trend line at 1.1580.
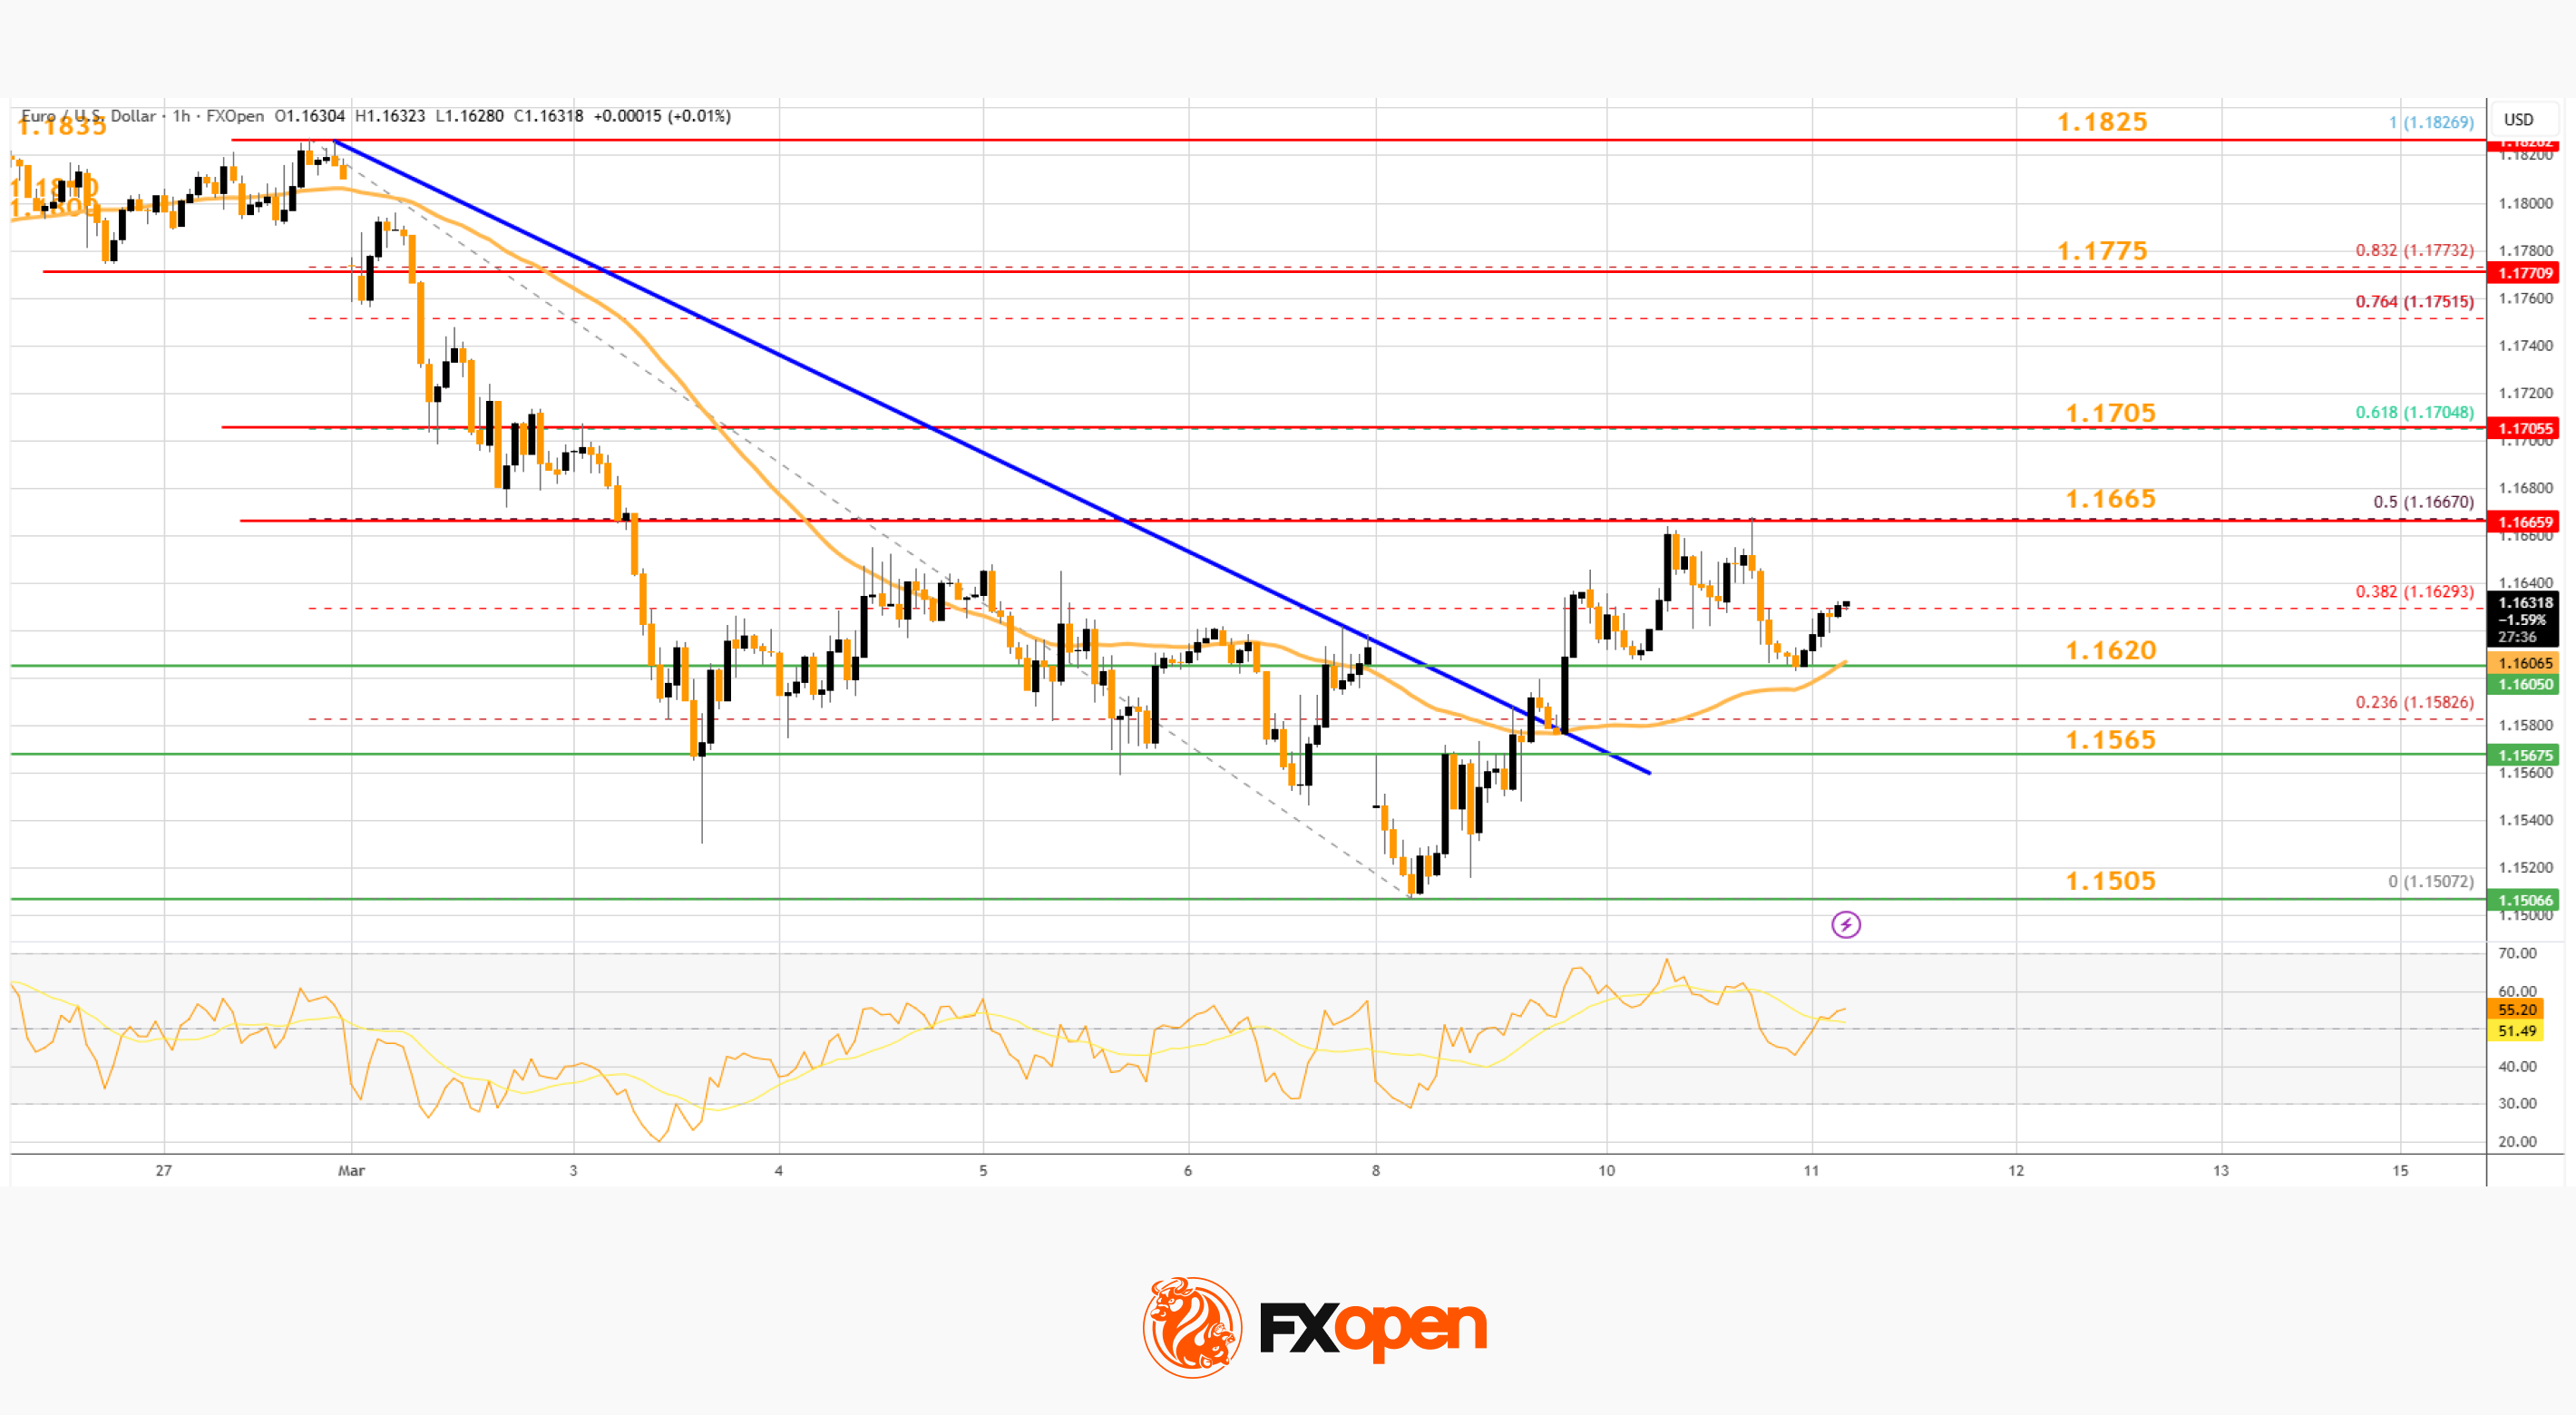
The pair surpassed the 38.2% Fib retracement level of the downward move from the 1.1826 swing high to the 1.1507 low. On the upside, the pair is now facing resistance near the 50% Fib retracement at 1.1665.
The first major hurdle for the bulls could be 1.1705. An upside break above 1.1705 could set the pace for another increase. In the stated case, the pair might rise toward 1.1775.
If not, the pair might drop again. Immediate support is near the 50-hour simple moving average and 1.1620. The next key area of interest might be 1.1565. If there is a downside break below 1.1565, the pair could drop toward 1.1505. The main target for the bears on the EUR/USD chart could be 1.1440, below which the pair could start a major decline.
USD/JPY Technical Analysis
On the hourly chart of USD/JPY at FXOpen, the pair gained pace for a move above 157.00 and 158.00. The US Dollar even traded close to 159.00 against the Japanese Yen before the bears emerged.
A high was formed at 158.90 before there was a downside correction. The pair dipped below 158.00 and the 50% Fib retracement level of the upward move from the 156.45 swing low to the 158.90 high. However, the bulls were active above 157.00 and they protected the 61.8% Fib retracement.
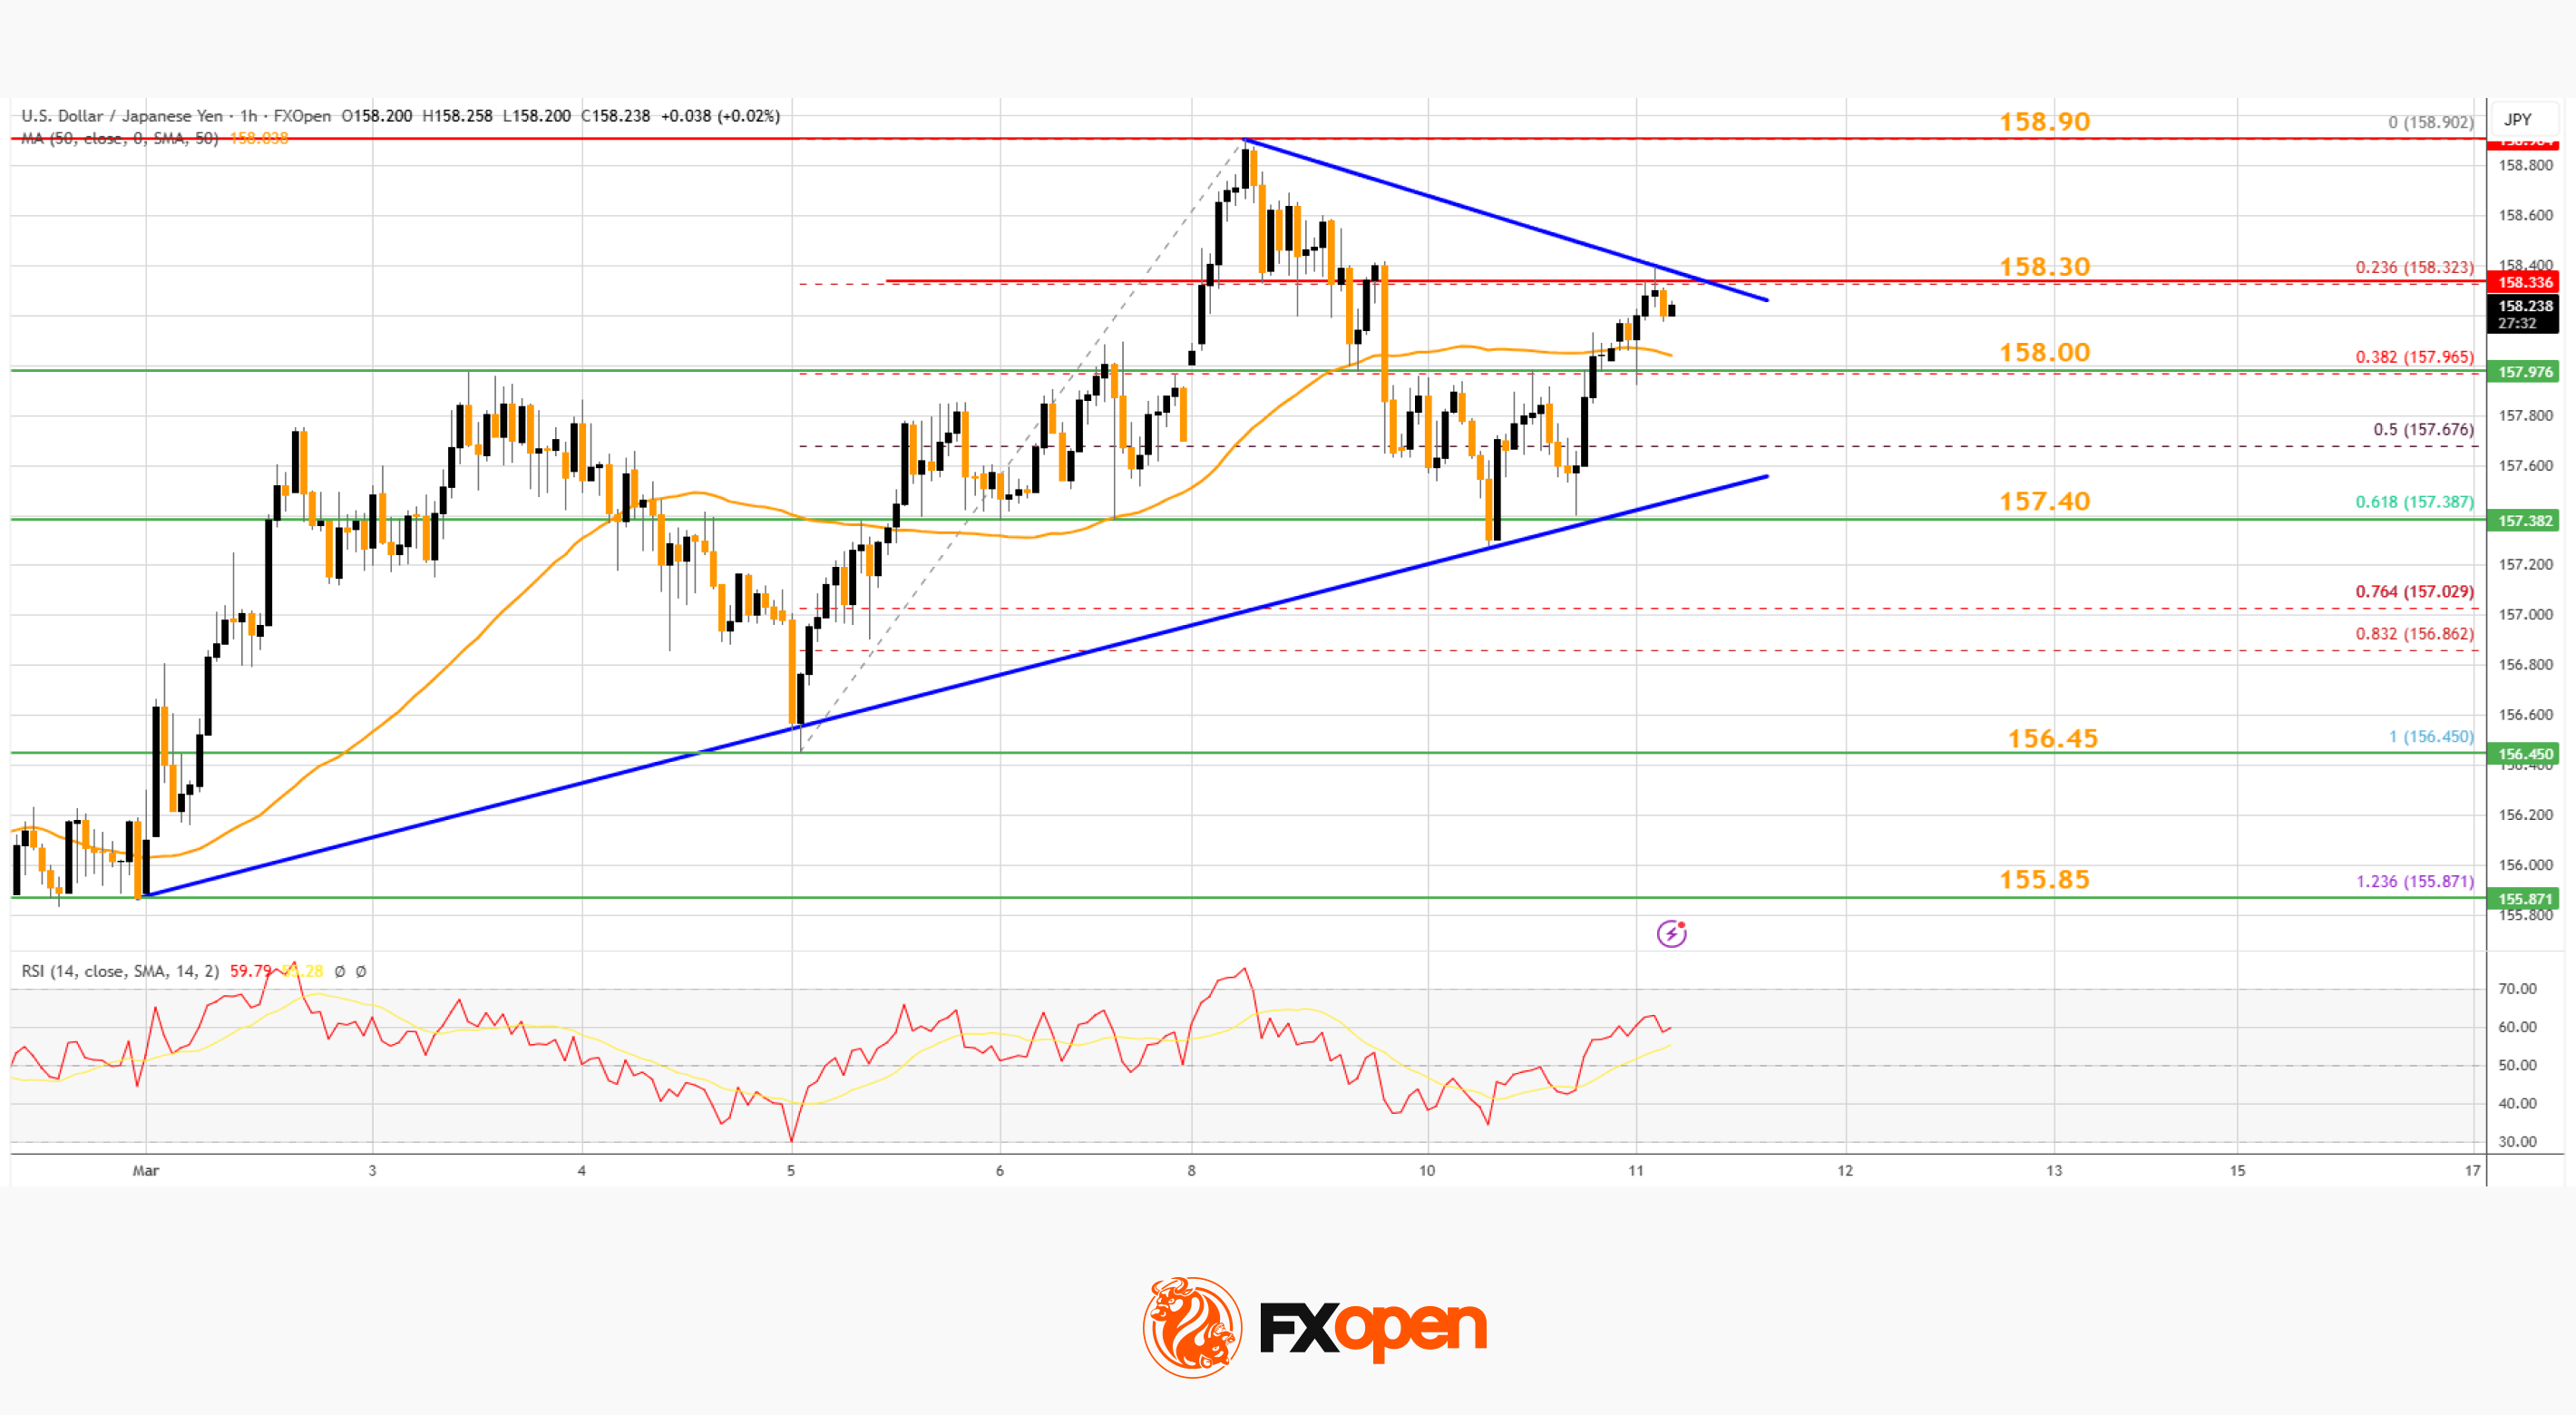
The pair is back above the 50-hour simple moving average and 158.00. Immediate resistance on the USD/JPY chart is near 158.30. There is also a key contracting triangle at 158.30.
If there is a close above the triangle and the hourly RSI moves above 65, the pair could rise toward 158.90. The next major barrier for the bulls could be 159.25, above which the pair could test 160.00 in the near term.
On the downside, the first major support is near 158.00. The next key region for the bulls might be 157.40. If there is a close below 157.40, the pair could decline steadily. In the stated case, the pair might drop toward 156.45. Any more losses might send the pair toward 155.85.
Trade over 50 forex markets 24 hours a day with FXOpen. Take advantage of low commissions, deep liquidity, and spreads from 0.0 pips (additional fees may apply). Open your FXOpen account now or learn more about trading forex with FXOpen.
This article represents the opinion of the Companies operating under the FXOpen brand only. It is not to be construed as an offer, solicitation, or recommendation with respect to products and services provided by the Companies operating under the FXOpen brand, nor is it to be considered financial advice.
Stay ahead of the market!
Subscribe now to our mailing list and receive the latest market news and insights delivered directly to your inbox.


Latest articles

Market Insights with Gary Thomson: Where Are Oil, Gas & Global Indices Heading?
In this video, we’ll explore the key economic events and market trends, shaping the financial landscape. Get ready for insights into financial markets to help you navigate the week ahead. Let’s dive in!
In this episode of Market

Netflix (NFLX) Shares Pull Back After a 30% Surge
On 21 January, while analysing the NFLX chart, we:
→ identified a descending channel and a resistance zone around the $100 level;
→ noted that Netflix shares were showing a sustained downtrend. Selling pressure had been triggered primarily by reports of a

US Dollar Index (DXY) Rises Above the 100 Level
Today the US Dollar Index (DXY) climbed above the psychological 100 mark for the first time in 2026, supported by a tense fundamental backdrop, with the military conflict in the Middle East acting as the main driver.
→ Financial market participants