


Market Analysis: EUR/USD Takes Hit While USD/CHF Surges
FXOpen
EUR/USD started a fresh decline below the 1.0615 support. USD/CHF is rising and might aim a move toward the 0.9220 resistance.
Important Takeaways for EUR/USD and USD/CHF Analysis Today
· The Euro struggled to clear the 1.0670 resistance and declined against the US Dollar.
· There is a major bearish trend line forming with resistance near 1.0585 on the hourly chart of EUR/USD at FXOpen.
· USD/CHF is gaining pace above the 0.9135 resistance zone.
· There is a key bullish trend line forming with support near 0.9150 on the hourly chart at FXOpen.
EUR/USD Technical Analysis
On the hourly chart of EUR/USD at FXOpen, the pair failed to clear the 1.0670 resistance. The Euro started a fresh decline below the 1.0615 support against the US Dollar, as mentioned in the previous analysis.
There was a move below the 50-hour simple moving average and 1.0600. The bears were able to push the pair below the 1.0585 pivot level. The pair traded as low as 1.0556 and is currently showing a lot of bearish signs.
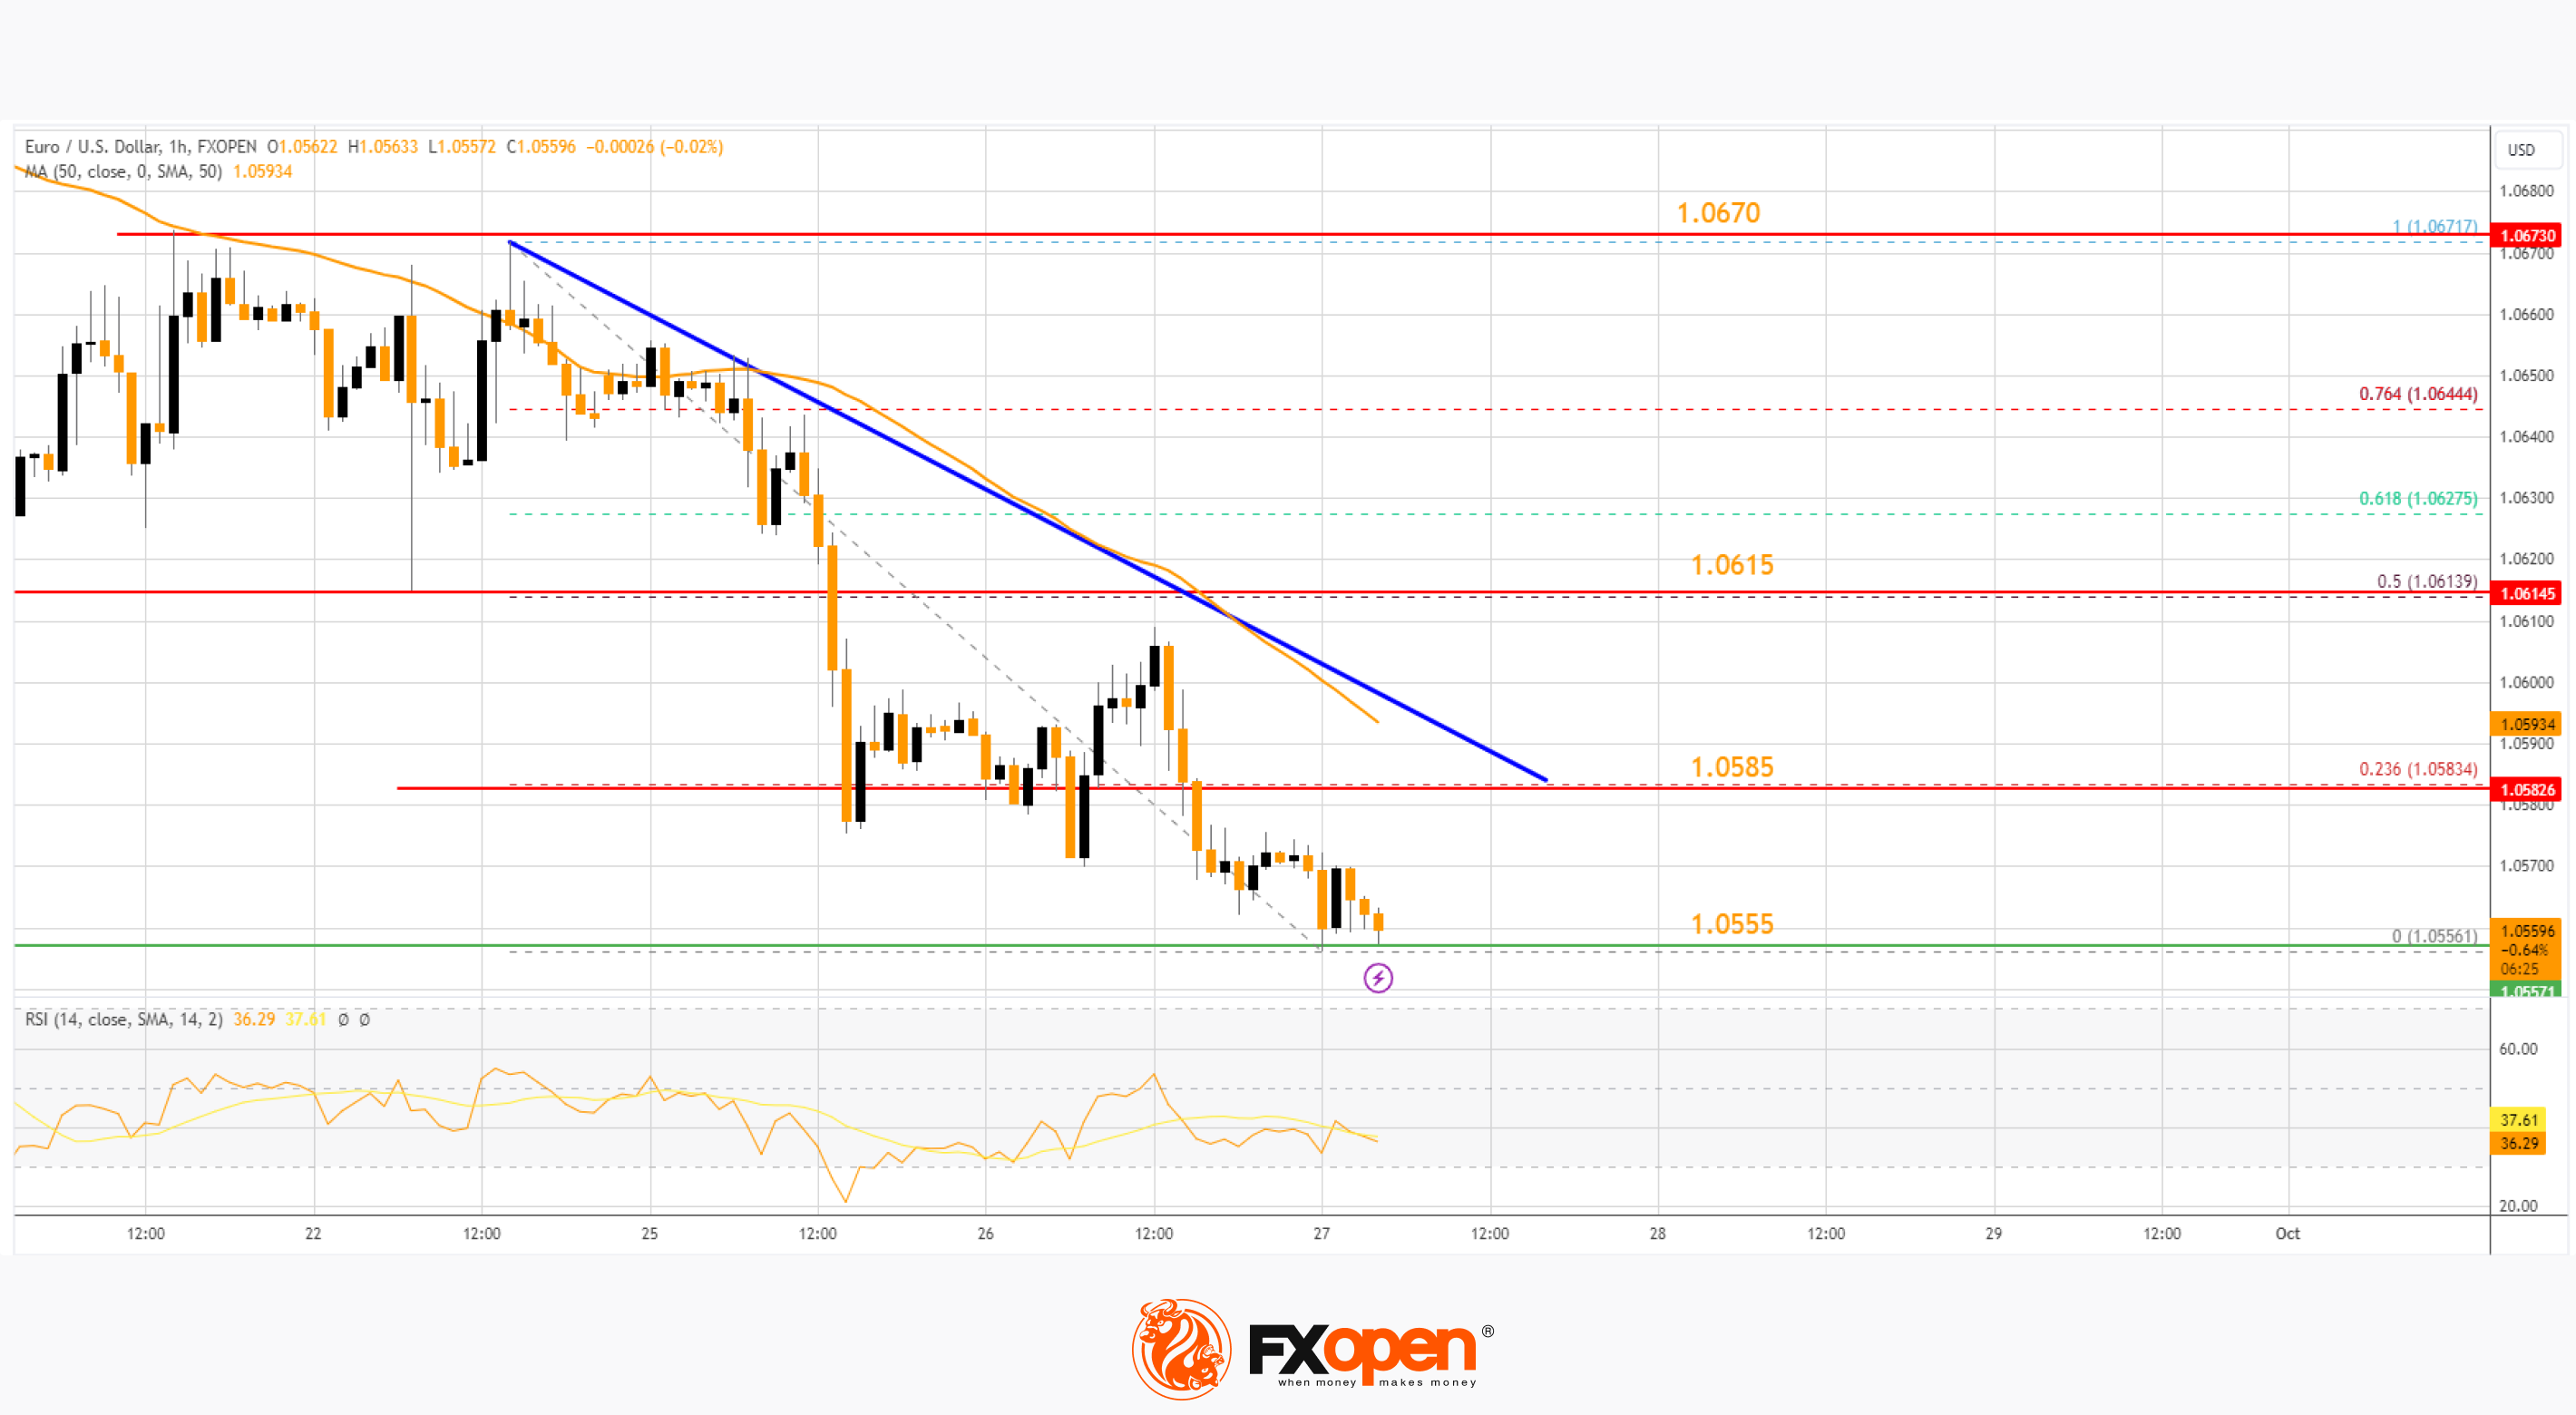
Immediate resistance on the upside is near the 23.6% Fib retracement level of the downward move from the 1.0671 swing high to the 1.0556 low. There is also a major bearish trend line forming with resistance near 1.0585 and the 50-hour simple moving average.
The first major resistance is near the 50% Fib retracement level of the downward move from the 1.0671 swing high to the 1.0556 low at 1.0615. An upside break above the 1.0615 level might send the pair toward the 1.0670 resistance. Any more gains might open the doors for a move toward the 1.0720 level.
On the downside, immediate support on the EUR/USD chart is seen near 1.0555. The next major support is near the 1.0540 level. A downside break below the 1.0540 support could send the pair toward the 1.0500 level.
USD/CHF Technical Analysis
On the hourly chart of USD/CHF at FXOpen, the pair started a decent increase from the 0.8930 support. The US Dollar climbed above the 0.9010 resistance zone against the Swiss Franc.
The bulls were able to pump the pair above the 50-hour simple moving average and 0.9135. A high is formed near 0.9174 and the pair is still showing signs of more upsides. On the upside, the pair is now facing resistance near 0.9175.
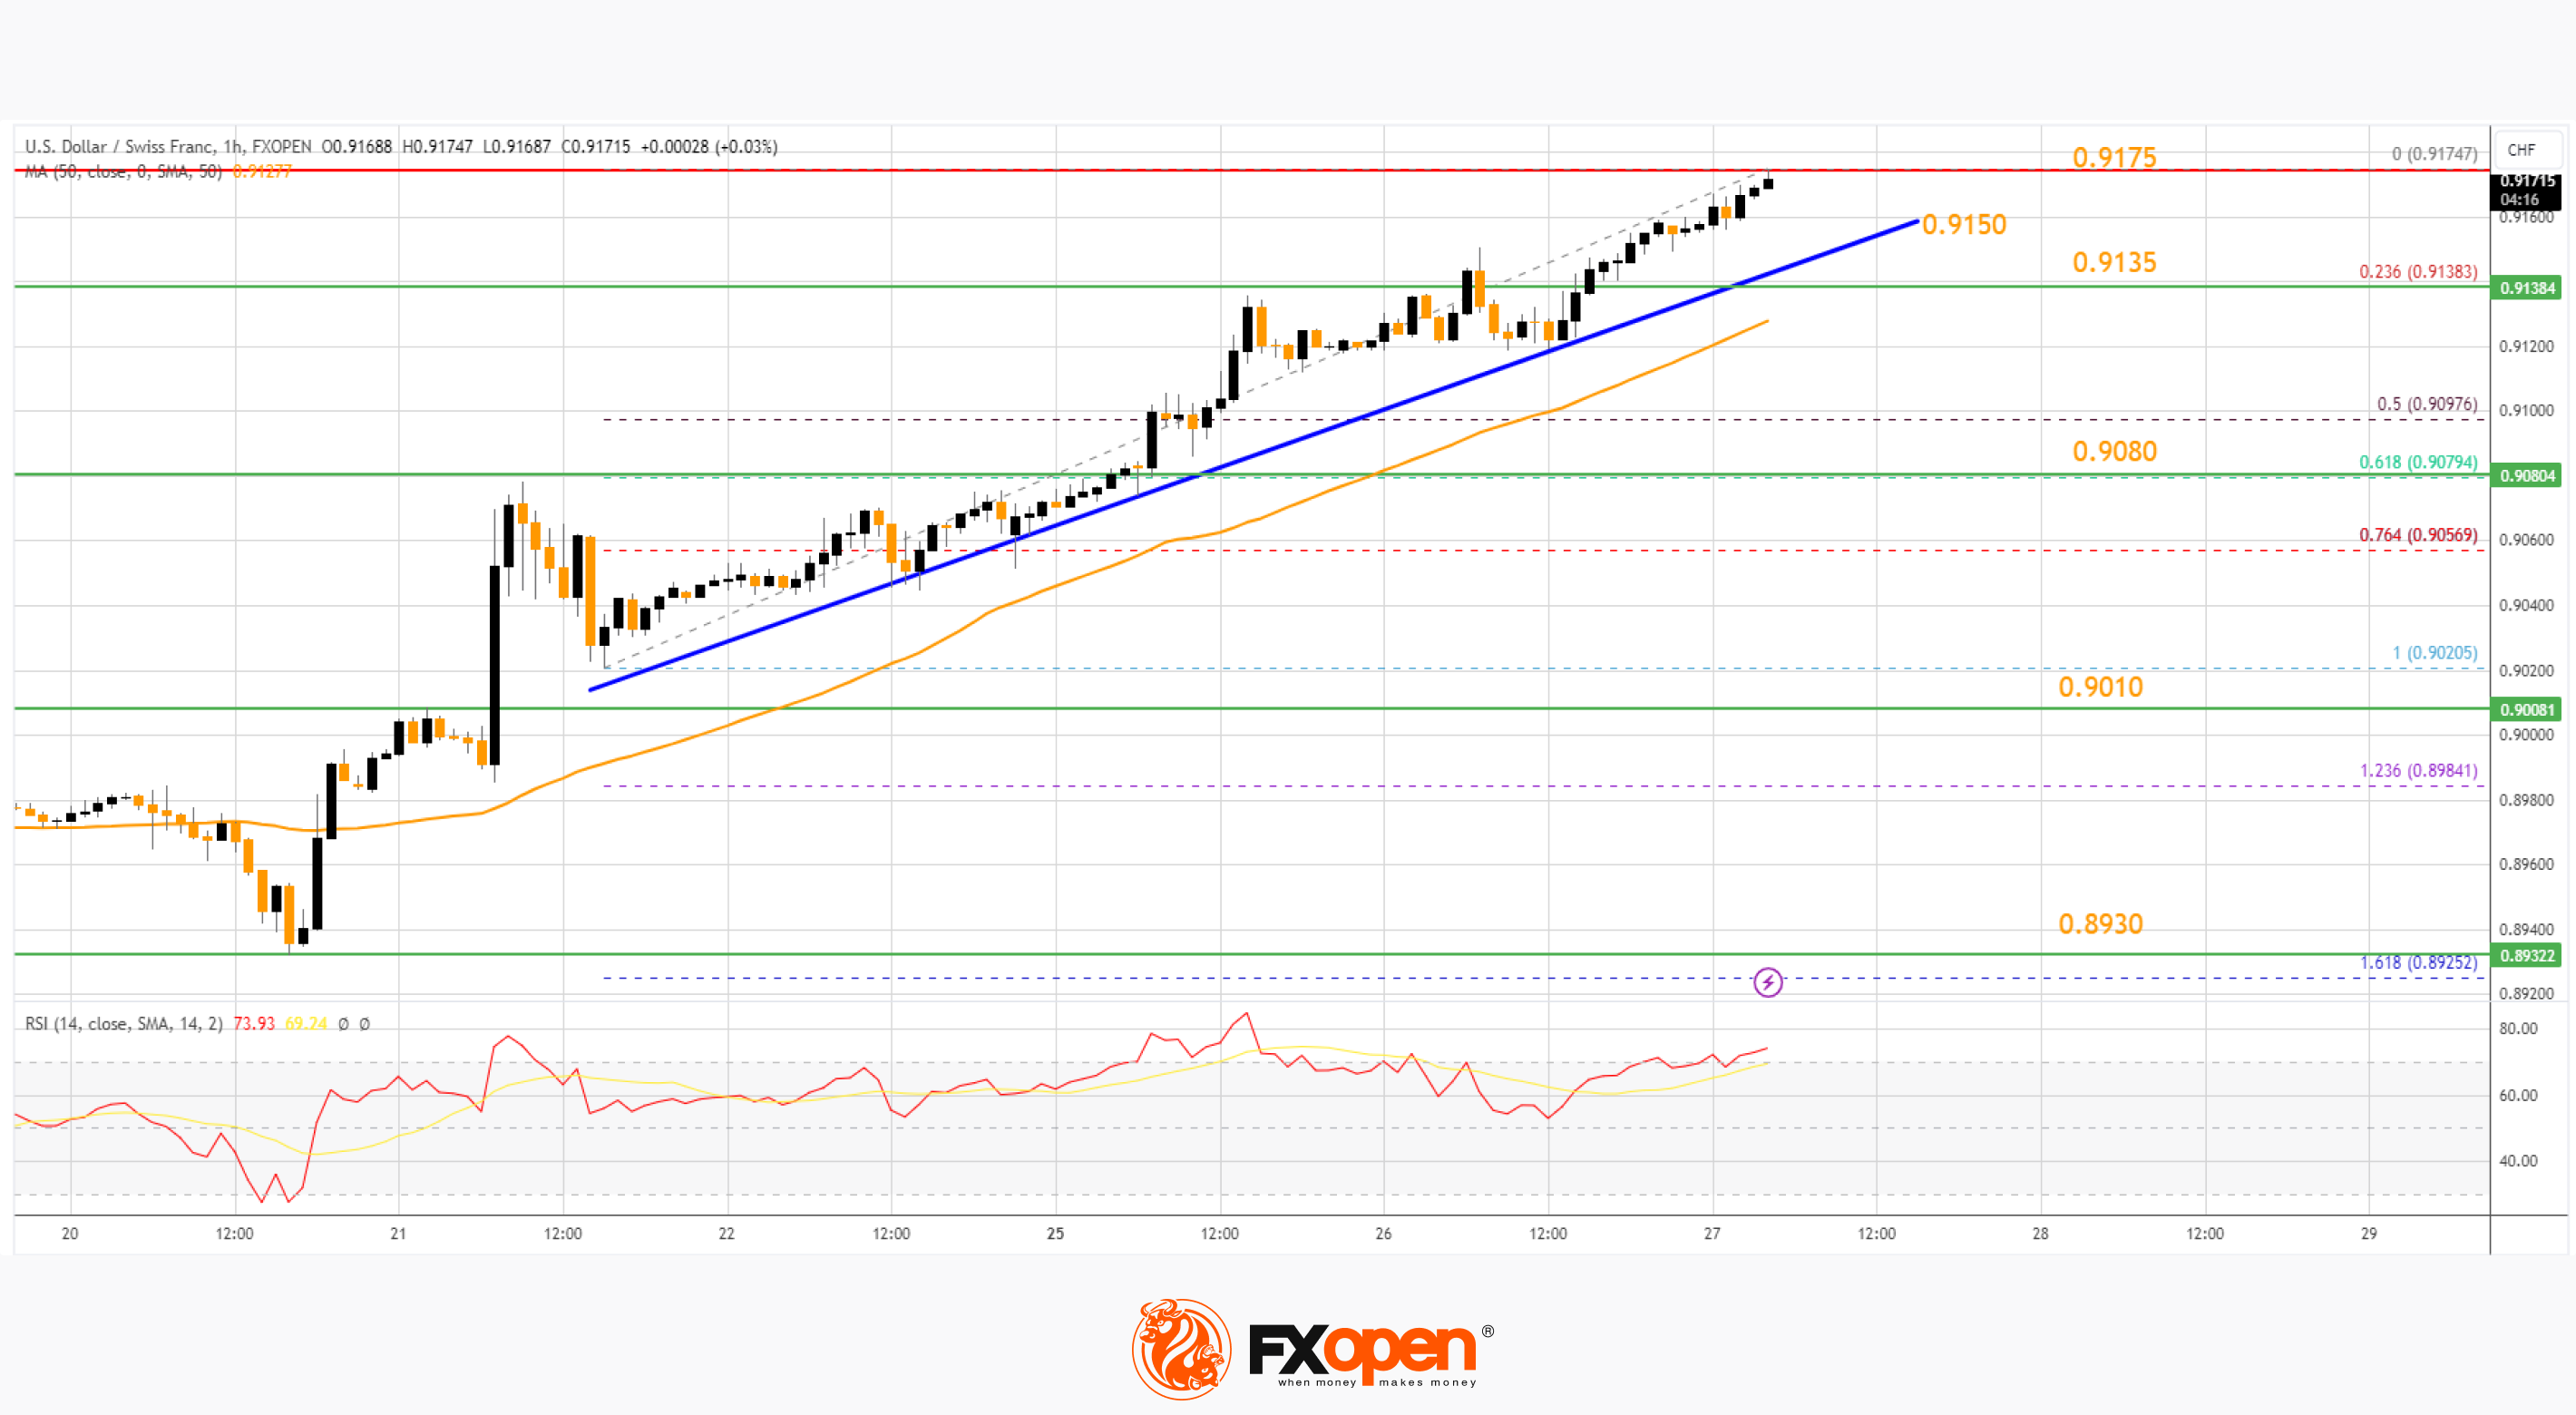
The next major resistance is at 0.9200. The main resistance is now near 0.9220. If there is a clear break above the 0.9220 resistance zone and the RSI climbs above 80, the pair could start another increase. In the stated case, it could test 0.9300.
If not, there could be a downside correction. On the downside, immediate support on the USD/CHF chart is near a key bullish trend line at 0.9150.
The first major support is near the 50-hour simple moving average and the 23.6% Fib retracement level of the upward move from the 0.9020 swing low to the 0.9174 high at 0.9135. A downside break below 0.9135 might spark bearish moves.
The next major support is near the 61.8% Fib retracement level of the upward move from the 0.9020 swing low to the 0.9174 high at 0.9080. Any more losses may possibly open the doors for a move toward the 0.9010 level in the near term.
Trade over 50 forex markets 24 hours a day with FXOpen. Take advantage of low commissions, deep liquidity, and spreads from 0.0 pips (additional fees may apply). Open your FXOpen account now or learn more about trading forex with FXOpen.
This article represents the opinion of the Companies operating under the FXOpen brand only. It is not to be construed as an offer, solicitation, or recommendation with respect to products and services provided by the Companies operating under the FXOpen brand, nor is it to be considered financial advice.
Stay ahead of the market!
Subscribe now to our mailing list and receive the latest market news and insights delivered directly to your inbox.


Latest articles

USD/JPY: Battling at the Top of the Triangle
On 3 July, Japan's Finance Minister, Satsuki Katayama, stated that the Ministry of Finance remains in close contact with US authorities regarding developments in USD/JPY as the yen traded near its weakest level in almost 40 years. Similar verbal

Dow Jones (DJIA): Consolidation Beyond the Trend
Federal Reserve Chair Kevin Warsh testified before Congress on 14–15 July, reaffirming the Fed's commitment to bringing inflation back to target while providing no clear guidance on the future path of interest rates. Meanwhile, June inflation data came in

European Currencies Strengthen Ahead of Key Macroeconomic Releases
EUR/USD and GBP/USD continue to recover moderately following the recent weakening of the US dollar. European currencies have been supported by expectations that US inflationary pressures will continue to ease after softer-than-expected CPI and PPI data, reinforcing market