


FXOpen

Gold price started a fresh surge above $4,350 and traded to a new all-time high. Crude oil is recovering and might rise toward the $58.50 resistance zone.
Important Takeaways for Gold and WTI Crude Oil Prices Analysis Today
· Gold price rallied to a new all-time high and traded above $4,395 against the US Dollar.
· A key bullish trend line is forming with support at $4,334 on the hourly chart of gold at FXOpen.
· WTI Crude oil is recovering losses and trading above $56.20.
· There was a break above a major bearish trend line with resistance at $56.00 on the hourly chart of XTI/USD at FXOpen.
Gold Price Technical Analysis
On the hourly chart of Gold at FXOpen, the price formed support near $4,240. The price remained in a bullish zone and started a fresh increase above $4,300, as mentioned in the previous analysis.
The bulls pushed the price above $4,360 level and the 50-hour simple moving average. Finally, it traded to a new all-time high at $4,397. The price is still showing bullish signs above $4,380, and the RSI is above 70.
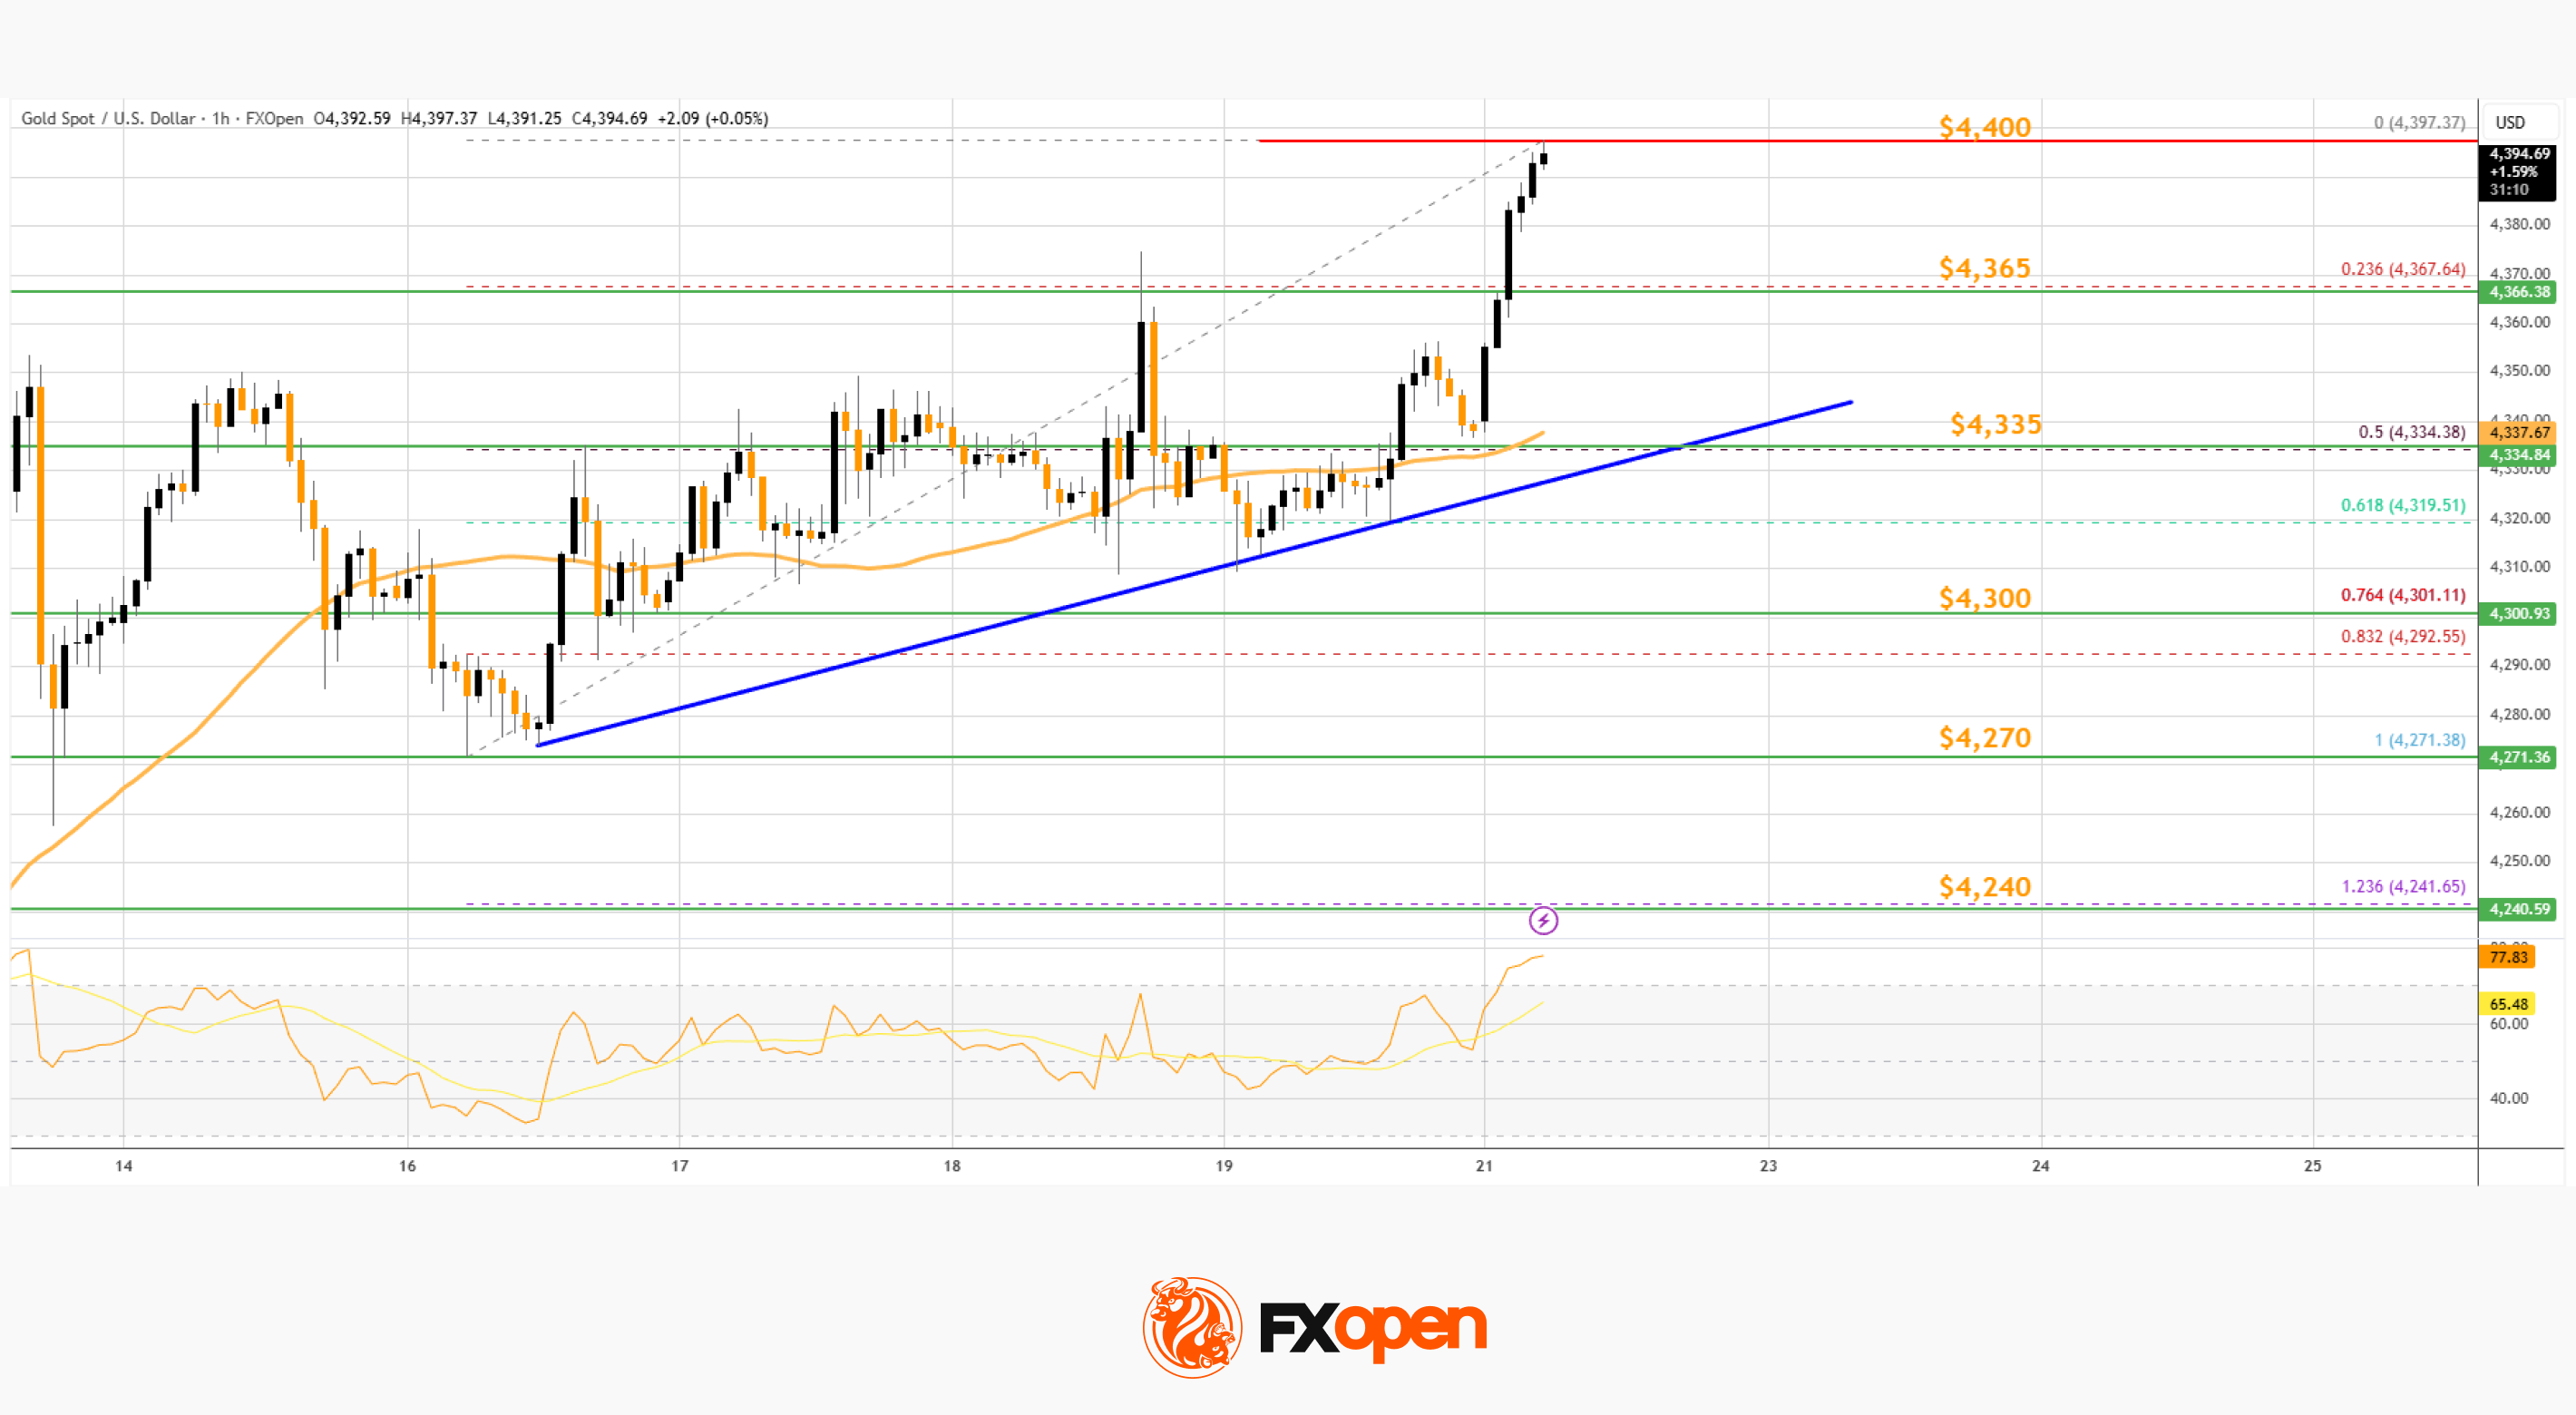
Initial support on the downside is near the 23.6% Fib retracement level of the upward move from the $4,271 swing low to the $4,397 high at $4,365. The next area of interest might be near a key bullish trend line at $4,335 and the 50% Fib retracement.
A downside break below the trend line might send the price to $4,300. If the bulls fail to protect $4,300, the price could start a larger downside correction. In the stated case, Gold could drop toward $4,240.
The next area for the bulls might be $4,220. A daily close below $4,220 could spark bearish moves and send the price to $4,150.
If there is a fresh increase, the price could face resistance at $4,400. The next sell zone might be $4,420. An upside break above the $4,420 resistance could send Gold price toward $4,465. Any more gains may perhaps set the pace for an increase to $4,500.
WTI Crude Oil Price Technical Analysis
On the hourly chart of WTI Crude Oil at FXOpen, the price found support near $54.85 against the US Dollar. The price formed a base and started a recovery wave above $55.50 and the 50-hour simple moving average.
The bulls were able to push the price above the 23.6% Fib retracement level of the downward move from the $58.80 swing high to the $54.84 swing low. Besides, there was a break above a major bearish trend line with resistance at $56.00.
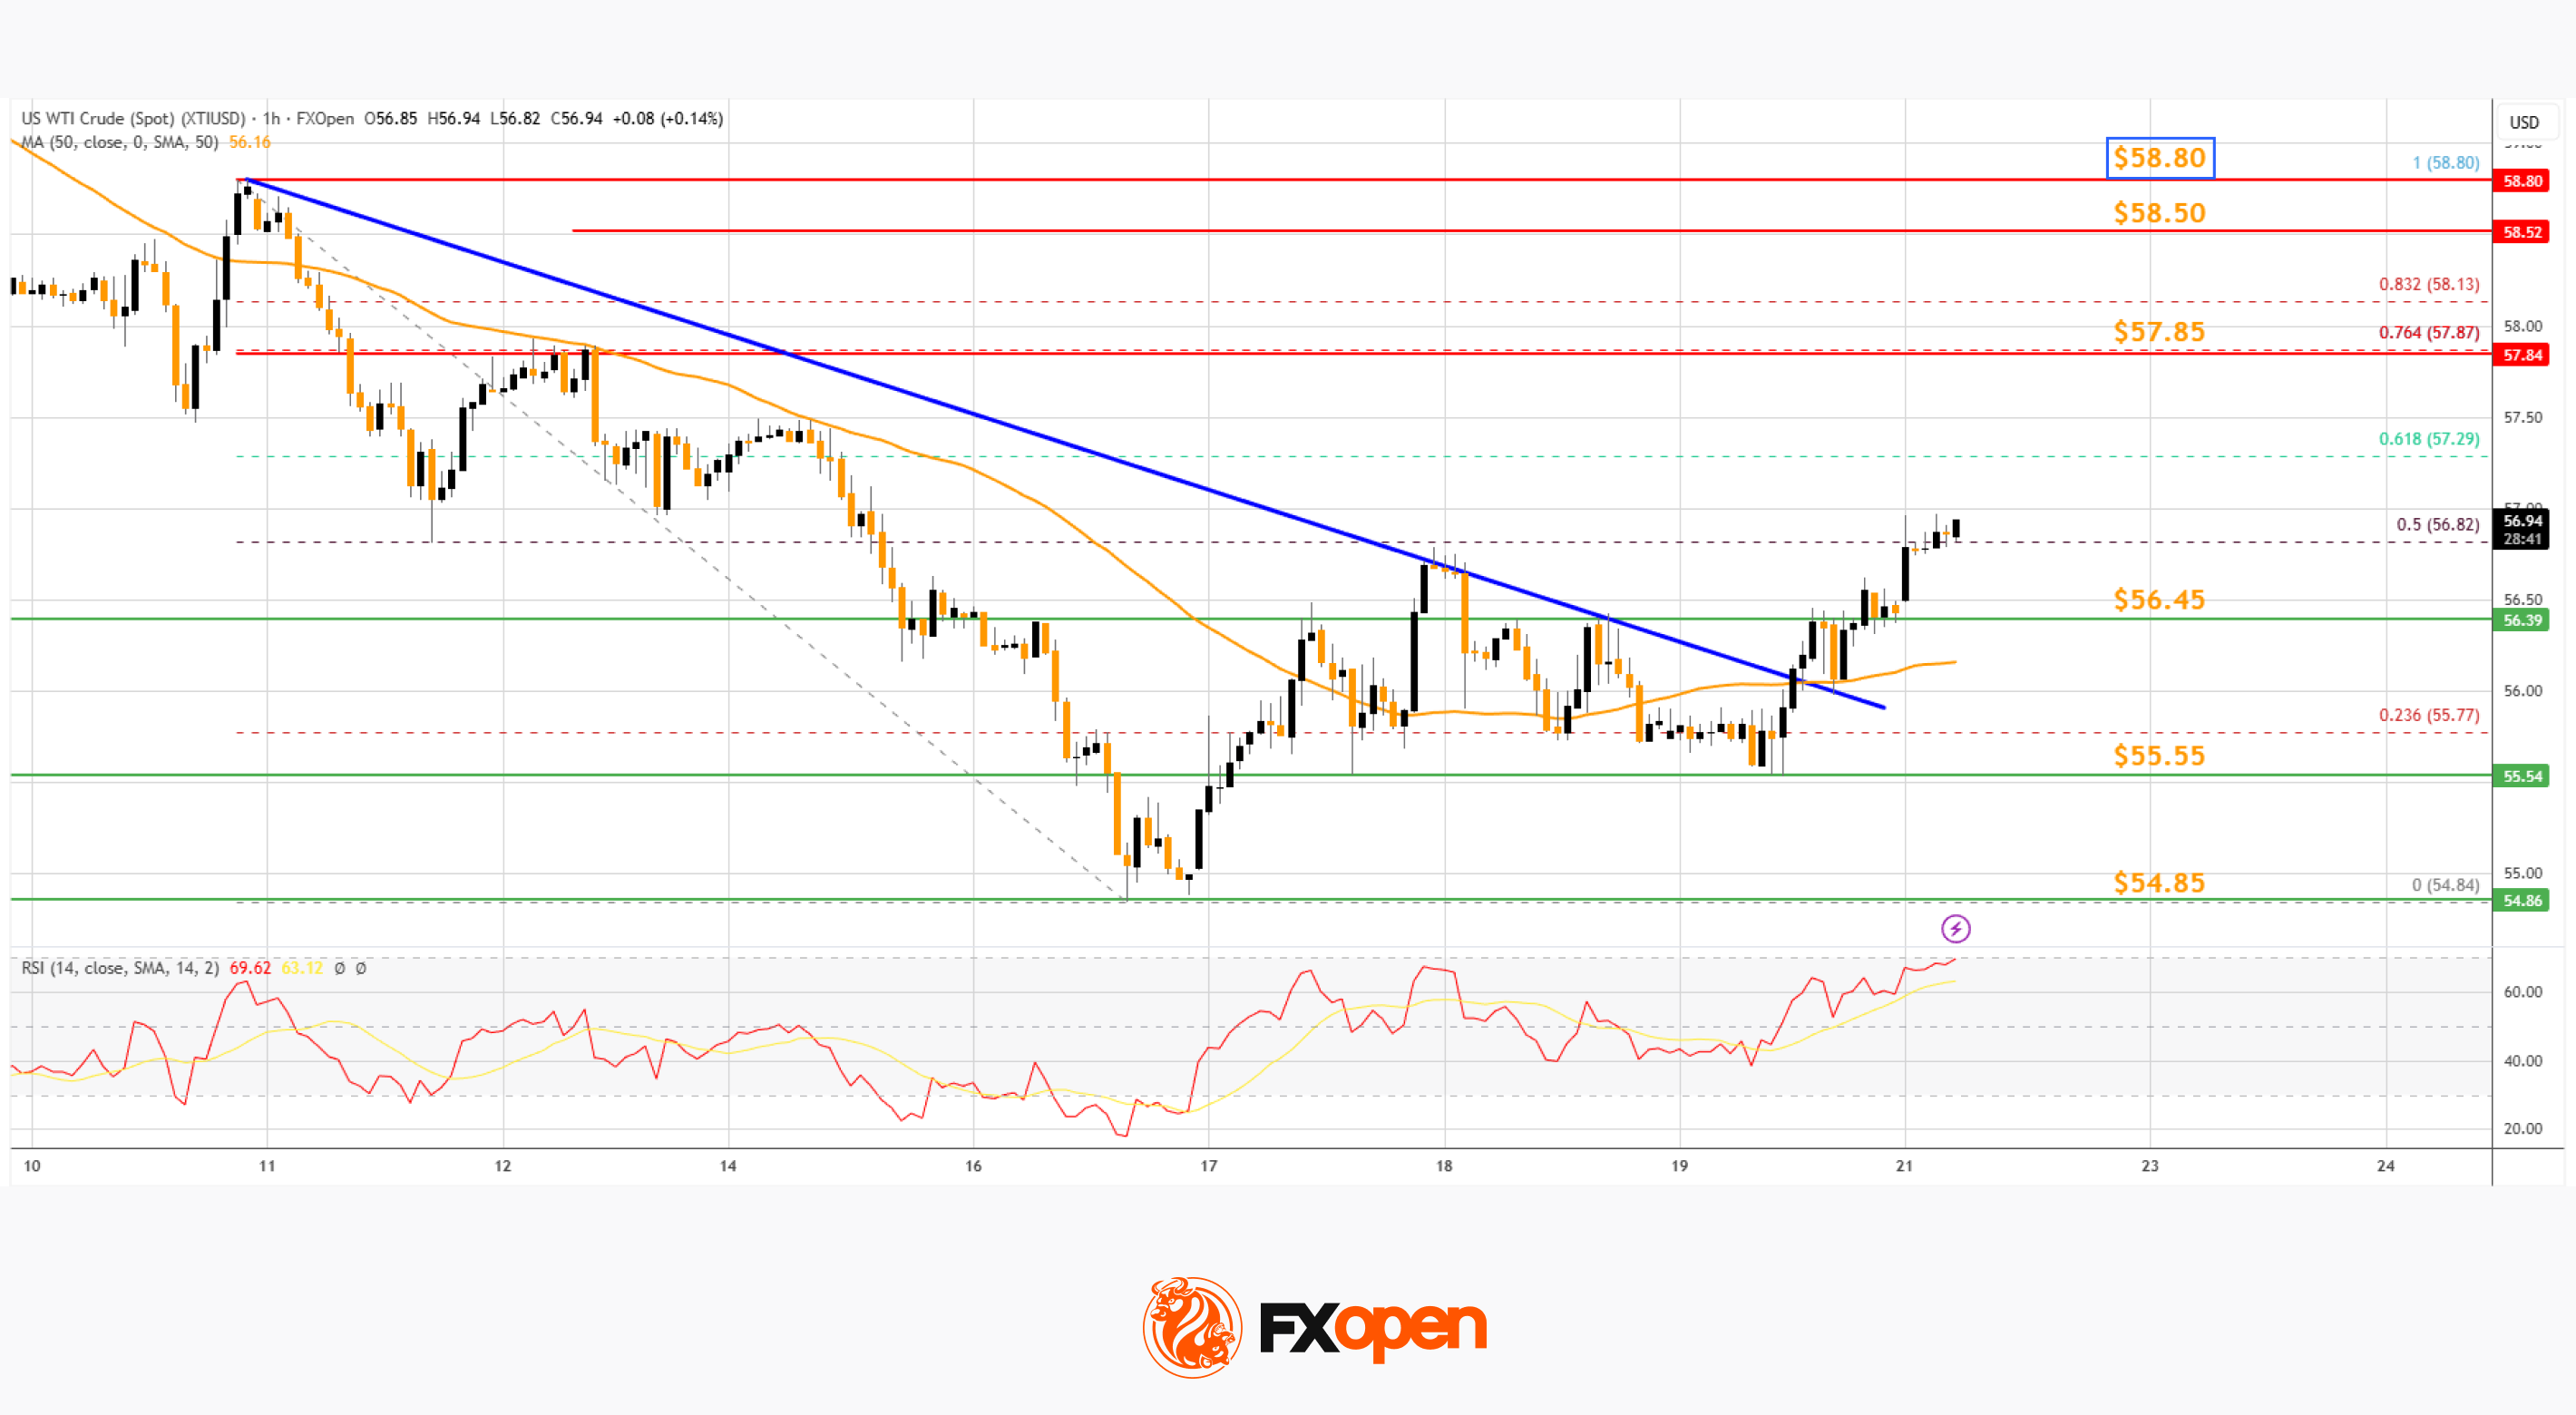
The hourly RSI is above the 60 level, and the price is attempting to close above the 50% Fib retracement. The next hurdle could be $57.85. A clear move above $57.85 could send the price toward $58.50. Any more gains might open the doors for a test of $58.80.
Conversely, the price might start a fresh decline from $57.30 or $57.85. Immediate support sits near $56.45 or the 50-hour simple moving average. The key breakdown zone on the WTI crude oil chart might be $55.55.
If there is a downside break, the price might decline toward $54.85. Any more losses might encourage the bears for a push toward $54.00.
Start trading commodity CFDs with tight spreads (additional fees may apply). Open your trading account now or learn more about trading commodity CFDs with FXOpen.
This article represents the opinion of the Companies operating under the FXOpen brand only. It is not to be construed as an offer, solicitation, or recommendation with respect to products and services provided by the Companies operating under the FXOpen brand, nor is it to be considered financial advice.
Stay ahead of the market!
Subscribe now to our mailing list and receive the latest market news and insights delivered directly to your inbox.


Latest articles

Alphabet (GOOGL) Shares Fall to 2026 Low
As the chart shows, Alphabet (GOOGL) shares have dropped to their lowest level of 2026, with trading closing well below the psychological $300 per share mark.
Why Have Alphabet (GOOGL) Shares Declined?
The bearish move is driven by a combination

FX Market Awaits Macro Data: EUR/USD and GBP/USD Near Range Boundaries
European currencies are trading without a clear direction against the US dollar, remaining in a consolidation phase following the earlier decline driven by USD strength. At the start of the week, both EUR/USD and GBP/USD attempted a recovery,

Market Analysis: AUD/USD, NZD/USD Struggle at Resistance, Upside Chances Diminish
AUD/USD is attempting a recovery wave from 0.6910. NZD/USD is also correcting losses and might recover if there is a clear move above 0.5885.
Important Takeaways for AUD/USD and NZD/USD Analysis Today
· The Aussie